. 2018 Jul 2;215(7):1839-1852.
doi: 10.1084/jem.20180198. Epub 2018 Jun 21.

A20 and ABIN-1 synergistically preserve intestinal epithelial cell survival

Affiliations

A20 and ABIN-1 synergistically preserve intestinal epithelial cell survival

Michael G Kattah et al. J Exp Med. .

Abstract

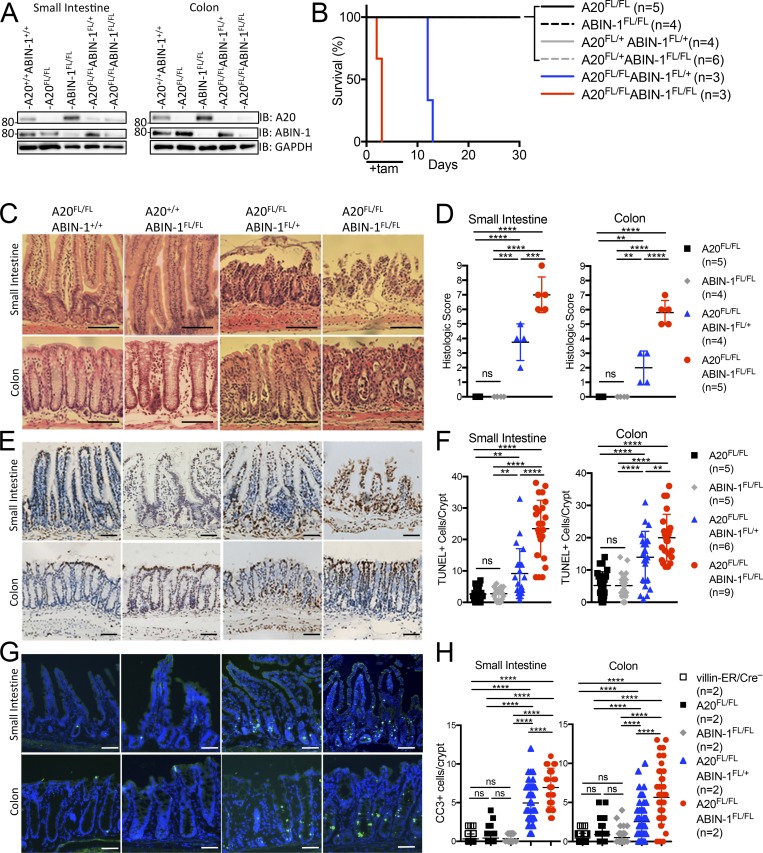
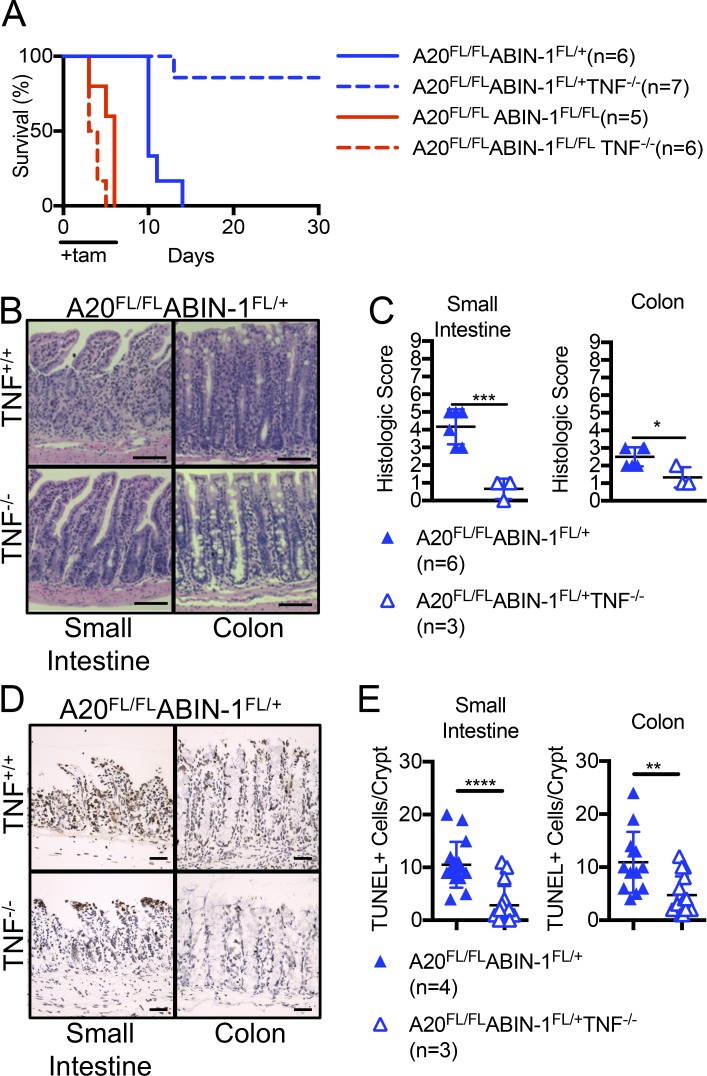
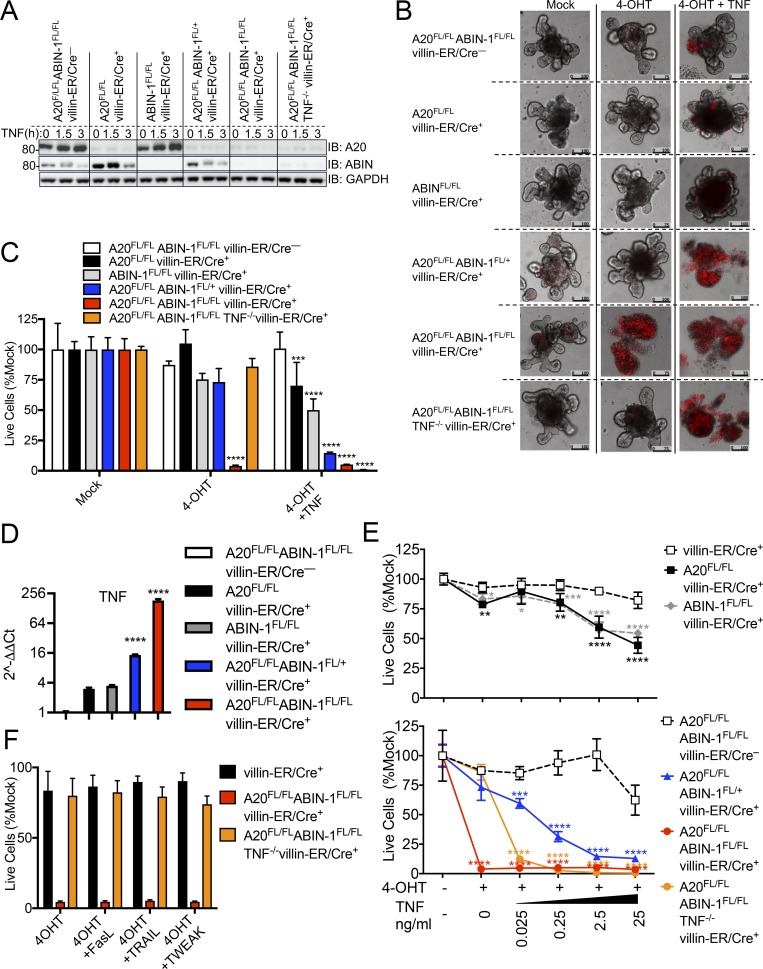
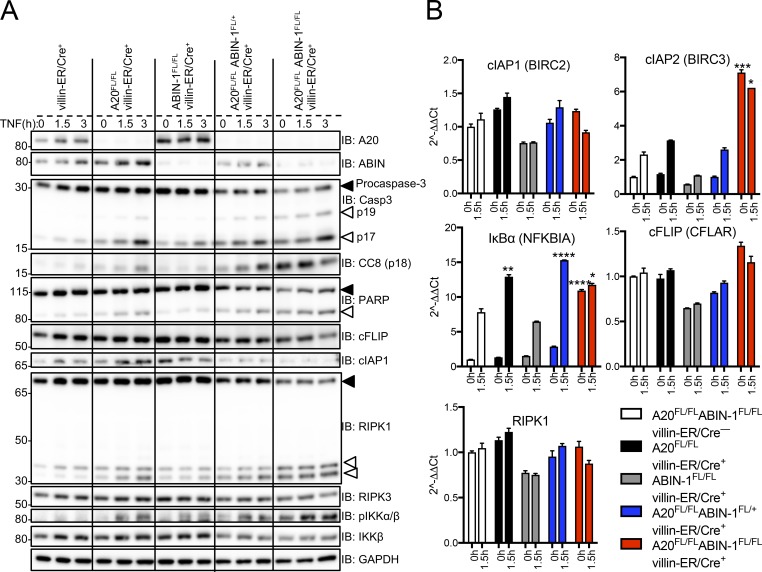
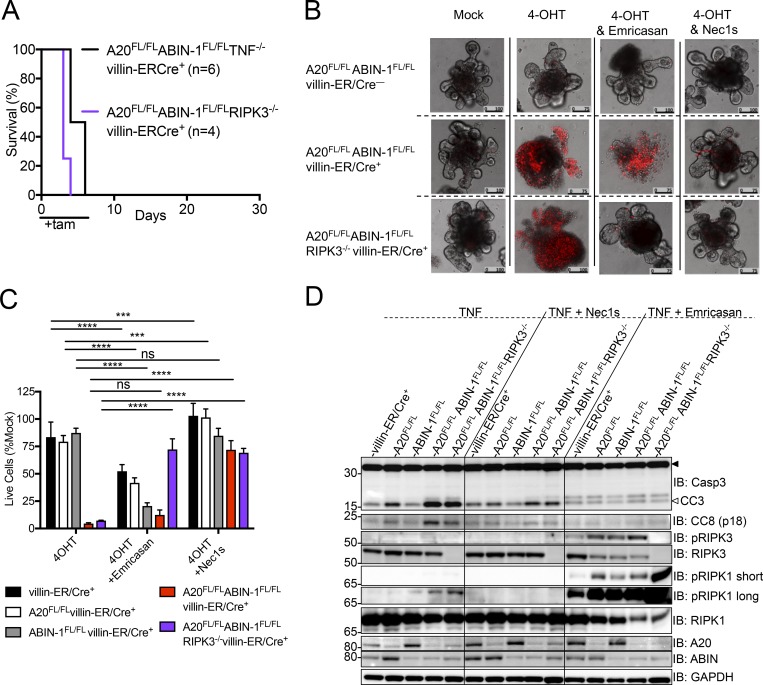
A20 (TNFAIP3) and ABIN-1 (TNIP1) are candidate susceptibility genes for inflammatory bowel disease and other autoimmune or inflammatory diseases, but it is unclear how these proteins interact in vivo to prevent disease. Here we show that intestinal epithelial cell (IEC)-specific deletion of either A20 or ABIN-1 alone leads to negligible IEC loss, whereas simultaneous deletion of both A20 and ABIN-1 leads to rapid IEC death and mouse lethality. Deletion of both A20 and ABIN-1 from enteroids causes spontaneous cell death in the absence of microbes or hematopoietic cells. Studies with enteroids reveal that A20 and ABIN-1 synergistically restrict death by inhibiting TNF-induced caspase 8 activation and RIPK1 kinase activity. Inhibition of RIPK1 kinase activity alone, or caspase inhibition combined with RIPK3 deletion, abrogates IEC death by blocking both apoptosis and necroptosis in A20 and ABIN-1 double-deficient cells. These data show that the disease susceptibility proteins A20 and ABIN-1 synergistically prevent intestinal inflammation by restricting IEC death and preserving tissue integrity.


Figures

Figure 1.
Figure 1.
A20 and ABIN-1 cooperatively restrict intestinal epithelial apoptotic death in vivo. (A) Immunoblot of A20 and ABIN-1 in freshly isolated IEC lysates from the indicated genotypes of mice on the villin-ER/Cre+ background 40 h after initial tamoxifen injection. (B) Kaplan-Meier survival curves of the indicated genotypes of mice on the villin-ER/Cre+ background treated with tamoxifen (tam) for 5 d. (C) Representative H&E slides and (D) histological scoring of H&E-stained small intestinal and colonic sections 36 h after tamoxifen injection in mice with the indicated genotype; each data point represents one mouse (mean ± SD). The score ranges from 0 to 9, where no inflammation is 0 and the most severe inflammation is 9. (E) Representative TUNEL staining and (F) quantitation of TUNEL+ cells per villus of small intestinal and colonic sections 36 h after tamoxifen injection in mice with the indicated genotype; each data point represents one villus (mean ± SD). (G) Representative CC3 immunofluorescence and (H) quantitation of CC3+ cells per crypt from small intestinal and colonic sections 36 h after tamoxifen injection in mice with the indicated genotype; each data point represents one villus (mean ± SD). For D, F, and H statistical significance was assessed by one-way ANOVA with Tukey’s multiple comparison test; *, P < 0.05; **, P < 0.01; ***, P < 0.001; ****, P < 0.0001. The number of mice in each group is indicated in the graph legends. Data are representative of at least two independent experiments. Bars, 50 μm.
Figure 2.
Figure 2.
Mortality of A20FLABINFL villin-ER/Cre+ mice involves both TNF-dependent and TNF-independent signals in vivo. (A) Kaplan-Meier survival curves after the indicated genotypes of mice on the villin-ER/Cre+ background were treated with tamoxifen for 5 d. The number of mice in each group is indicated in the graph legend. (B) Representative H&E sections and (C) cumulative histology scores from mice in A. Each data point represents one mouse (mean ± SD). (D) Representative TUNEL staining and (E) quantitation of TUNEL+ cells per villus of small intestinal and colonic sections 36 h after tamoxifen injection in A20FL/FLABIN-1FL/+ villin-ER/Cre+ mice; each data point represents one villus (mean ± SD). For C and E, the number of mice in each group is indicated in the graph legends, and statistical significance was assessed by two-tailed t test; *, P < 0.05; **, P < 0.01; ***, P < 0.001; ****, P < 0.0001. Data are representative of at least two independent experiments. Bars, 50 μm.
Figure 3.
Figure 3.
Combined deletion of A20 and ABIN-1 sensitizes enteroids to TNF-induced cell death. (A) Immunoblot analyses of A20 and ABIN-1 expression in enteroids isolated from villin-ER/Cre+ mice of the indicated genotypes and treated with 4-OHT for 24 h followed by stimulation with 2.5 ng/ml TNF for the indicated time points. (B) Representative confocal microscopy images of PI-stained enteroids from indicated genotypes of mice treated with 4-OHT for 24 h followed by 24 h of 2.5 ng/ml TNF versus mock treatment as indicated. Bars, 75 or 100 µm, as indicated. (C) Quantitation of cell viability of enteroid cultures described in B (mean ± SD). (D) qPCR analysis of TNF mRNA from enteroid cultures with the indicated genotypes after 24 h of 4-OHT treatment (mean ± SD). (E) Dose–response curve of TNF-induced cytotoxicity (mean ± SD). Cell viability of enteroids with the indicated genotypes treated for 24 h with 4-OHT followed by 24 h of TNF at the indicated concentrations versus mock treatment. Statistical significance was assessed by two-way ANOVA with Dunnett’s multiple comparison test comparing the effect of each concentration to villin-ER/Cre or villin-ER/Cre+ enteroids as indicated. (F) Cell viability of organoids of the indicated genotypes treated with 4-OHT for 24 h followed by stimulation with TWEAK, FasL, or TRAIL for 24 h (mean ± SD). For C, E, and F, viability was measured by using the Cell-Titer Glo 3D assay, and data were normalized to mock-treated cells (%Mock). (C–E) Statistical significance was assessed by two-way ANOVA with Dunnett’s multiple comparison test comparing the effect to villin-ER/Cre or villin-ER/Cre+ enteroids as indicated. (F) Statistical significance was assessed by two-way ANOVA with Dunnett’s multiple comparison test comparing each stimulation to 4-OHT alone. *, P < 0.05; **, P < 0.01; ***, P < 0.001; ****, P < 0.0001. Data are representative of at least two independent experiments.
Figure 4.
Figure 4.
A20 and ABIN-1 double-deficient enteroids are sensitized to TNF-induced apoptosis. (A) Immunoblotting analyses of enteroid cultures treated with 4-OHT for 24 h followed by 2.5 ng/ml TNF for 0, 1.5, and 3 h. Cell lysates were immunoblotted with the antibodies indicated on the right. Solid arrow indicates full-length protein; open arrow indicates cleaved protein. (B) qPCR analyses of mRNA from enteroid cultures of the indicated genotypes after 24 h of 4-OHT treatment followed by stimulation for 0 or 90 min with 2.5 ng/ml TNF. Relative gene abundance was normalized to the mean expression of the housekeeping gene actb (mean ± SD). Statistical significance for individual transcripts was assessed by two-way ANOVA with Dunnett’s multiple comparison test comparing each genotype to villin-ER/Cre enteroids. *, P < 0.05; **, P < 0.01; ***, P < 0.001; ****, P < 0.0001. Data are representative of at least two independent experiments.
Figure 5.
Figure 5.
A20 and ABIN-1 double-deficient enteroids die primarily via caspase-dependent, RIPK1 kinase-dependent, RIPK3-independent apoptosis. (A) Kaplan-Meier survival curves of the indicated genotypes of mice treated with tamoxifen for 7 d. The number of mice is indicated in the graph legend. (B) Representative confocal microscopy images of PI-stained enteroids with the indicated genotypes treated for 48 h with 4-OHT with or without emricasan or Nec1s, versus mock, as indicated. Bars, 75 or 100 µm, as indicated. (C) Quantitation of cell viability of enteroid cultures treated as indicated (mean ± SD). Viability was measured by using the Cell-Titer Glo 3D assay, and data were normalized to unstimulated cells (%Mock). Statistical significance was assessed by two-way ANOVA with Dunnett’s multiple comparison test comparing each stimulation to 4-OHT alone. *, P < 0.05; **, P < 0.01; ***, P < 0.001; ****, P < 0.0001. (D) Immunoblotting analyses of enteroid cultures treated with 4-OHT for 24 h in the presence of Nec1s or emricasan or Mock, followed by 0.25 ng/ml TNF for 3 h. Cell lysates were immunoblotted with the antibodies indicated on the right. Solid arrow indicates full-length protein; the open arrow indicates cleaved protein. Data are representative of at least two independent experiments.

Comment in

References

    1. Arsenescu R., Bruno M.E.C., Rogier E.W., Stefka A.T., McMahan A.E., Wright T.B., Nasser M.S., de Villiers W.J.S., and Kaetzel C.S.. 2008. Signature biomarkers in Crohn’s disease: Toward a molecular classification. Mucosal Immunol. 1:399–411. 10.1038/mi.2008.32 - DOI - PubMed
    1. Berger S.B., Harris P., Nagilla R., Kasparcova V., Hoffman S., Swift B., Dare L., Schaeffer M., Capriotti C., Ouellette M., et al. . 2015. Characterization of GSK’963: A structurally distinct, potent and selective inhibitor of RIP1 kinase. Cell Death Discov. 1:15009 10.1038/cddiscovery.2015.9 - DOI - PMC - PubMed
    1. Boone D.L., Turer E.E., Lee E.G., Ahmad R.-C., Wheeler M.T., Tsui C., Hurley P., Chien M., Chai S., Hitotsumatsu O., et al. . 2004. The ubiquitin-modifying enzyme A20 is required for termination of Toll-like receptor responses. Nat. Immunol. 5:1052–1060. 10.1038/ni1110 - DOI - PubMed
    1. Bosanac I., Wertz I.E., Pan B., Yu C., Kusam S., Lam C., Phu L., Phung Q., Maurer B., Arnott D., et al. . 2010. Ubiquitin binding to A20 ZnF4 is required for modulation of NF-κB signaling. Mol. Cell. 40:548–557. 10.1016/j.molcel.2010.10.009 - DOI - PubMed
    1. Bruno M.E.C., Rogier E.W., Arsenescu R.I., Flomenhoft D.R., Kurkjian C.J., Ellis G.I., and Kaetzel C.S.. 2015. Correlation of biomarker expression in colonic mucosa with disease phenotype in Crohn’s disease and ulcerative colitis. Dig. Dis. Sci. 60:2976–2984. 10.1007/s10620-015-3700-2 - DOI - PMC - PubMed

Publication types

MeSH terms

Substances