

doi: 10.3324/haematol.2017.175414.
Epub 2018 Jun 21.
A reversible carnitine palmitoyltransferase (CPT1) inhibitor offsets the proliferation of chronic lymphocytic leukemia cells
Affiliations
- PMID: 29930162
- PMCID: PMC6278982
- DOI: 10.3324/haematol.2017.175414
Item in Clipboard
A reversible carnitine palmitoyltransferase (CPT1) inhibitor offsets the proliferation of chronic lymphocytic leukemia cells
Haematologica.
2018 Nov.
No abstract available
Figures
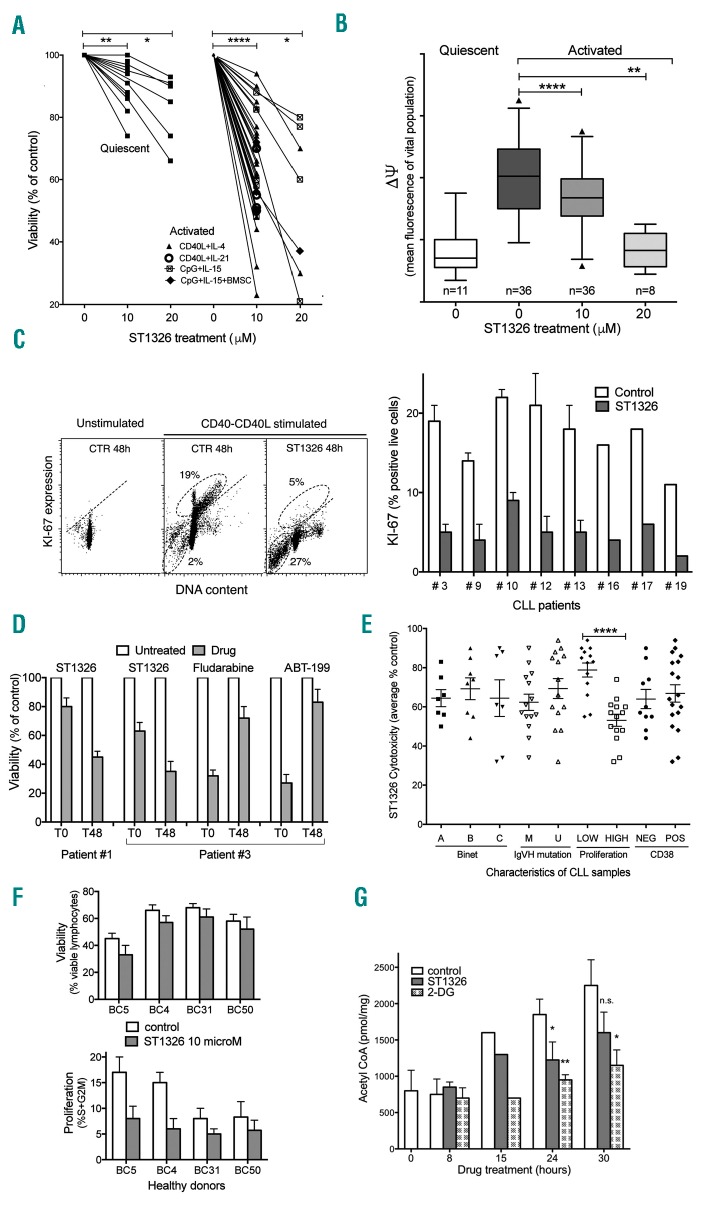
ST1326 kills proliferating chronic lymphocytic leukemia cells. (A) Cell viability assessed by flow cytometric propidium iodide exclusion tests on quiescent or CD40L-stimulated cultures of leukemic cells from 26 CLL patients untreated or treated with ST1326 (48 h). CLL cells were obtained from peripheral blood of CLL patients, after informed consent according to the Declaration of Helsinki. Cell activation was achieved either through CD40L-NIH-3T3 murine fibroblasts + IL-4 (number of independent experiments, n=22) or IL-21 (n=4), or by CpG/ODN2006 (hTLR9 ligand) +IL-15, in the absence (n=7) or presence (n=3) of bone marrow stromal cells (BMSC). Mean (range) values of the reduction of viability (% control) induced by 10 μM ST1326 were: 64.8 (23–94), 56.5 (50–70), 68 (48–88) and 61 (55–72) for the four different activation systems, respectively. The statistical significance of differences was evaluated by a two-sided Wilcoxon signed rank test. *P≤0.05; **P≤0.01; ***P≤0.001; ****P≤0.0001. (B) Mitochondrial transmembrane potential (ΔΨ) gated on the vital cell population, as measured by DiOC6 uptake and expressed as flow cytometric fluorescence intensity of the propidium iodide-excluding cell population (with intact plasma membrane), on quiescent or CD40L-stimulated cultures of leukemic cells from 26 CLL patients untreated or treated with ST1326 from the beginning of stimulation (48 h). The number of samples for each condition is indicated. The statistical significance of differences was analyzed by a t-test two-sided Wilcoxon signed rank test. *P≤0.05; **P≤0.01; ***P≤0.001; ****P≤0.0001. (C) Left: flow cytometric distributions of DNA content/KI67 expression for one representative CLL sample. The CD40L-stimulated cells were tested in the absence or presence of ST1326. Gates identify KI67+ cells (above the negative-threshold dotted line) and sub-G1 events (apoptotic cells and bodies, below). Right: %KI-67+ cells from CLL samples of eight CLL patients, tested with or without addition of ST1326. (D) Cell viability in cells from two CLL patients exposed to a 40 h drug ‘pulse’, either concomitantly with CD40L-stimulation (T0) or after 48 h (T48). The different ST1326 sensitivities of CLL cells at T0 and T48 is evident. In contrast, the effect of fludarabine (10 μM) and ABT-199 (5 nM) was remarkably impaired if the cells were exposed to the drugs at T48. (E) Effect of ST1326 on average cell viability of CD40L-stimulated CLL cells. The patients were grouped according to disease stage (Binet A, B or C), immunoglobulin gene mutational status [unmutated (U-CLL), <2% mutations in IGVH genes); mutated (M-CLL), ≥2% mutations in IGVH genes], proliferative response to CD40L-stimulation (‘low’ or ‘high’ if % cells in the S+G2M cell cycle phase after 72 h stimulation was ≤ or > 8%, respectively), and CD38 expression (cut-off: 30%). The statistical significance of differences was assessed by a two-sided Mann-Whitney test. Where no indication is reported, the difference was not statistically significant. *P≤0.05; **P≤0.01; ***P≤0.001; ****P≤0.0001. (F) Normal B cells from healthy volunteers were purified by magnetic beads (negative-selection) and activated by co-culturing with CD40L+IL-4 and treated for 48 h with 10 μM ST1326. Cell death and proliferation were measured by flow cytometry. Viability was unaffected, while cell proliferation (% cells in S+G2M phase) was reduced in two samples. (G) Acetyl CoA levels in leukemic cells from one CLL patient stimulated for 24 h and then exposed to ST1326 (10 μM) or 2-DG (5 mM). Data obtained by colorimetric tests using the PicoProbe Acetyl CoA Assay Kit from AbCam (http://www.abcam.com/ ), are reported as mean ± SD of three experiments (two settings with CpG-and one with CD40L-stimulus). The levels of intracellular acetyl CoA increase during CLL cell activation, and ST1326 affects the increase rate. 2-DG was used as a control. *P≤0.05; **P≤0.01; ***P≤0.001; ****P≤0.0001.
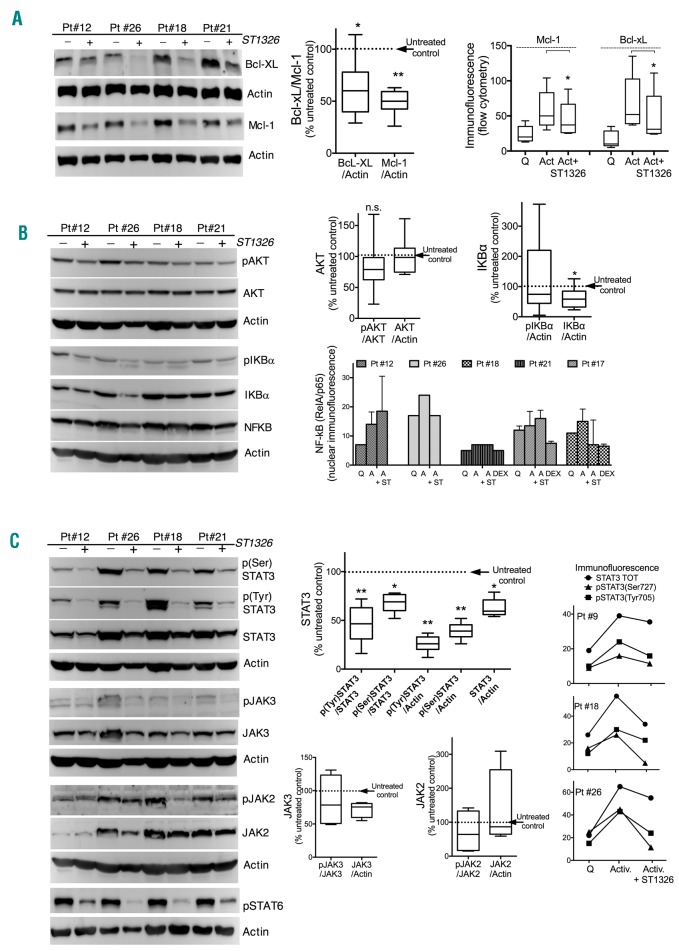
ST1326 impairs stimulus-induced Mcl-1 and Bcl-XL upregulation and induces remarkable STAT3 downregulation. (A) Left: expression of the Bcl-2-family anti-apoptotic members, Mcl-1 and Bcl-xL, in leukemic cells from four CLL patients, stimulated with CD40L+IL-4, and treated with or without ST1326 24 h after stimulation. Middle: cumulative data for 24 and 42 h of treatment are represented in the box/whiskers graph (5th –95th percentiles): the protein level in ST1326-treated samples (divided by the level of the housekeeper protein) was calculated as the % of values in untreated controls. Right: protein expression evaluated by intracellular immunofluorescence and flow cytometry (background-subtracted fluorescence) on samples from five CLL patients is illustrated as a cumulative graph. Cells were quiescent (Q=non-stimulated) or stimulated (Act) in the absence or presence (+) of ST1326. Cells were fixed with 3% paraformaldehyde and permeabilized with 0.1% Triton X-100 before antibody reaction. Analyses are restricted to viable cells. A non-parametric t-test was used to assess the statistical significance of differences. *P≤0.05; **P≤0.01; ***P≤0.001; ****P≤0.0001. (B) Left: western blots of total and phosphorylated (p) AKT (Ser473) and IKBα (Ser32/36) and NF-κB (RelA/p65) in four samples of CLL cells stimulated with CD40L+IL-4 for 1 day and treated with ST1326 for another 24 h. Different signaling pathways were examined in parallel gels and blots were stripped and re-probed with the indicated antibodies. Right upper panel: cumulative data calculated as in (A). The statistical significance of differences was analyzed by a non-parametric t-test. *P≤0.05; **P≤0.01; ***P≤0.001; ****P≤0.0001. Right lower panel: NF-κB (RelA/p65) expression in isolated nuclei from CLL cells treated in culture as above, stained with anti-NF-κB (RelA/p65) antibody and measured by flow cytometry. Cells were not stimulated (Q) or stimulated by CD40L+IL-4 without ST1326 (A) or with ST1326 (A+ST). Dexamethasone (DEX) treatment for 24 h (100 nM) was used as a positive control for NF-κB downregulation. (C) Left: western blots of STAT3(pan) and its phosphorylated forms pSTAT3(Tyr705) and pSTAT3(Ser727), of total and phosphorylated JAK2 (Tyr1008) and JAK3 (Tyr980/981), and pSTAT6, in leukemic cells from four CLL patients stimulated with CD40L+IL-4 for 1 day and treated with ST1326 for another 24 h. Different signaling pathways were examined in parallel gels and blots were stripped and re-probed with the indicated antibodies. Middle: cumulative data for STAT3 are calculated from western blots of eight samples from six CLL patients: the average ratio of STAT3 (unphosphorylated, phospho-Tyr705 and phospho-Ser727 STAT3) to either unphosphorylated protein level or the housekeeper are displayed as a relative decrease of protein levels in ST1326-treated samples compared to untreated ones (set at 100). Cumulative data for JAK2 and JAK3 are calculated from four CLL patients. A non-parametric t-test was used to assess the statistical significance of differences. *P≤0.05; **P≤0.01; ***P≤0.001; ****P≤0.0001. Right: expression of STAT3 and its phosphorylated forms as evaluated by intracellular immunofluorescence and flow cytometry on leukemic cells from five CLL patients, which were either not stimulated (Q) or stimulated (Activ.) in the absence or presence of ST1326 (24–30 h). Importantly, background-subtracted data are restricted to viable cells.
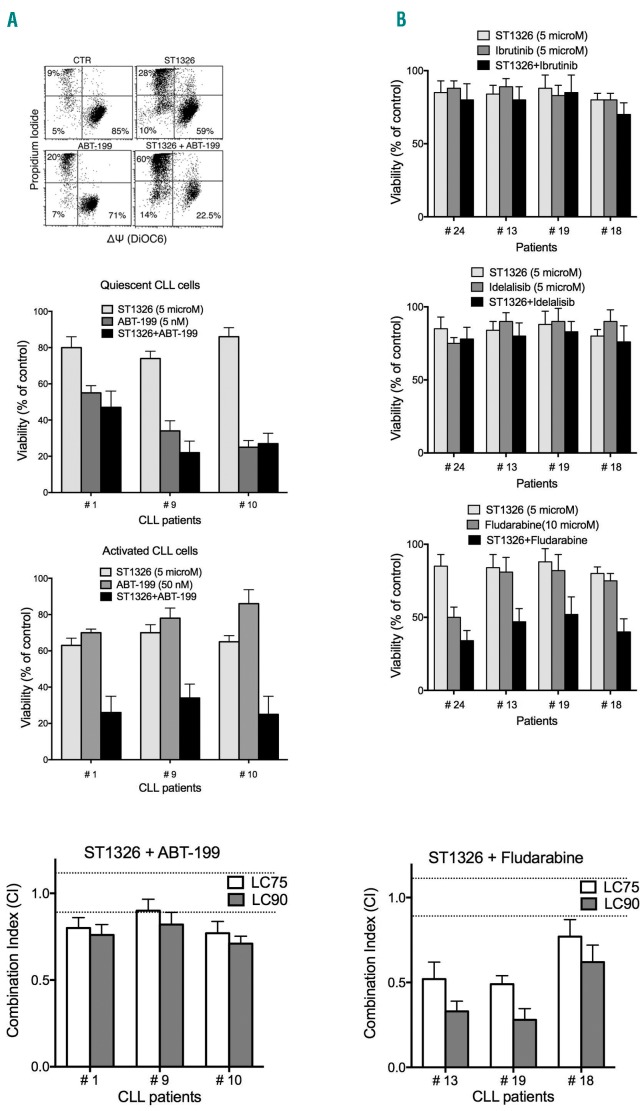
ST1326 potentiates cytotoxicity of drugs that lose effectiveness when chronic lymphocytic leukemia cells proliferate. (A) Upper: flow cytometric bivariate plots of mitochondrial transmembrane potential (ΔΨ) (DiOC6 fluorescence) and cell viability (propidium iodide exclusion) of leukemic cells from one representative CLL patient stimulated with CD40L+IL-4 and cultured with ST1326 (10 μM), ABT-199 (10 μM), or both drugs for 42 h. Middle: ST1326 and/or ABT-199 cytotoxicity (42 h) on unstimulated (Quiescent) and CD40L-stimulated (Activated) CLL cultures. Given that ABT-199 loses efficacy on activated/proliferating leukemic cells, the drug concentration was 10 times higher in stimulated cultures. Only stimulated CLL cells displayed increased sensitivity to drug combinations, if compared to either drug alone. Lower: combination index (CI) values (at LC75 and LC90) calculated using the Chou–Talalay model (CalcuSyn software, Biosoft, Cambridge, UK) on dose-effect profiles of activated CLL cells treated for 24 h with increasing concentrations of ST1326 (1–10 μM), ABT-199 (10–100 nM) or ST1326/ABT-199 at constant ratios. Since the CI depends on the ‘fractional effect level’, we report two levels of cytotoxicity, LC75 and LC90 (concentration lethal to 75% and 90% of CLL cells, respectively). Dotted lines indicate CI=0.9 and CI=1.1; Synergism = CI<0.9, additive effect = 0.9≤CI≤1.1 and antagonism = CI>1.1. The original CI curve and isobolograms are reported in Online Supplementary Figure S5. (B) Upper three insets: cytotoxicity of the combination of ST1326 (5 μM) and ibrutinib (5 μM), idelalisib (5 μM) or fludarabine (10 μM), administered for 24 h to activated CLL samples. Lower: CI values (at LC75 and LC90) calculated using the Chou–Talalay model on dose-effect profiles of activated CLL cells treated for 24 h with increasing concentrations of ST1326 (1–20 μM), fludarabine (1–30 μM) or ST1326/fludarabine at constant ratios.
References
-
- Heintel D, Kienle D, Shehata M, et al. High expression of lipoprotein lipase in poor risk B-cell chronic lymphocytic leukemia. Leukemia. 2005; 19(7):1216–1223. - PubMed
-
- Tung S, Shi Y, Wong K, et al. PPARalpha and fatty acid oxidation mediate glucocorticoid resistance in chronic lymphocytic leukemia. Blood. 2013; 122(6):969–980. - PubMed
Publication types
MeSH terms
Substances
LinkOut - more resources
Full Text Sources
Other Literature Sources
