. 2018 Jun 21;9(1):2427.
doi: 10.1038/s41467-018-04365-8.

IBD risk loci are enriched in multigenic regulatory modules encompassing putative causative genes

Collaborators, Affiliations

IBD risk loci are enriched in multigenic regulatory modules encompassing putative causative genes

Yukihide Momozawa et al. Nat Commun. .

Abstract

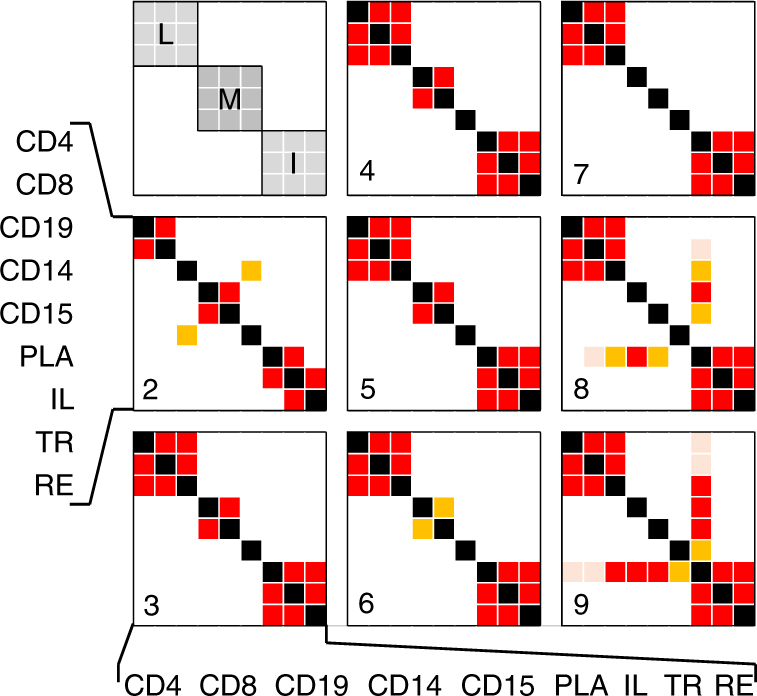
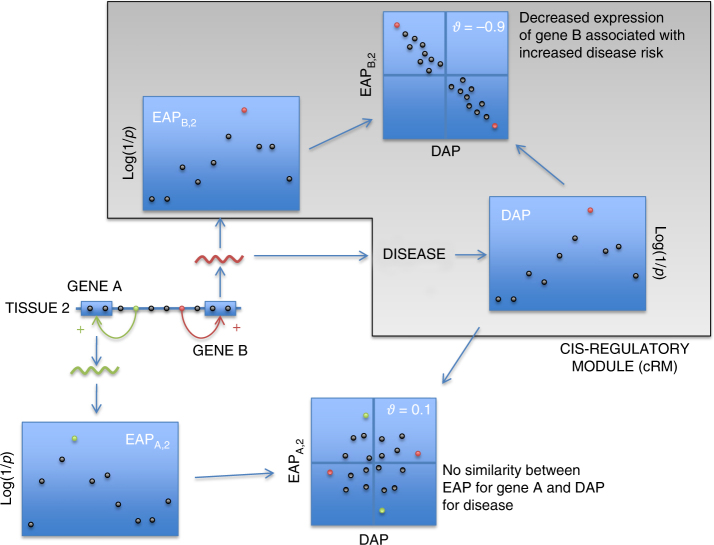
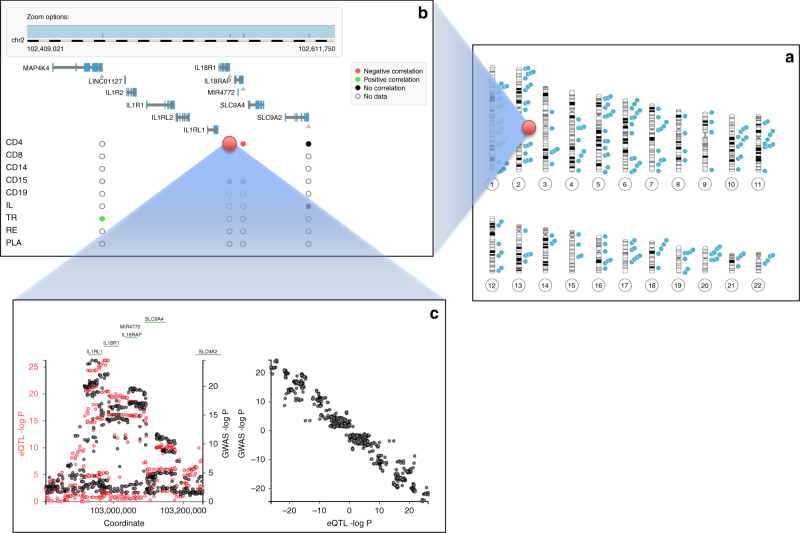
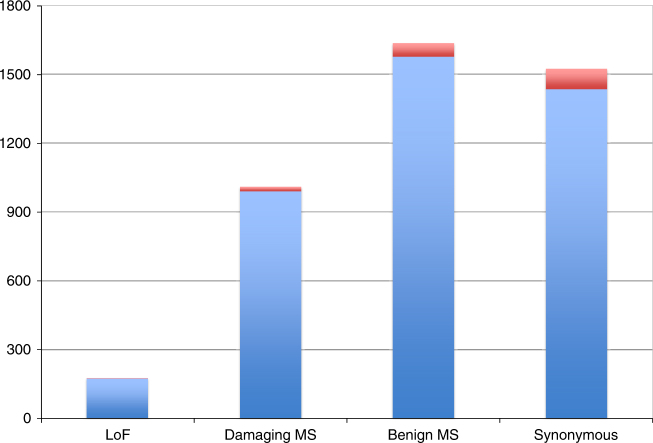
GWAS have identified >200 risk loci for Inflammatory Bowel Disease (IBD). The majority of disease associations are known to be driven by regulatory variants. To identify the putative causative genes that are perturbed by these variants, we generate a large transcriptome data set (nine disease-relevant cell types) and identify 23,650 cis-eQTL. We show that these are determined by ∼9720 regulatory modules, of which ∼3000 operate in multiple tissues and ∼970 on multiple genes. We identify regulatory modules that drive the disease association for 63 of the 200 risk loci, and show that these are enriched in multigenic modules. Based on these analyses, we resequence 45 of the corresponding 100 candidate genes in 6600 Crohn disease (CD) cases and 5500 controls, and show with burden tests that they include likely causative genes. Our analyses indicate that ≥10-fold larger sample sizes will be required to demonstrate the causality of individual genes using this approach.


Conflict of interest statement

The authors declare no competing interests.

Figures

Fig. 1
Fig. 1
cis-Regulatory Module (cRM). A cis-eQTL affecting gene A in tissue 1 reveals itself by an “eQTL Association Pattern” (EAPA,1), i.e., the pattern of log(p) values for variants in the region. Multiple EAP can be observed in a given chromosome region, affecting one or more genes in one or more cell types. EAP that are driven by the same underlying variants are expected to be similar, while EAP driven by distinct variants (for instance, the green and red regulatory variants in the figure) are not. Based on the measure of similarity introduced in this work, ϑ, we cluster the EAP in cRM. For EAP in the same module, ϑ can be positive or negative, indicating that the variants have the same sign of effect (increasing or decreasing expression) for the corresponding EAP pair
Fig. 2
Fig. 2
Single-gene/tissue versus multi-gene/tissue cRM. Using |ϑ| > 0.6, the 23,950 cis-eQTL (FDR ≤ 0.05) detected in the nine analyzed cell types were clustered in 9720 cis-Regulatory Modules (cRM). 68% of these were single-gene, single-tissue cRM (green), 22% were single-gene, multi-tissue cRM (blue), and 10% were multi-gene, mostly multi-tissue cRM (red). The number of observations for single-gene cRM were divided by 10 in the graph for clarity. Thus, there are more cases of single-gene, multi-tissue cRM (blue; 2155) than multi-gene cRM (red; 967)
Fig. 3
Fig. 3
Example of a multi-gene, multi-tissue cRM. Gene-tissue combinations for which no expression could be detected are marked by “-”, with detectable expression but without evidence for cis-eQTL as “ → ”, with detectable expression and evidence for a cis-eQTL as “↑” or “↓” (large arrows: FDR < 0.05; small arrows: FDR ≥ 0.05 but high |ϑ| values). eQTL labeled by the yellow arrows constitute the multi-genic and multi-tissular cRM no. 57. The corresponding regulatory variant(s) increase expression of the GINM1, NUP43 and probably KATNA1 genes (left side of the cRM), while decreasing expression of the PCMT1 and LRP11 genes (right side of the cRM). The expression of GINM1 in CD15 and LRP11 in CD4 appears to be regulated in opposite directions by a distinct cRM (no. 3694, green). The LATS1 gene, in the same region, is not affected by the same regulatory variants in the studied tissues. Inset 1: ϑ values for all EAP pairs. EAP pairs with |ϑ| > 0.6 are bordered in yellow when corresponding to cRM no. 57, in green when corresponding to cRM no. 3694 (+green arrow)
Fig. 4
Fig. 4
Variant(s) with opposite effects on expression in two cell types. Example of a gene (PNKD) affected by a cis-eQTL in at least two cell types (CD14 and platelets) that are characterized by EAP with ϑ = −0.97, indicating that the gene’s expression level is affected by the same regulatory variant in these two cell types, yet with opposite effects, i.e., the variant that is increasing expression in platelets is decreasing expression in CD14
Fig. 5
Fig. 5
Significance of the excess sharing of cRM between cell types. (red: p < 0.0002 (Bonferroni corrected 0.0144), orange: p < 0.001 (0.072), rose: p < 0.01 (0.51)). The numbers in the lower-left corner of the squares indicate which cRM were used for the analysis: (2) cRM affecting no more than two cell types, (3) cRM affecting no more than three cell types, etc. The upper-left square indicates the position of the lymphoid cell types (L)(CD4, CD8, CD19), the myeloid cell types (M)(CD14, CD15, PLA), and the intestinal cell types (I)(IL, TR, RE). For each pair of cell types i and j, we computed two p values, one using i as reference, the other using j as reference (Methods). Pairs of p values were always consistent
Fig. 6
Fig. 6
DAP-matching cRM. If a regulatory variant (red) affects disease risk by altering the expression levels of gene B in tissue 2, the EAPB,2 is expected to be similar (high |ϑ|) to the “disease association pattern” (DAP), both assigned therefore to the same cRM. ϑ is positive if increased gene expression is associated with increased disease risk, negative otherwise. A cis-eQTL that is driven by a regulatory variant (green) that does not directly affect disease risk, will be characterized by an EAP (say gene A, tissue 2, EAPA,2) that is not similar to the DAP (low |ϑ|)
Fig. 7
Fig. 7
Screen shots of the CEDAR website, showing a known CD risk loci on the human karyotype, b a zoom in the HD35 risk locus showing the Refseq gene content and summarizing local CEDAR cis-eQTL data (white: no expression data, gray: expression data but no evidence for cis-eQTL, black: significant cis-eQTL but no correlation with DAP, red: significant cis-eQTL similar to DAP (ϑ < −0.60), green: significant cis-eQTL similar to DAP (ϑ > 0.60)), and c a zoom in the DAP for Crohn’s disease (black) and EAP for IL18R1 (red), as well as the signed correlation between DAP and EAP
Fig. 8
Fig. 8
Variants detected by sequencing the coding exons of 45 candidate genes. Variants are sorted in LoF (loss-of-function, i.e., stop gain, frame-shift, splice site), Damaging MS (missense variants considered as damaging by SIFT and damaging or possibly damaging by Polyphen-2), Benign MS (other missense variants), and Synonymous. Blue: variants with MAF < 0.005, Red: variants with MAF ≥ 0.005
Fig. 9
Fig. 9
QQ-plot for the gene-based burden test. Ranked log(1/p) values obtained when considering LoF and damaging variants (full circles), or synonymous variants (empty circles). The circles are labeled in blue when the best p value for that gene is obtained with CAST, in red when the best p value is obtained with SKAT. The black line corresponds to the median log(1/p) value obtained (for the corresponding rank) using the same approach on permuted data (LoF and damaging variants). The gray line marks the upper limit of the 95% confidence band. The name of the genes with nominal p value ≤0.05 are given. Known causative genes are italicized. The inset p value corresponds to the significance of the upwards shift in log(1/p) values estimated by permutation

References

    1. MacArthur J, et al. The new NHGRI-EBI catalog of published genome-wide association studies (GWAS Catalog) Nucleic Acids Res. 2017;45:D896–D901. doi: 10.1093/nar/gkw1133. - DOI - PMC - PubMed
    1. Jostins L, et al. Host-microbe interactions have shaped the genetic architecture of inflammatory bowel disease. Nature. 2012;491:119–124. doi: 10.1038/nature11582. - DOI - PMC - PubMed
    1. Liu JZ, et al. Association analyses identify 38 susceptibility loci for IBD and highlight shared genetic risk across populations. Nat. Genet. 2015;47:979–986. doi: 10.1038/ng.3359. - DOI - PMC - PubMed
    1. Huang H, et al. Association mapping of IBD loci to single variant resolution. Nature. 2017;547:173–178. doi: 10.1038/nature22969. - DOI - PMC - PubMed
    1. Claussnitzer M, et al. FTO obesity variant circuitry and adipocyte browning in humans. N. Engl. J. Med. 2015;373:895–907. doi: 10.1056/NEJMoa1502214. - DOI - PMC - PubMed

Publication types