. 2018 Jun 21;8(1):9472.
doi: 10.1038/s41598-018-27834-y.

A widely-applicable high-throughput cellular thermal shift assay (CETSA) using split Nano Luciferase

Affiliations

A widely-applicable high-throughput cellular thermal shift assay (CETSA) using split Nano Luciferase

Natalia J Martinez et al. Sci Rep. .

Abstract

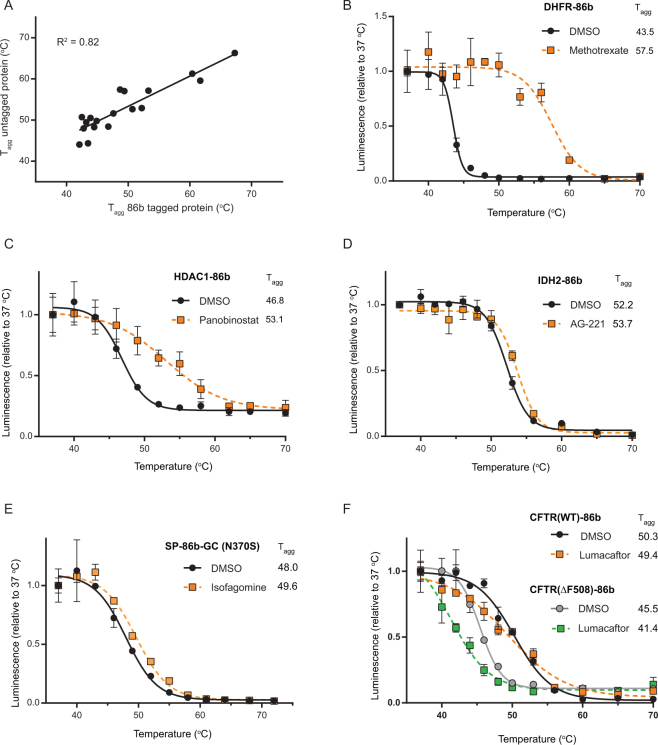
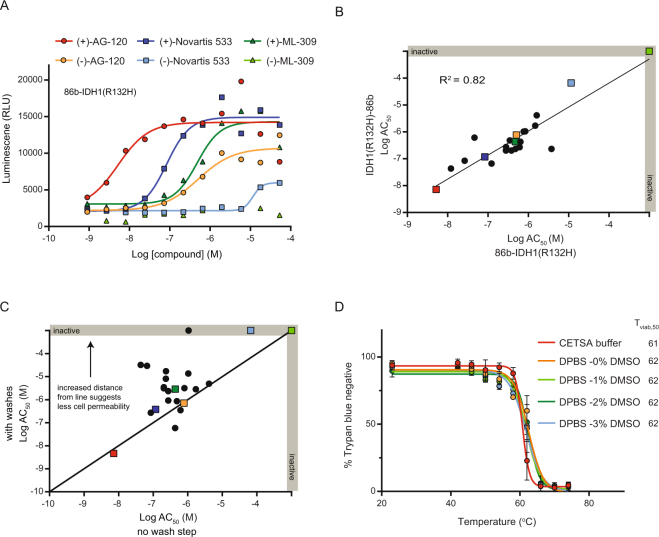
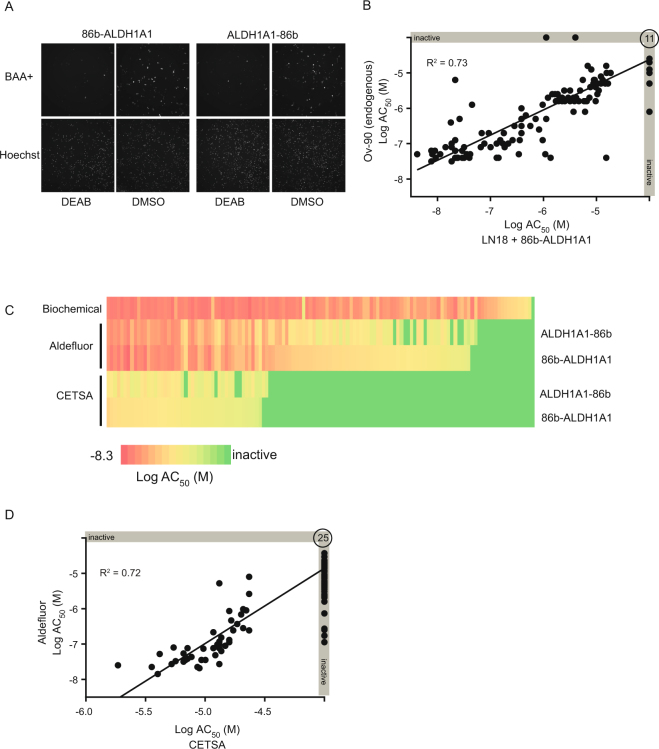
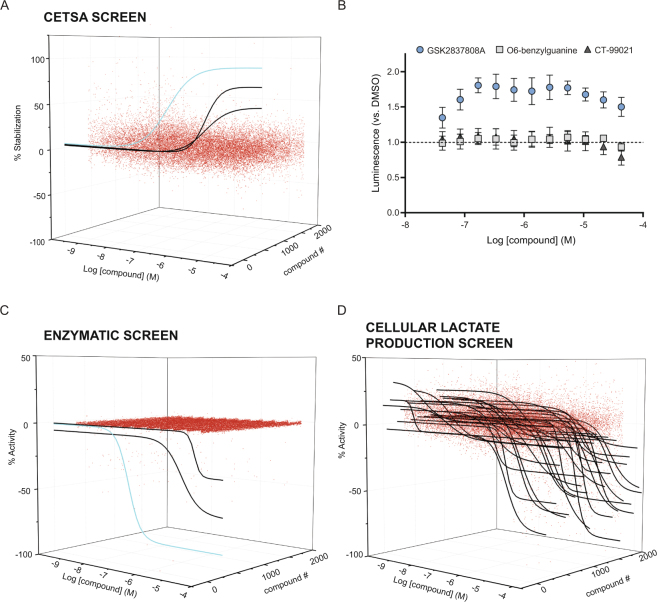
Assessment of the interactions between a drug and its protein target in a physiologically relevant cellular environment constitutes a major challenge in the pre-clinical drug discovery space. The Cellular Thermal Shift Assay (CETSA) enables such an assessment by quantifying the changes in the thermal stability of proteins upon ligand binding in intact cells. Here, we present the development and validation of a homogeneous, standardized, target-independent, and high-throughput (384- and 1536-well formats) CETSA platform that uses a split Nano Luciferase approach (SplitLuc CETSA). The broad applicability of the assay was demonstrated for diverse targets, and its performance was compared with independent biochemical and cell-based readouts using a set of well-characterized inhibitors. Moreover, we investigated the utility of the platform as a primary assay for high-throughput screening. The SplitLuc CETSA presented here enables target engagement studies for medium and high-throughput applications. Additionally, it provides a rapid assay development and screening platform for targets where phenotypic or other cell-based assays are not readily available.


Conflict of interest statement

The authors declare no competing interests.

Figures

Figure 1
Figure 1
SplitLuc CETSA assay development. (A) Schematic overview of the ultra-high-throughput cellular thermal shift assay using split NanoLuc. A peptide (86, red text) previously reported as having strong affinity for a large fragment of NanoLuc (11S) was modified to have Gly-Ser linkers on each side (86b-tag). (B) 2-HG production in cells expressing tagged IDH1(R132H) or controls (EGFP or no DNA). 86b was fused to either the N- or C-terminus of IDH1(R132H). As a control for the 86b tag a FLAG tag was fused to the C-terminus of IDH1(R132H). Enzymatic activity of the tagged transgene was assessed by measuring 2-HG in the medium 72 h post-transfection (n = 3 per variant, x-axis). Transgene expression levels were measured by luminescence resulting from NanoLuc complementation (y-axis). (C) Thermal stability of endogenous (wild-type) and transfected (R132H mutant) IDH1 by immunoblot using pan (top) or R132H specific (middle, N-tag; lower, C-tag) antibodies. Untransfected/unheated HEK293T cells (endogenous WT IDH1) serve as the control (CTRL) sample. (D) Densitometric analysis of immunoblot in (C) enables quantification of Tagg for endogenous and 86b-tagged IDH1(R132H). (E) Thermal profiles of 86b-IDH1(R132H) and IDH1(R132H)-86b extracted via freeze-thaw or NP40-mediated lysis. (F) Aggregated IDH1(R132H) is complementation incompetent and does not require removal by centrifugation. After heating to 65 °C for 3.5 min, samples were centrifuged at various speeds for 20 min and complementation was assessed. (G) Treatment with 1 µM AG-120, an inhibitor of mutant IDH1, stabilizes N- and C-tagged IDH1(R132H). Cells were treated for 1 h and heated for 3.5 min (mean ± SD, n = 3).
Figure 2
Figure 2
CETSA approach for targets of diverse function and subcellular localizations. (A) Tagg for a set of eighteen 86b-tagged constructs (all C-terminal placement) was compared to endogenous protein Tagg, as reported in a thermal proteome profiling dataset. (BF) Thermal melt profiles for (B) DHFR, (C) HDAC1, (D) IDH2 [95% CI Tagg: Veh (51.9, 52.4); AG-221 (53.3, 54.1)], (E) glucocerebrosidase [95% CI Tagg: Veh (46.9, 49); isofagomine (49, 50.4)], and (F) cystic fibrosis transmembrane conductance regulator. For each transgene, thermal stabilization was tested after 1 h treatment with 20 µM indicated compound (mean+/−SD, n = 3).
Figure 3
Figure 3
Assay miniaturization to a 384-well format. (A) Cells expressing N-tagged IDH1(R132H) were treated with three pairs of IDH1 inhibitors, previously characterized as the more active eutomer (+) or less active distomer (−), and heated at 56  °C for 3.5 min. (B) Correlation plot for the N- and C-tagged variants comparing AC50 for thermal stabilization. Compounds presented in panel A are indicated by colored squares. (C) The potencies of many compounds were reduced with a wash step introduced before heating, as indicated by upward shift from black line (x = y). Some compounds, e.g. AG-120 (red square), did not show a shift in AC50. (D) HEK293T cell permeability during the heating step was examined using a Trypan Blue exclusion assay in CETSA buffer containing 0 to 3% DMSO (mean+/−SD, n = 2 counts per group; avg. 183 cells per count).
Figure 4
Figure 4
Optimization of a 1,536-well SplitLuc CETSA assay for qHTS. (A) Melt profiles of 86b-tagged and endogenous LDHA in HEK293T cells. Western blot for endogenous LDHA is shown in the inset. (B) LDHA-86b expressing cells were heated to 63.5 °C using convective (oven) or conductive (plate block) heat transfer (mean ± SD, n = 384). (C) LDHA-86b thermal stabilization was assessed by adding an LDHA inhibitor (Compound 63; 2 µM final concentration) to every other column of a 1,536-well plate. Samples were heated to 61 °C for 12 min and luminescence was measured by a ViewLux reader. (D) Assay statistics with LDHA-86b heated to 61 °C as a function of heat duration (mean ± SD, n = 768). Signal-to-background (S:B) indicates the fold change between groups treated with DMSO and compound. (E) Dose-dependent stabilization of LDHA-86b was assessed after heating samples to 63.5 °C for 5–50 min (mean ± SD, n = 2). AC50 values are right-shifted with increasing heat times. (F) Rank order of 15 LDHA inhibitors is maintained after heating 10, 20, or 30 min.
Figure 5
Figure 5
A comparison of LDHA inhibition among SplitLuc CETSA (63.5 °C for 7.5 min), biochemical, and cell-based assays. (A) Correlation plot of potencies for 15 LDHA inhibitors tested in a biochemical assay (x-axis) vs. a HEK293T cellular lactate production assay (y-axis). (B) Correlation plot of potencies for LDHA inhibitors in a biochemical assay (x-axis) vs. SplitLuc CETSA assay (y-axis). (C) Correlation plot of potencies for LDHA inhibitors in lactate production assay (x-axis) vs. SplitLuc CETSA complementation assay (y-axis). Greater agreement between AC50 values was observed for the two cell-based assays. Dotted line indicates equivalent potency in the two assays.
Figure 6
Figure 6
ALDH1A1 inhibitors (127 analogs) examined via the SplitLuc CETSA approach. (A) 86b-tagged ALDH1A1 retains cellular activity. LN18 cells were transfected with N- or C-tagged constructs and activities were examined using an Aldefluor high-content imaging assay that measures the conversion of BAAA (BODIPY-aminoacetaldehyde) to BAA (BODIPY-aminoacetate). Top images show BAA-retaining cells and bottom images show total cell number by nuclear staining with Hoechst. 4-N,N-diethylaminobenzaldehyde (DEAB) was used as a control inhibitor of ALDH1A1. (B) Inhibition of endogenous ALDH1A1 activity (OV-90 cells) is correlated with inhibition of 86b-ALDH1A1 as measured by Aldefluor assay. The correlation plot indicates compound’s LogAC50 in the Aldefluor assay in Ov-90 (y-axis) and 86b-ALDH1A1 transfected LN18 cells (x-axis). (C) Comparison of compound activities (LogAC50) measured with biochemical, Aldefluor (LN18), and SplitLuc CETSA (65  °C for 9 min) assay. The two cell-based assays were performed with 86b-tagged ALDH1A1 (N- and C-variants), while the biochemical assay utilized untagged protein. (D) The compound potencies from SplitLuc CETSA (65 °C for 9 min) and Aldefluor assays correlate, although potencies from the CETSA assay are right-shifted. Twenty-five compounds were inactive in both assays.
Figure 7
Figure 7
A primary screen of LDHA using the SplitLuc CETSA assay (63.5 °C for 9 min). (A) 1,850 samples from the mechanism interrogation plate (MIPE) library were screened in qHTS format as an 11-point concentration series for thermal stabilization of LDHA. The waterfall plot shows dose-response curves for three compounds classified as active in the screen. The response curve for GSK2837808A, a known LDHA inhibitor, is colored light blue. (B) Only the activity of GSK2837808A was confirmed when the three hits from the primary screen were re-tested (mean ± SD, n = 9). CETSA was performed at 63 °C for 3.5 min in 384-well PCR plates (thermal cycler). (C) MIPE compounds were screened for activity using an LDHA enzymatic assay. Three actives, including GSK2837808A (light blue curve), were identified. The remaining two actives did not overlap with the compounds identified in the CETSA assay. (D) MIPE compounds were screened for activity with the lactate production assay. Three-hundred and seventy-six compounds (20.3% hit rate) were identified as active (black curves).
Figure 8
Figure 8
A primary screen of CDK9 using the SplitLuc CETSA assay. (A) A collection of 977 kinase inhibitors were screened in qHTS format as a 7-point concentration series for thermal stabilization of CDK9 (45 °C for 9 min, 1536-well plates). The waterfall plot shows dose-response curves for three compounds (red) classified as active in the screen. Dose-response curves of “destabilizers” are shown in black. (B) The stabilizing activities of all 3 CDK9 inhibitors found in the primary screen were confirmed in follow-up experiments (45 °C for 3.5 min, 96-well PCR plate, thermal cycler). (C) The kinase inhibitor collection was screened for activity using a Lanthascreen binding assay with purified CDK9/cyclin K. Eighty-nine hits (red curves) with submicromolar activity were identified.

References

    1. Lipinski CA, Lombardo F, Dominy BW, Feeney PJ. Experimental and computational approaches to estimate solubility and permeability in drug discovery and development settings. Adv Drug Deliv Rev. 2001;46:3–26. doi: 10.1016/S0169-409X(00)00129-0. - DOI - PubMed
    1. International Transporter C, et al. Membrane transporters in drug development. Nat Rev Drug Discov. 2010;9:215–236. doi: 10.1038/nrd3028. - DOI - PMC - PubMed
    1. Lounkine E, et al. Large-scale prediction and testing of drug activity on side-effect targets. Nature. 2012;486:361–367. doi: 10.1038/nature11159. - DOI - PMC - PubMed
    1. Michelini E, Cevenini L, Mezzanotte L, Coppa A, Roda A. Cell-based assays: fuelling drug discovery. Anal Bioanal Chem. 2010;398:227–238. doi: 10.1007/s00216-010-3933-z. - DOI - PubMed
    1. Auld, D. S. et al. Receptor Binding Assays for HTS and Drug Discovery, in Assay Guidance Manual. (eds G. S. Sittampalam et al.) (Bethesda (MD); 2004). - PubMed

Publication types

MeSH terms