

Assessing agreement among alternative climate change projections to inform conservation recommendations in the contiguous United States
- PMID: 29930266
- PMCID: PMC6013454
- DOI: 10.1038/s41598-018-27721-6
Assessing agreement among alternative climate change projections to inform conservation recommendations in the contiguous United States
Abstract
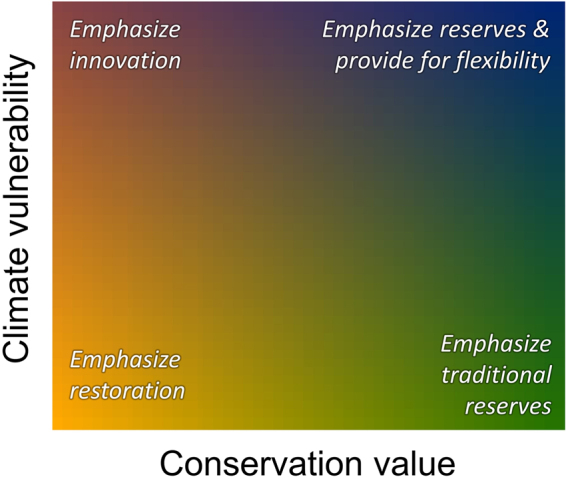
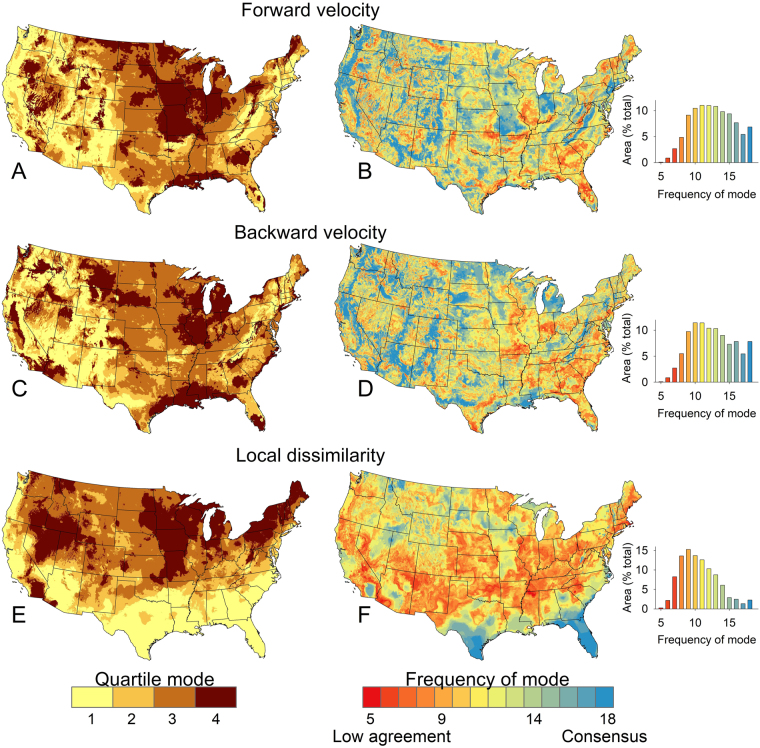
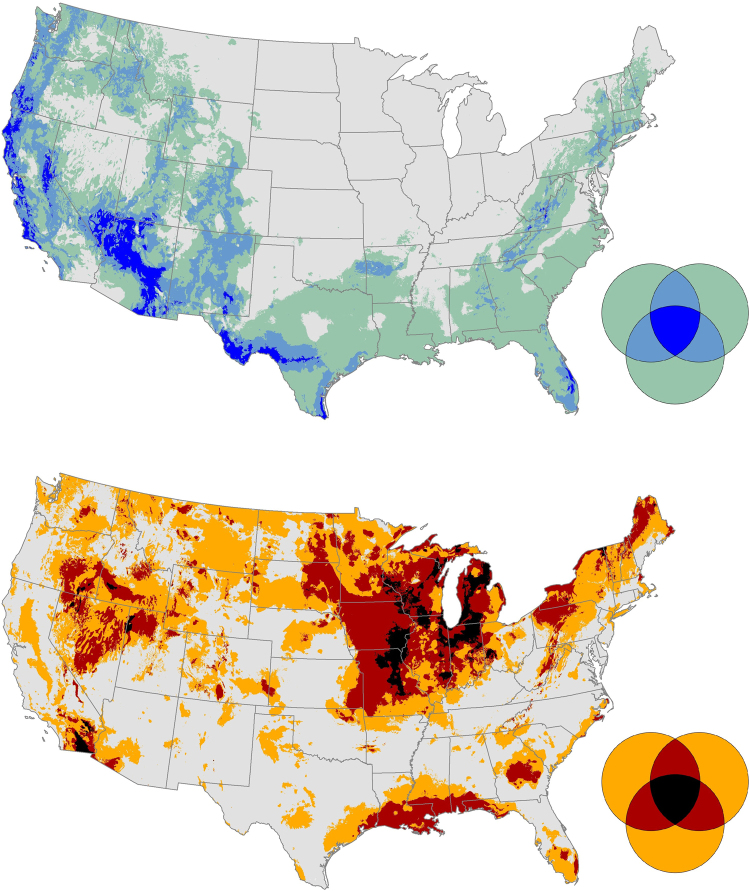
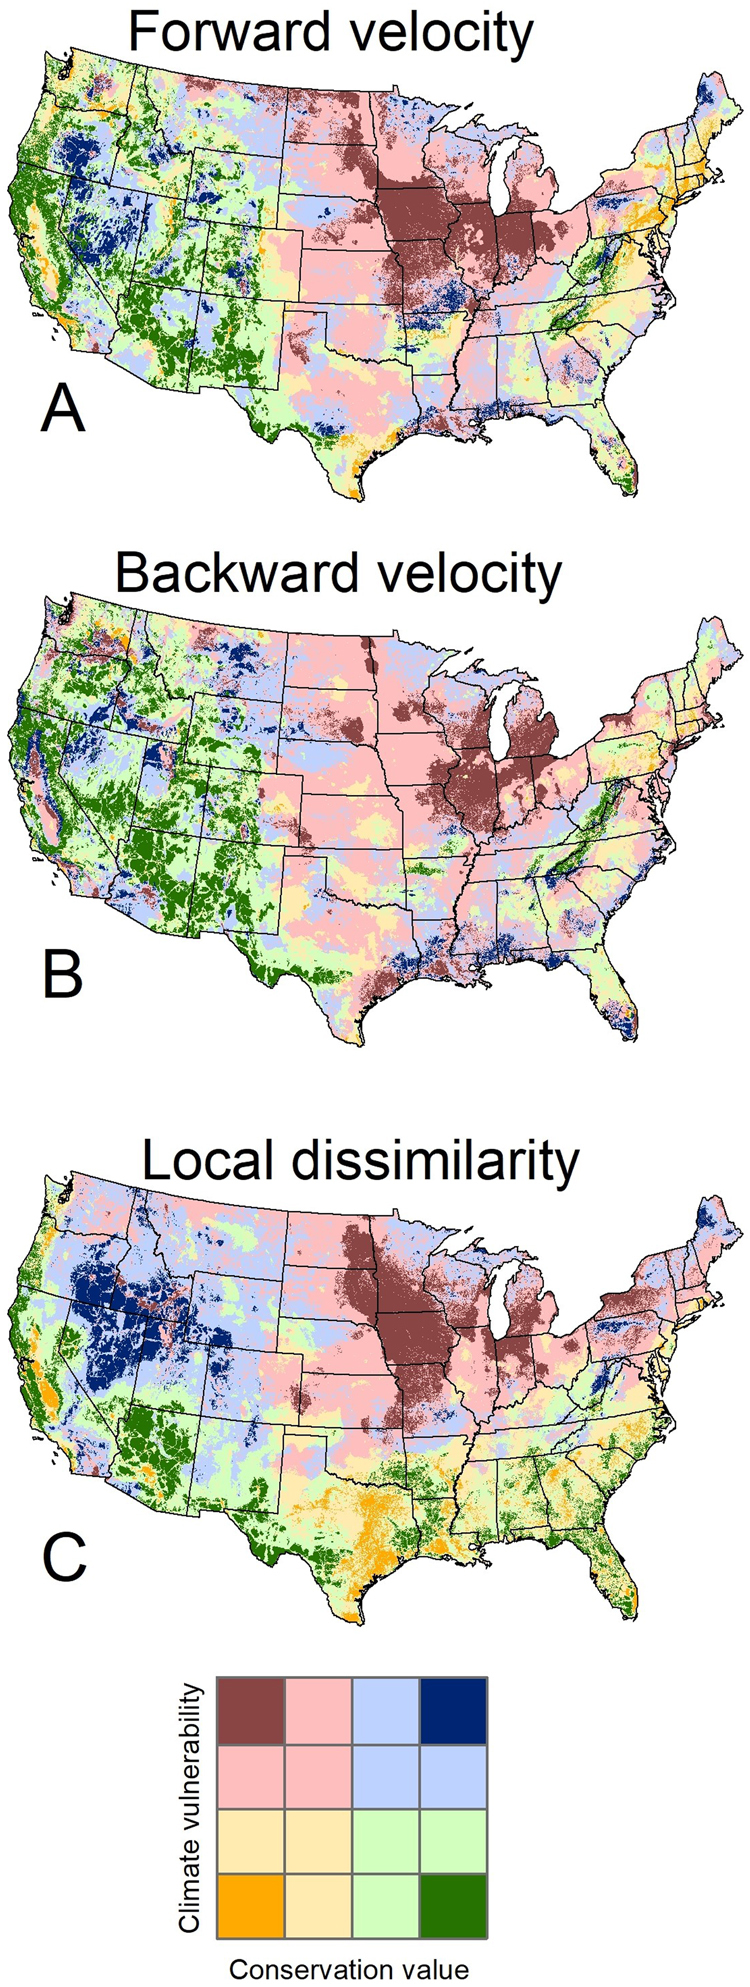
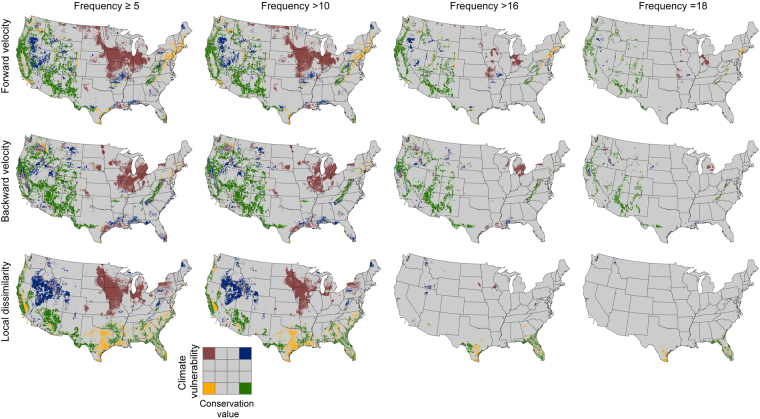
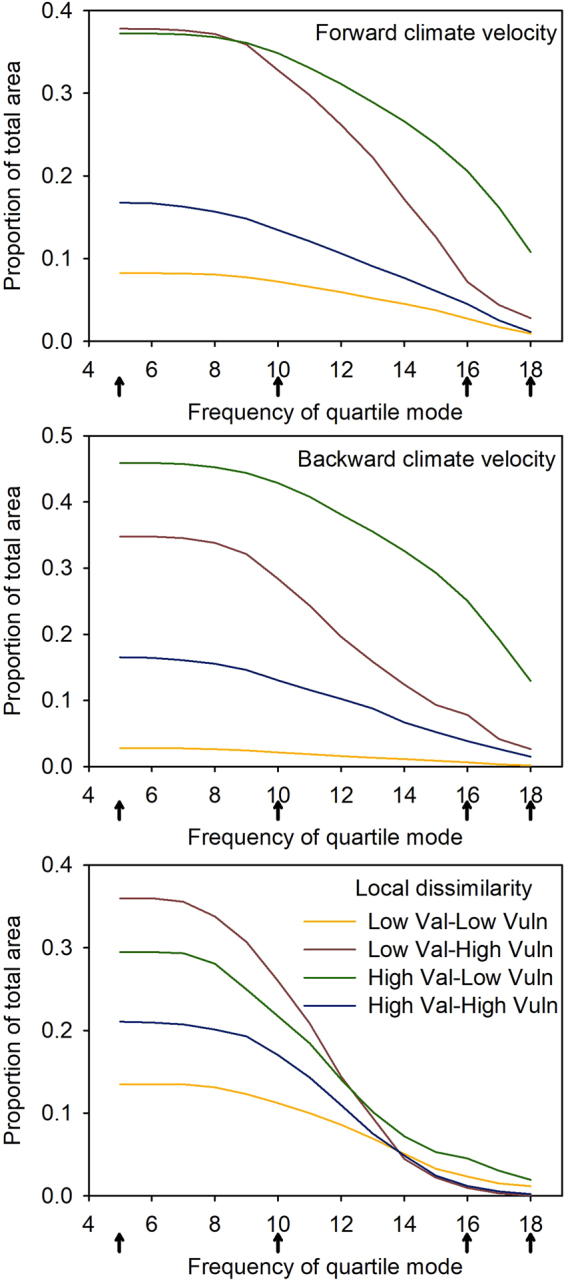
Addressing uncertainties in climate vulnerability remains a challenge for conservation planning. We evaluate how confidence in conservation recommendations may change with agreement among alternative climate projections and metrics of climate exposure. We assessed agreement among three multivariate estimates of climate exposure (forward velocity, backward velocity, and climate dissimilarity) using 18 alternative climate projections for the contiguous United States. For each metric, we classified maps into quartiles for each alternative climate projections, and calculated the frequency of quartiles assigned for each gridded location (high quartile frequency = more agreement among climate projections). We evaluated recommendations using a recent climate adaptation heuristic framework that recommends emphasizing various conservation strategies to land based on current conservation value and expected climate exposure. We found that areas where conservation strategies would be confidently assigned based on high agreement among climate projections varied substantially across regions. In general, there was more agreement in forward and backward velocity estimates among alternative projections than agreement in estimates of local dissimilarity. Consensus of climate predictions resulted in the same conservation recommendation assignments in a few areas, but patterns varied by climate exposure metric. This work demonstrates an approach for explicitly evaluating alternative predictions in geographic patterns of climate change.
Conflict of interest statement
The authors declare no competing interests.
Figures
Similar articles
-
Probabilistic measures of climate change vulnerability, adaptation action benefits, and related uncertainty from maximum temperature metric selection.Glob Chang Biol. 2018 Jun;24(6):2735-2748. doi: 10.1111/gcb.14101. Epub 2018 Mar 27. Glob Chang Biol. 2018. PMID: 29468779
-
Scale-dependent complementarity of climatic velocity and environmental diversity for identifying priority areas for conservation under climate change.Glob Chang Biol. 2017 Nov;23(11):4508-4520. doi: 10.1111/gcb.13679. Epub 2017 Mar 31. Glob Chang Biol. 2017. PMID: 28267245
-
Matching the multiple scales of conservation with the multiple scales of climate change.Conserv Biol. 2010 Feb;24(1):51-62. doi: 10.1111/j.1523-1739.2009.01409.x. Conserv Biol. 2010. PMID: 20121841
-
Climate Velocity Can Inform Conservation in a Warming World.Trends Ecol Evol. 2018 Jun;33(6):441-457. doi: 10.1016/j.tree.2018.03.009. Epub 2018 Apr 30. Trends Ecol Evol. 2018. PMID: 29716742 Review.
-
Integrating human responses to climate change into conservation vulnerability assessments and adaptation planning.Ann N Y Acad Sci. 2015 Oct;1355:98-116. doi: 10.1111/nyas.12952. Ann N Y Acad Sci. 2015. PMID: 26555860 Review.
Cited by
-
The Accelerating Exposure of European Protected Areas to Climate Change.Glob Chang Biol. 2025 Jun;31(6):e70261. doi: 10.1111/gcb.70261. Glob Chang Biol. 2025. PMID: 40474859 Free PMC article.
-
Wilderness areas in a changing landscape: changes in land use, land cover, and climate.Ecol Appl. 2022 Jan;32(1):e02471. doi: 10.1002/eap.2471. Epub 2021 Nov 8. Ecol Appl. 2022. PMID: 34626517 Free PMC article.
-
Planning for climate change through additions to a national protected area network: implications for cost and configuration.Philos Trans R Soc Lond B Biol Sci. 2020 Mar 16;375(1794):20190117. doi: 10.1098/rstb.2019.0117. Epub 2020 Jan 27. Philos Trans R Soc Lond B Biol Sci. 2020. PMID: 31983335 Free PMC article.
-
Differing climatic mechanisms control transient and accumulated vegetation novelty in Europe and eastern North America.Philos Trans R Soc Lond B Biol Sci. 2019 Dec 23;374(1788):20190218. doi: 10.1098/rstb.2019.0218. Epub 2019 Nov 4. Philos Trans R Soc Lond B Biol Sci. 2019. PMID: 31679485 Free PMC article.
-
Climate-change refugia: biodiversity in the slow lane.Front Ecol Environ. 2020 Jun 1;18(5):228-234. doi: 10.1002/fee.2189. Front Ecol Environ. 2020. PMID: 33424494 Free PMC article.
References
-
- Williams JW, Shuman BN, Webb T, Bartlein PJ, Leduc PL. Late-Quaternay vegetation dynamics in North America: Scaling from taxa to biomes. Ecological Monographs. 2004;74:309–334. doi: 10.1890/02-4045. - DOI
Publication types
LinkOut - more resources
Full Text Sources
Other Literature Sources
