Dynamic alterations in the gut microbiota and metabolome during the development of methionine-choline-deficient diet-induced nonalcoholic steatohepatitis
- PMID: 29930468
- PMCID: PMC6010937
- DOI: 10.3748/wjg.v24.i23.2468
Dynamic alterations in the gut microbiota and metabolome during the development of methionine-choline-deficient diet-induced nonalcoholic steatohepatitis
Abstract
Aim: To investigate changes in gut microbiota and metabolism during nonalcoholic steatohepatitis (NASH) development in mice fed a methionine-choline-deficient (MCD) diet.
Methods: Twenty-four male C57BL/6J mice were equally divided into four groups and fed a methionine-choline-sufficient diet for 2 wk (Control 2w group, n = 6) or 4 wk (Control 4w group, n = 6) or the MCD diet for 2 wk (MCD 2w group, n = 6) or 4 wk (MCD 4w group, n = 6). Liver injury, fibrosis, and intestinal barrier function were evaluated after 2 and 4 wk of feeding. The fecal microbiome and metabolome were studied using 16s rRNA deep sequencing and gas chromatography-mass spectrometry.
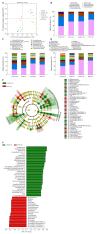
Results: The mice fed the MCD diet presented with simple hepatic steatosis and slight intestinal barrier deterioration after 2 wk. After 4 wk of feeding with the MCD diet, however, the mice developed prominent NASH with liver fibrosis, and the intestinal barrier was more impaired. Compared with the control diet, the MCD diet induced gradual gut microbiota dysbiosis, as evidenced by a marked decrease in the abundance of Alistipes and the (Eubacterium) coprostanoligenes group (P < 0.001 and P < 0.05, respectively) and a significant increase in Ruminococcaceae UCG 014 abundance (P < 0.05) after 2 wk. At 4 wk, the MCD diet significantly reduced the promising probiotic Bifidobacterium levels and markedly promoted Bacteroides abundance (P < 0.05, and P < 0.01, respectively). The fecal metabolomic profile was also substantially altered by the MCD diet: At 2 wk, arachidic acid, hexadecane, palmitic acid, and tetracosane were selected as potential biomarkers that were significantly different in the corresponding control group, and at 4 wk, cholic acid, cholesterol, arachidic acid, tetracosane, and stearic acid were selected.
Conclusion: The MCD diet induced persistent alterations in the gut microbiota and metabolome.
Keywords: Gut microbiota; Metabolome; Methionine-choline deficient diet; Nonalcoholic fatty liver disease; Nonalcoholic steatohepatitis.
Conflict of interest statement
Conflict-of-interest statement: There is no conflict of interest in this study.
Figures


References
-
- Musso G, Cassader M, Gambino R. Non-alcoholic steatohepatitis: emerging molecular targets and therapeutic strategies. Nat Rev Drug Discov. 2016;15:249–274. - PubMed
-
- Ishioka M, Miura K, Minami S, Shimura Y, Ohnishi H. Altered Gut Microbiota Composition and Immune Response in Experimental Steatohepatitis Mouse Models. Dig Dis Sci. 2017;62:396–406. - PubMed
-
- Wong RJ, Aguilar M, Cheung R, Perumpail RB, Harrison SA, Younossi ZM, Ahmed A. Nonalcoholic steatohepatitis is the second leading etiology of liver disease among adults awaiting liver transplantation in the United States. Gastroenterology. 2015;148:547–555. - PubMed
-
- Chalasani N, Younossi Z, Lavine JE, Diehl AM, Brunt EM, Cusi K, Charlton M, Sanyal AJ. The diagnosis and management of non-alcoholic fatty liver disease: practice Guideline by the American Association for the Study of Liver Diseases, American College of Gastroenterology, and the American Gastroenterological Association. Hepatology. 2012;55:2005–2023. - PubMed
MeSH terms
Substances
LinkOut - more resources
Full Text Sources
Other Literature Sources
Medical

