. 2018 Jun 7:9:1252.
doi: 10.3389/fimmu.2018.01252. eCollection 2018.

The Notch Signaling Pathway Is Balancing Type 1 Innate Lymphoid Cell Immune Functions

Affiliations

The Notch Signaling Pathway Is Balancing Type 1 Innate Lymphoid Cell Immune Functions

Thibaut Perchet et al. Front Immunol. .

Abstract

The Notch pathway is one of the canonical signaling pathways implicated in the development of various solid tumors. During carcinogenesis, the Notch pathway dysregulation induces tumor expression of Notch receptor ligands participating to escape the immune surveillance. The Notch pathway conditions both the development and the functional regulation of lymphoid subsets. Its importance on T cell subset polarization has been documented contrary to its action on innate lymphoid cells (ILC). We aim to analyze the effect of the Notch pathway on type 1 ILC polarization and functions after disruption of the RBPJk-dependent Notch signaling cascade. Indeed, type 1 ILC comprises conventional NK (cNK) cells and type 1 helper innate lymphoid cells (ILC1) that share Notch-related functional characteristics such as the IFNg secretion downstream of T-bet expression. cNK cells have strong antitumor properties. However, data are controversial concerning ILC1 functions during carcinogenesis with models showing antitumoral capacities and others reporting ILC1 inability to control tumor growth. Using various mouse models of Notch signaling pathway depletion, we analyze the effects of its absence on type 1 ILC differentiation and cytotoxic functions. We also provide clues into its role in the maintenance of immune homeostasis in tissues. We show that modulating the Notch pathway is not only acting on tumor-specific T cell activity but also on ILC immune subset functions. Hence, our study uncovers the intrinsic Notch signaling pathway in ILC1/cNK populations and their response in case of abnormal Notch ligand expression. This study help evaluating the possible side effects mediated by immune cells different from T cells, in case of multivalent forms of the Notch receptor ligand delta 1 treatments. In definitive, it should help determining the best novel combination of therapeutic strategies in case of solid tumors.

Keywords: Notch; cancer; cytotoxicity; inflammation; innate lymphoid cells; liver; molecular biology techniques; transcription factors.


Figures

Figure 1
Figure 1
Group 1 innate lymphoid cell is composed of four distinct populations in the liver at homeostasis. (A) Single cells were sorted for transcriptomic analyses using the Biomark technology. Hepatic lineage negative CD45-positive cells (lin CD45+) were separated into type 1 helper innate lymphoid cells (ILC1) (CD4 NKp46+ NK1.1+ CD49a+ CD49b) and conventional NK (cNK) cells (CD4 NKp46+ NK1.1+ CD49a CD49b+). (B) Application of t-SNE to single cells using 48 genes expression separates 48 ILC1 and 48 cNK into two distinct subsets. (C) Phenograph algorithm clustering performed and plotted on t-SNE graph, showing four different clusters among hepatic ILC1 and cNK. (D) Density plot of Eomes gene expression show four distinct types of expression among phenograph clusters of hepatic ILC1 and cNK. (E) The variance mean of delta Ct across expressed genes allows the selection of genes that are differentially expressed (variance > 60) with a significant expression (dCt from −20.5 to 0). (F) Frequency of hepatic ILC1 and cNK expressing Notch1 and/or Notch2. (G) Heatmap with unsupervised hierarchical clusters of gene selected in panel (D).
Figure 1
Figure 1
Group 1 innate lymphoid cell is composed of four distinct populations in the liver at homeostasis. (A) Single cells were sorted for transcriptomic analyses using the Biomark technology. Hepatic lineage negative CD45-positive cells (lin CD45+) were separated into type 1 helper innate lymphoid cells (ILC1) (CD4 NKp46+ NK1.1+ CD49a+ CD49b) and conventional NK (cNK) cells (CD4 NKp46+ NK1.1+ CD49a CD49b+). (B) Application of t-SNE to single cells using 48 genes expression separates 48 ILC1 and 48 cNK into two distinct subsets. (C) Phenograph algorithm clustering performed and plotted on t-SNE graph, showing four different clusters among hepatic ILC1 and cNK. (D) Density plot of Eomes gene expression show four distinct types of expression among phenograph clusters of hepatic ILC1 and cNK. (E) The variance mean of delta Ct across expressed genes allows the selection of genes that are differentially expressed (variance > 60) with a significant expression (dCt from −20.5 to 0). (F) Frequency of hepatic ILC1 and cNK expressing Notch1 and/or Notch2. (G) Heatmap with unsupervised hierarchical clusters of gene selected in panel (D).
Figure 2
Figure 2
Altered phenotype of NKp46+ NK1.1+ cells in IL7rCre RbpjF/F mice. (A) Expression of CD49a (purple) and CD49b (green) in lin CD45+ NKp46+ NK1.1+ cells from the liver, blood, portal vein blood, spleen, bone marrow, and thymus of control IL7rCre RbpjF/+ mice (top panel) and IL7rCre RbpjF/F mice (bottom panel). (B) Surface expression of CD49b (top panel) and CD49a (bottom panel) on total liver lin CD45+ NKp46+ NK1.1+ cells, hepatic conventional NK (cNK) and type 1 helper innate lymphoid cells (ILC1) in control IL7rCre RbpjF/+ mice (gray) and IL7rCre RbpjF/F (red). (C) Frequency and absolute numbers of hepatic cNK and ILC1 in IL7r+/+ (white), IL7rCre RbpjF/+ (blue), and IL7rCre RbpjF/F (red) mice. (D) Surface expression of Thy1 and Mac1 on hepatic cNK (top panel) and ILC1 (bottom panel) in IL7r+/+ (gray), IL7rCre RbpjF/+ (blue), and IL7rCre RbpjF/F (red) mice. Lineage-negative cells were used as control for histograms (dashed gray). (E) Frequency of hepatic cNK and ILC1 expression of Thy1 (top panel) and Mac1 (bottom panel) in control IL7rCre RbpjF/+ mice (white) and IL7rCre RbpjF/F (red).
Figure 2
Figure 2
Altered phenotype of NKp46+ NK1.1+ cells in IL7rCre RbpjF/F mice. (A) Expression of CD49a (purple) and CD49b (green) in lin CD45+ NKp46+ NK1.1+ cells from the liver, blood, portal vein blood, spleen, bone marrow, and thymus of control IL7rCre RbpjF/+ mice (top panel) and IL7rCre RbpjF/F mice (bottom panel). (B) Surface expression of CD49b (top panel) and CD49a (bottom panel) on total liver lin CD45+ NKp46+ NK1.1+ cells, hepatic conventional NK (cNK) and type 1 helper innate lymphoid cells (ILC1) in control IL7rCre RbpjF/+ mice (gray) and IL7rCre RbpjF/F (red). (C) Frequency and absolute numbers of hepatic cNK and ILC1 in IL7r+/+ (white), IL7rCre RbpjF/+ (blue), and IL7rCre RbpjF/F (red) mice. (D) Surface expression of Thy1 and Mac1 on hepatic cNK (top panel) and ILC1 (bottom panel) in IL7r+/+ (gray), IL7rCre RbpjF/+ (blue), and IL7rCre RbpjF/F (red) mice. Lineage-negative cells were used as control for histograms (dashed gray). (E) Frequency of hepatic cNK and ILC1 expression of Thy1 (top panel) and Mac1 (bottom panel) in control IL7rCre RbpjF/+ mice (white) and IL7rCre RbpjF/F (red).
Figure 3
Figure 3
Conventional NK (cNK) cells are increased in the lamina propria lymphocytes (LPL) of IL7rCre RbpjF/F mice. (A) Flow cytometry of control IL7rCre RbpjF/+ mice (top panel) and IL7rCre RbpjF/F LPL (bottom panel). Repartition of type 1 helper innate lymphoid cells (ILC1) (lin CD45+ CD4 NKp46+ NK1.1+ CD226+ CD49b CD49a+ Mac1, in purple) and NK (lin CD45+ CD4 NKp46+ NK1.1+ CD49b+ CD226 CD49a−/+ Mac1+, in green) in lamina propria (LP). (B) Eomesodermin (Eomes) and Thy1 expression in LP ILC1 and cNK in control IL7rCre RbpjF/+ mice (gray) and IL7rCre RbpjF/F (red). Lineage-negative cells were used as control for expression (dashed gray). (C) Frequency and absolute numbers of LP ILC1 and cNK in control IL7rCre RbpjF/+ mice (white) and IL7rCre RbpjF/F (red).
Figure 3
Figure 3
Conventional NK (cNK) cells are increased in the lamina propria lymphocytes (LPL) of IL7rCre RbpjF/F mice. (A) Flow cytometry of control IL7rCre RbpjF/+ mice (top panel) and IL7rCre RbpjF/F LPL (bottom panel). Repartition of type 1 helper innate lymphoid cells (ILC1) (lin CD45+ CD4 NKp46+ NK1.1+ CD226+ CD49b CD49a+ Mac1, in purple) and NK (lin CD45+ CD4 NKp46+ NK1.1+ CD49b+ CD226 CD49a−/+ Mac1+, in green) in lamina propria (LP). (B) Eomesodermin (Eomes) and Thy1 expression in LP ILC1 and cNK in control IL7rCre RbpjF/+ mice (gray) and IL7rCre RbpjF/F (red). Lineage-negative cells were used as control for expression (dashed gray). (C) Frequency and absolute numbers of LP ILC1 and cNK in control IL7rCre RbpjF/+ mice (white) and IL7rCre RbpjF/F (red).
Figure 4
Figure 4
Altered cytokine profile of NKp46+ NK1.1+ cells in IL7rCre RbpjF/F mice. (A) Expression of TNFa, IFNg, granzyme B, and eomesodermin (Eomes) in hepatic type 1 helper innate lymphoid cells (ILC1) (left panel) and conventional NK (cNK) (right panel) of control IL7rCre RbpjF/+ mice (top panel) and IL7rCre RbpjF/F mice (middle panel). Levels of expression were compared (bottom panel) between control IL7rCre RbpjF/+ mice (blue) and IL7rCre RbpjF/F mice (red). Lineage-negative cells were used as control for surface expression (dashed gray). (B) Expression of Eomes, Tnfa, Ifng, and Gzmb mRNA in control IL7rCre RbpjF/+ mice (gray) and IL7rCre RbpjF/F mice (red). For Tnfa, Ifng, and Gzmb, mRNA expression was also tested on activated cells (dashed histograms). (C) Splenic cNK cells killing capacity in control C57BL/6J (gray), IL7rCre RbpjF/+ (blue), and IL7rCre RbpjF/F (red) mice. (D) Frequency of cNK expressing TNFa and IFNg during cytotoxicity assay. (E) Cytokine profile of hepatic ILC1 and NK cells in control IL7rCre RbpjF/+ (top panel) and IL7rCre RbpjF/F mice (bottom panel) after methionine-choline deficient (MCD) diet. (F) Relative weight and liver/body weight ratio in control IL7rCre RbpjF/+, IL7r+/+ RbpjF/+, and IL7r+/+ RbpjF/+ mice (square) after chow (white) and MCD diet (gray) and in IL7rCre RbpjF/F mice (triangles) after chow (white) and MCD diet (red). Aspartate aminotransferase (ASAT) levels of control IL7rCre RbpjF/+, IL7r+/+ RbpjF/+, and IL7r+/+ RbpjF/+ (white) and IL7rCre RbpjF/F mice (red) after MCD diet.
Figure 4
Figure 4
Altered cytokine profile of NKp46+ NK1.1+ cells in IL7rCre RbpjF/F mice. (A) Expression of TNFa, IFNg, granzyme B, and eomesodermin (Eomes) in hepatic type 1 helper innate lymphoid cells (ILC1) (left panel) and conventional NK (cNK) (right panel) of control IL7rCre RbpjF/+ mice (top panel) and IL7rCre RbpjF/F mice (middle panel). Levels of expression were compared (bottom panel) between control IL7rCre RbpjF/+ mice (blue) and IL7rCre RbpjF/F mice (red). Lineage-negative cells were used as control for surface expression (dashed gray). (B) Expression of Eomes, Tnfa, Ifng, and Gzmb mRNA in control IL7rCre RbpjF/+ mice (gray) and IL7rCre RbpjF/F mice (red). For Tnfa, Ifng, and Gzmb, mRNA expression was also tested on activated cells (dashed histograms). (C) Splenic cNK cells killing capacity in control C57BL/6J (gray), IL7rCre RbpjF/+ (blue), and IL7rCre RbpjF/F (red) mice. (D) Frequency of cNK expressing TNFa and IFNg during cytotoxicity assay. (E) Cytokine profile of hepatic ILC1 and NK cells in control IL7rCre RbpjF/+ (top panel) and IL7rCre RbpjF/F mice (bottom panel) after methionine-choline deficient (MCD) diet. (F) Relative weight and liver/body weight ratio in control IL7rCre RbpjF/+, IL7r+/+ RbpjF/+, and IL7r+/+ RbpjF/+ mice (square) after chow (white) and MCD diet (gray) and in IL7rCre RbpjF/F mice (triangles) after chow (white) and MCD diet (red). Aspartate aminotransferase (ASAT) levels of control IL7rCre RbpjF/+, IL7r+/+ RbpjF/+, and IL7r+/+ RbpjF/+ (white) and IL7rCre RbpjF/F mice (red) after MCD diet.
Figure 5
Figure 5
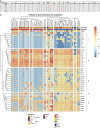
Molecular signature heterogeneity of group 1 innate lymphoid cell (ILC) in IL7rCre RbpjF/+ and IL7rCre RbpjF/F mice. (A) Sorting strategy of group 1 ILC cells in the different tissues (B) Heatmap of genes expression in group 1 ILC of IL7rCre RbpjF/+ and IL7rCre RbpjF/F mice in blood, bone marrow (BM), liver, lamina propria (LP), mesenteric lymph nodes (mLN), portal vein blood (PVB), and spleen. Cluster of cells and genes were obtained using hierarchical clustering.
Figure 6
Figure 6
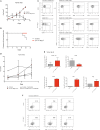
Notch signaling participates to early antitumoral activity. (A) Tumor area after subcutaneous injection of 3 × 106 Hepa1.6 cells in control IL7rCre RbpjF/+, IL7r+/+ RbpjF/+, and IL7r+/+ RbpjF/F (gray) and IL7rCre RbpjF/F mice (red). (B) Frequency of mice with a tumor after subcutaneous injection of 3 × 106 Hepa1.6 cells in control IL7rCre RbpjF/+, IL7r+/+ RbpjF/+, and IL7r+/+ RbpjF/F (gray) and IL7rCre RbpjF/F mice (red). 50% of control mice rejected the tumor after 21 days. (C) Group 1 innate lymphoid cell (ILC) tumor infiltrates in control IL7rCre RbpjF/+, IL7r+/+ RbpjF/+, and IL7r+/+ RbpjF/F mice (top panel) and IL7rCre RbpjF/F mice (bottom panel) 21 days after Hepa1.6 cells injection. (D) Tumor area after subcutaneous injection of 3 × 106 Hepa1.6 cells in control IL7rCre RbpjF/+, IL7r+/+ RbpjF/+, and IL7r+/+ RbpjF/F (gray dot), IL7rCre RbpjF/F mice (red dot), control IL7rCre RbpjF/+, IL7r+/+ RbpjF/+, and IL7r+/+ RbpjF/F mice with T cell transfer (gray triangle) and IL7rCre RbpjF/F mice with T cell transfer (red triangle). (E) Frequency of group 1 ILC and CD3-positive cells in tumor of control IL7rCre RbpjF/+, IL7r+/+ RbpjF/+, and IL7r+/+ RbpjF/F (gray), IL7rCre RbpjF/F mice (red) with T cell transfer 14 days after Hepa1.6 cells injection. Ratio of group 1 ILC on T cell expressing granzyme B (GzmB), TNFa, and IFNg. (F) Expression of GzmB, TNFa, and IFNg in group 1 ILC tumor infiltrates of IL7rCre RbpjF/+, IL7r+/+ RbpjF/+, and IL7r+/+ RbpjF/F control (top panel) and IL7rCre RbpjF/F mice (bottom panel) 5 days after Hepa1.6 cells injection.

Similar articles

Cited by

References

    1. Cortez VS, Colonna M. Diversity and function of group 1 innate lymphoid cells. Immunol Lett (2016) 179:19–24.10.1016/j.imlet.2016.07.005 - DOI - PMC - PubMed
    1. Daussy C, Faure F, Mayol K, Viel S, Gasteiger G, Charrier E, et al. T-bet and Eomes instruct the development of two distinct natural killer cell lineages in the liver and in the bone marrow. J Exp Med (2014) 211:563–77.10.1084/jem.20131560 - DOI - PMC - PubMed
    1. Constantinides MG, Gudjonson H, McDonald BD, Ishizuka IE, Verhoef PA, Dinner AR, et al. PLZF expression maps the early stages of ILC1 lineage development. Proc Natl Acad Sci U S A (2015) 112:5123–8.10.1073/pnas.1423244112 - DOI - PMC - PubMed
    1. Artavanis-Tsakonas S, Rand MD, Lake RJ. Notch signaling: cell fate control and signal integration in development. Science (1999) 284:770–6.10.1126/science.284.5415.770 - DOI - PubMed
    1. Sandy AR, Jones M, Maillard I. Notch signaling and development of the hematopoietic system. Adv Exp Med Biol (2012) 727:71–88.10.1007/978-1-4614-0899-4_6 - DOI - PubMed

Publication types

MeSH terms

Substances

LinkOut - more resources