

Rich club disturbances of the human connectome from subjective cognitive decline to Alzheimer's disease
- PMID: 29930726
- PMCID: PMC6010989
- DOI: 10.7150/thno.23772
Rich club disturbances of the human connectome from subjective cognitive decline to Alzheimer's disease
Abstract
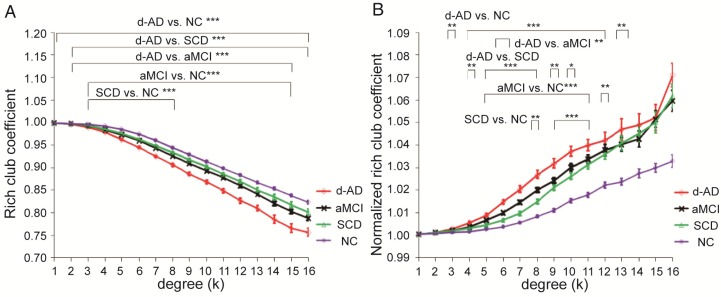
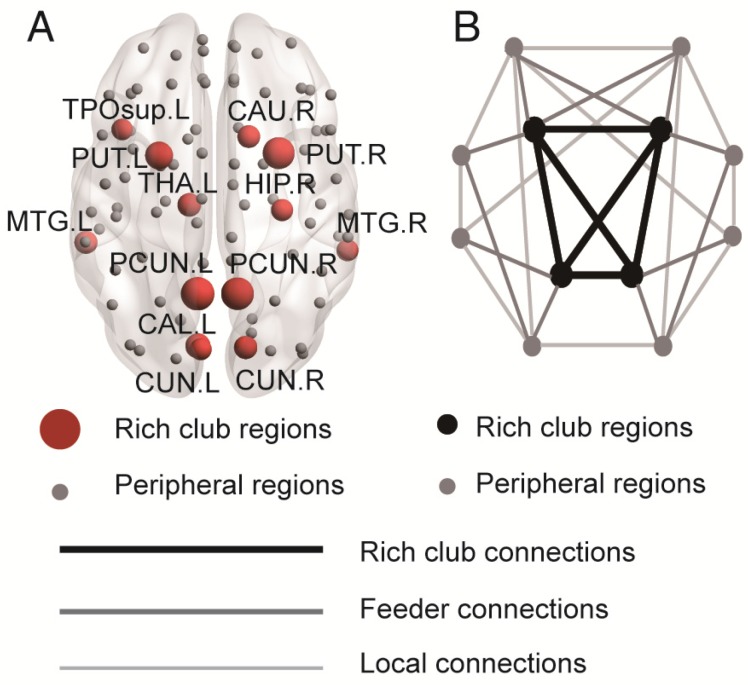
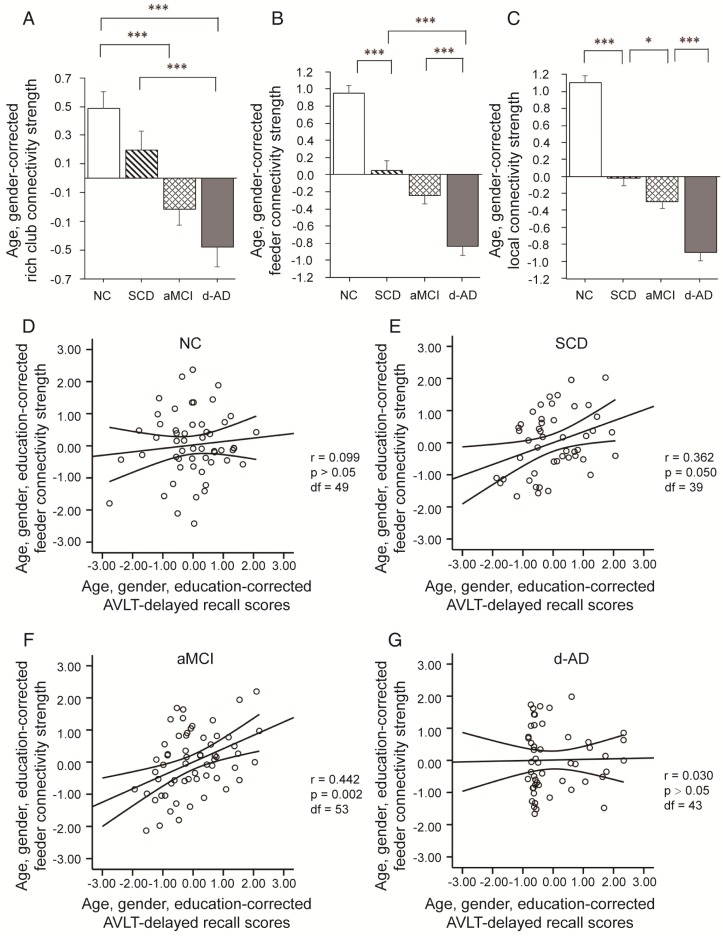
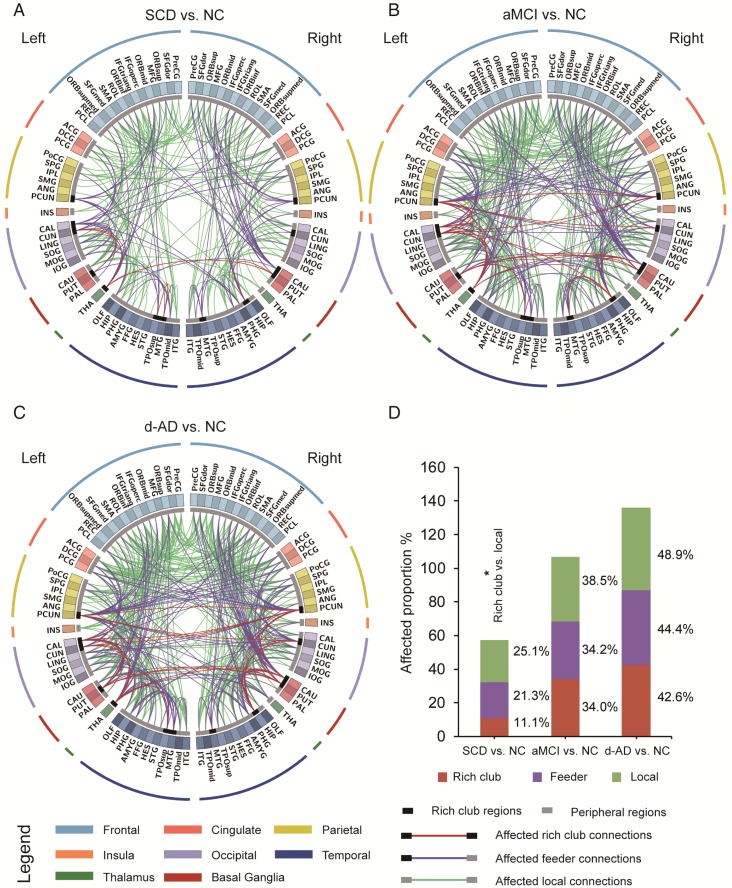
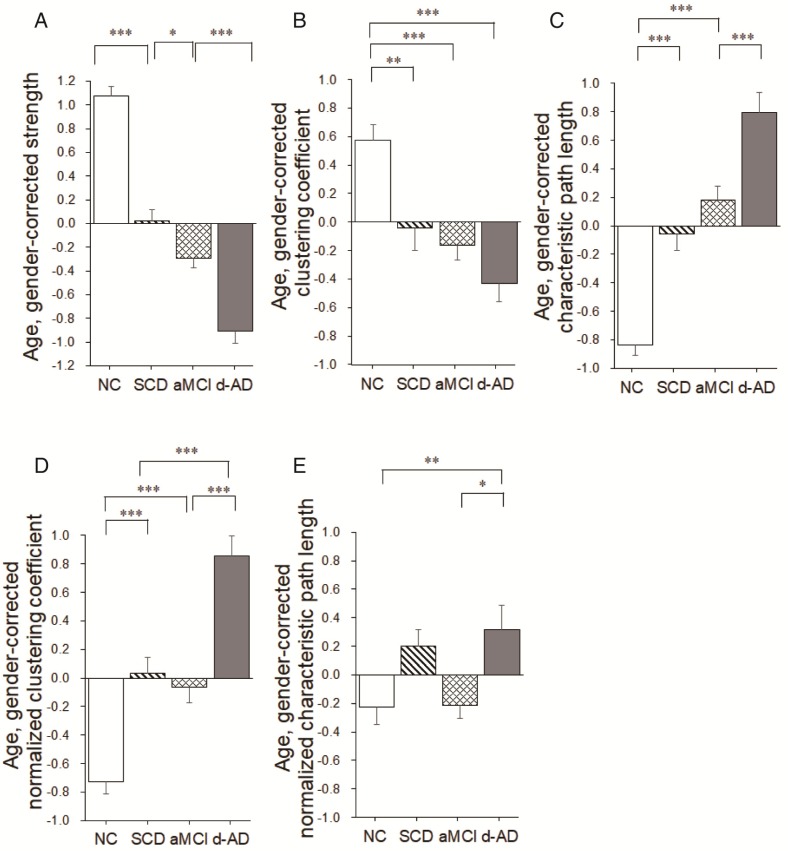
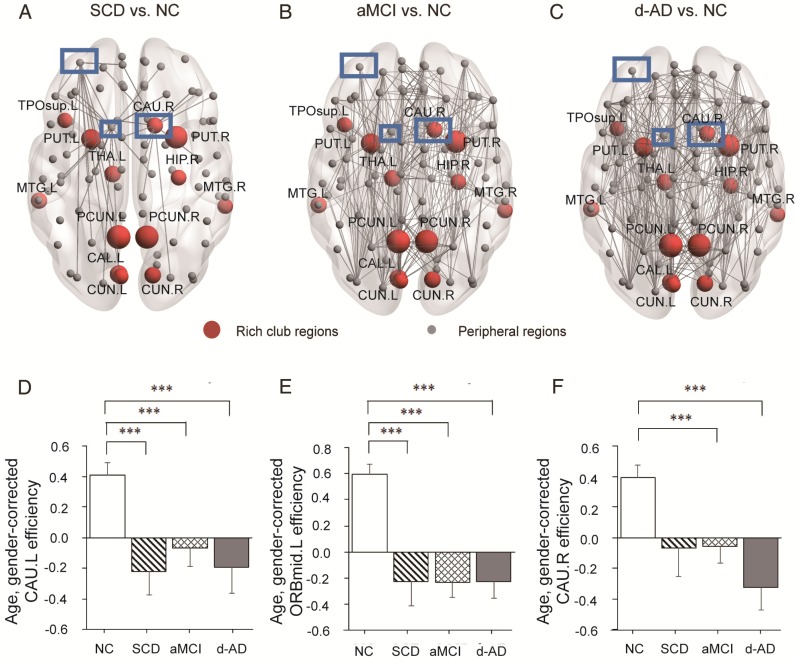
Alzheimer's disease (AD) has a preclinical phase that can last for decades prior to clinical dementia onset. Subjective cognitive decline (SCD) is regarded as the last preclinical AD stage prior to the development of amnestic mild cognitive decline (aMCI) and AD dementia (d-AD). The analysis of brain structural networks based on diffusion tensor imaging (DTI) has identified the so-called 'rich club', a set of cortical regions highly connected to each other, with other regions referred to as peripheral. It has been reported that rich club architecture is affected by regional atrophy and connectivity, which are reduced in patients with aMCI and d-AD. Methods: We recruited 62 normal controls, 47 SCD patients, 60 aMCI patients and 55 d-AD patients and collected DTI data to analyze rich-club organization. Results: We demonstrated that rich club organization was disrupted, with reduced structural connectivity among rich club nodes, in aMCI and d-AD patients but remained stable in SCD patients. In addition, SCD, aMCI and d-AD patients showed similar patterns of disrupted peripheral regions and reduced connectivity involving these regions, suggesting that peripheral regions might contribute to cognitive decline and that disruptions here could be regarded as an early marker of SCD. This organization could provide the fundamental structural architecture for complex cognitive functions and explain the low prevalence of cognitive problems in SCD patients. Conclusions: These findings reveal a disrupted pattern of the AD connectome that starts in peripheral regions and then hierarchically propagates to rich club regions, when patients show clinical symptoms. This pattern provides evidence that disruptions in rich club organization are a key factor in the progression of AD that can dynamically reflect the progression of AD, thus representing a potential biomarker for early diagnosis.
Keywords: Alzheimer's disease; DTI; graph theory; rich club; subjective cognitive decline.
Conflict of interest statement
Competing Interests: The authors have declared that no competing interest exists.
Figures
Similar articles
-
Disrupted Patterns of Rich-Club and Diverse-Club Organizations in Subjective Cognitive Decline and Amnestic Mild Cognitive Impairment.Front Neurosci. 2020 Oct 15;14:575652. doi: 10.3389/fnins.2020.575652. eCollection 2020. Front Neurosci. 2020. PMID: 33177982 Free PMC article.
-
Rich club analysis in the Alzheimer's disease connectome reveals a relatively undisturbed structural core network.Hum Brain Mapp. 2015 Aug;36(8):3087-103. doi: 10.1002/hbm.22830. Epub 2015 Jun 3. Hum Brain Mapp. 2015. PMID: 26037224 Free PMC article.
-
Predicting progression from subjective cognitive decline to mild cognitive impairment or dementia based on brain atrophy patterns.Alzheimers Res Ther. 2024 Jul 5;16(1):153. doi: 10.1186/s13195-024-01517-5. Alzheimers Res Ther. 2024. PMID: 38970077 Free PMC article.
-
Neuroimaging advances regarding subjective cognitive decline in preclinical Alzheimer's disease.Mol Neurodegener. 2020 Sep 22;15(1):55. doi: 10.1186/s13024-020-00395-3. Mol Neurodegener. 2020. PMID: 32962744 Free PMC article. Review.
-
Disrupted structural and functional brain connectomes in mild cognitive impairment and Alzheimer's disease.Neurosci Bull. 2014 Apr;30(2):217-32. doi: 10.1007/s12264-013-1421-0. Epub 2014 Apr 15. Neurosci Bull. 2014. PMID: 24733652 Free PMC article. Review.
Cited by
-
Epileptic Seizure Detection Based on EEG Signals and CNN.Front Neuroinform. 2018 Dec 10;12:95. doi: 10.3389/fninf.2018.00095. eCollection 2018. Front Neuroinform. 2018. PMID: 30618700 Free PMC article.
-
Neuroimaging of Mouse Models of Alzheimer's Disease.Biomedicines. 2022 Jan 28;10(2):305. doi: 10.3390/biomedicines10020305. Biomedicines. 2022. PMID: 35203515 Free PMC article. Review.
-
Integrative Models of Brain Structure and Dynamics: Concepts, Challenges, and Methods.Front Neurosci. 2021 Oct 29;15:752332. doi: 10.3389/fnins.2021.752332. eCollection 2021. Front Neurosci. 2021. PMID: 34776853 Free PMC article. Review.
-
Rich-club reorganization of functional brain networks in acute mild traumatic brain injury with cognitive impairment.Quant Imaging Med Surg. 2022 Jul;12(7):3932-3946. doi: 10.21037/qims-21-915. Quant Imaging Med Surg. 2022. PMID: 35782237 Free PMC article.
-
Brain neurometabolites differences in individuals with subjective cognitive decline plus: a quantitative single- and multi-voxel proton magnetic resonance spectroscopy study.Quant Imaging Med Surg. 2021 Sep;11(9):4074-4096. doi: 10.21037/qims-20-1254. Quant Imaging Med Surg. 2021. PMID: 34476190 Free PMC article.
References
-
- Buckley RF, Maruff P, Ames D, Bourgeat P, Martins RN, Masters CL. et al. Subjective memory decline predicts greater rates of clinical progression in preclinical Alzheimer's disease. Alzheimers Dement. 2016;12(7):796–804. - PubMed
-
- Mitchell AJ, Beaumont H, Ferguson D, Yadegarfar M, Stubbs B. Risk of dementia and mild cognitive impairment in older people with subjective memory complaints: meta-analysis. Acta Psychiatr Scand. 2014;130:439–51. - PubMed
-
- Rönnlund M, Sundström A, Rolf Adolfsson MD, Nilsson LG. Self-Reported Memory Failures: Associations with Future Dementia in a Population-Based Study with Long-Term Follow-Up. J Am Geriatr Soc. 2015;63:1766–73. - PubMed
Publication types
MeSH terms
LinkOut - more resources
Full Text Sources
Other Literature Sources
Medical
