

Functional role of BTB and CNC Homology 1 gene in pancreatic cancer and its association with survival in patients treated with gemcitabine
- PMID: 29930735
- PMCID: PMC6010980
- DOI: 10.7150/thno.23978
Functional role of BTB and CNC Homology 1 gene in pancreatic cancer and its association with survival in patients treated with gemcitabine
Abstract
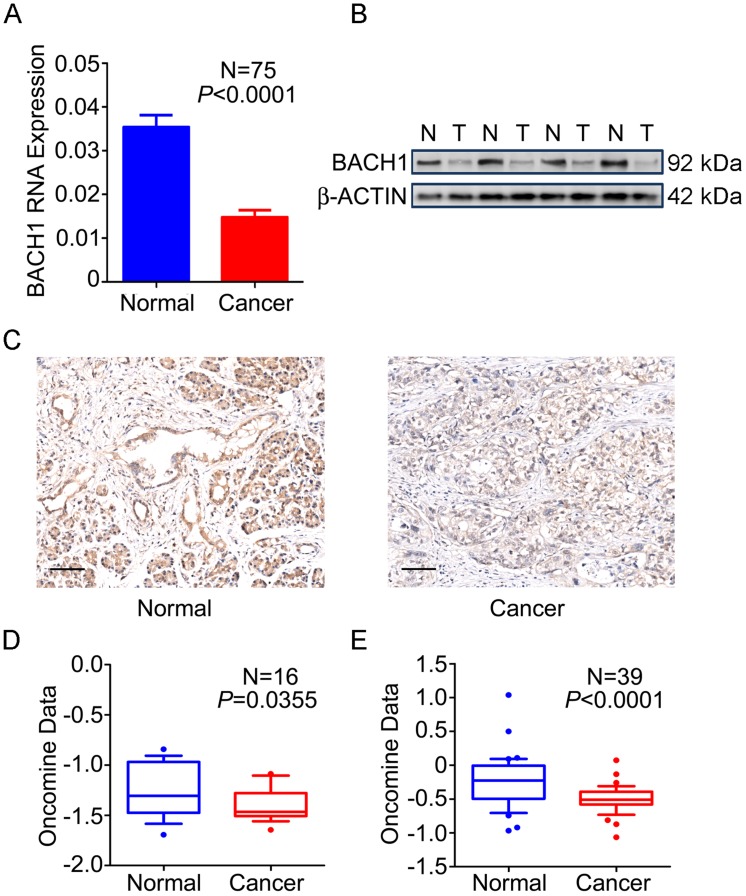
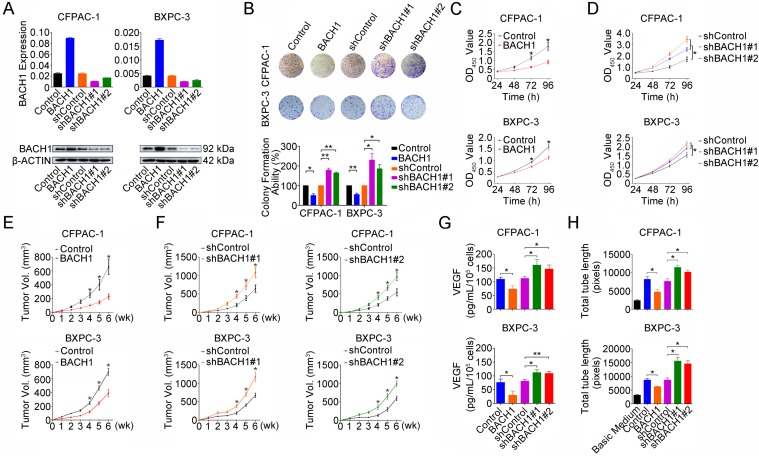
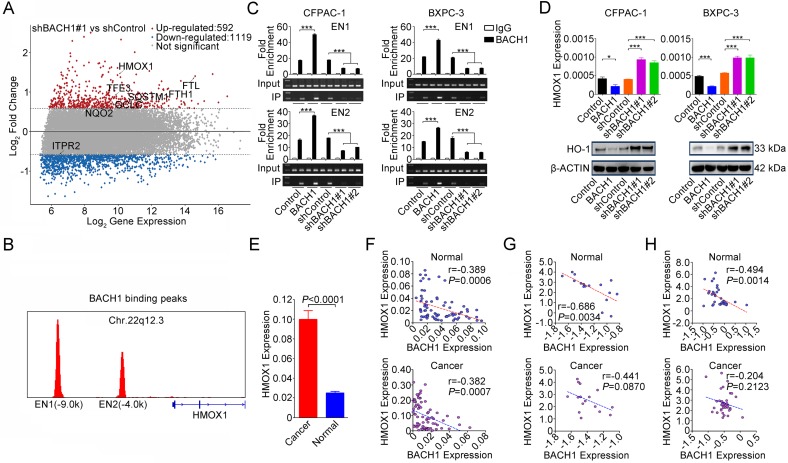
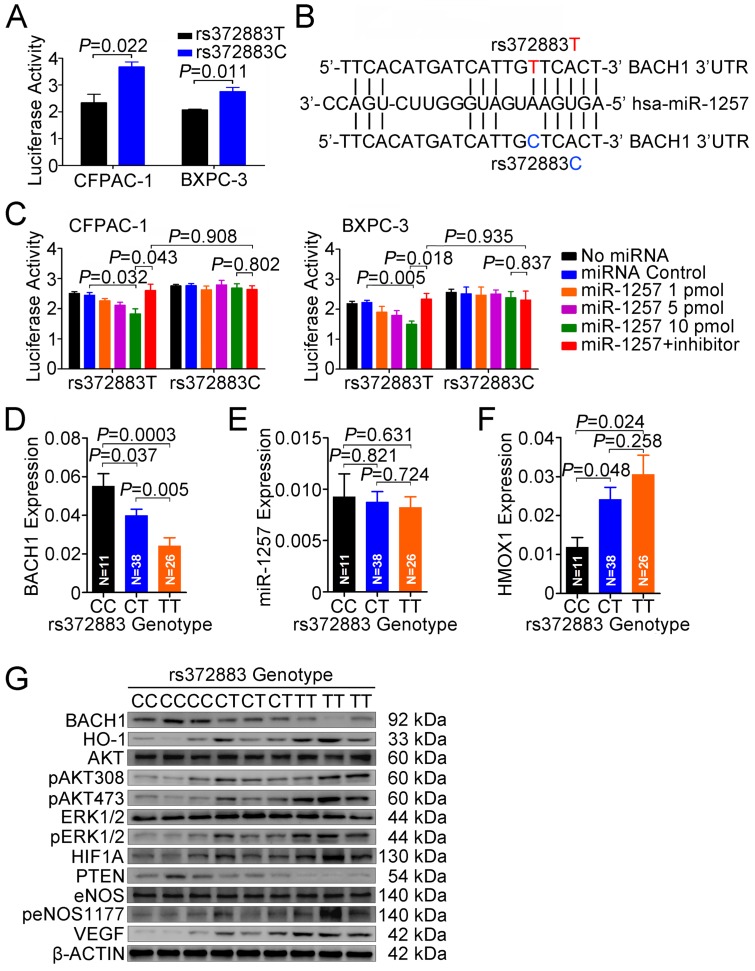
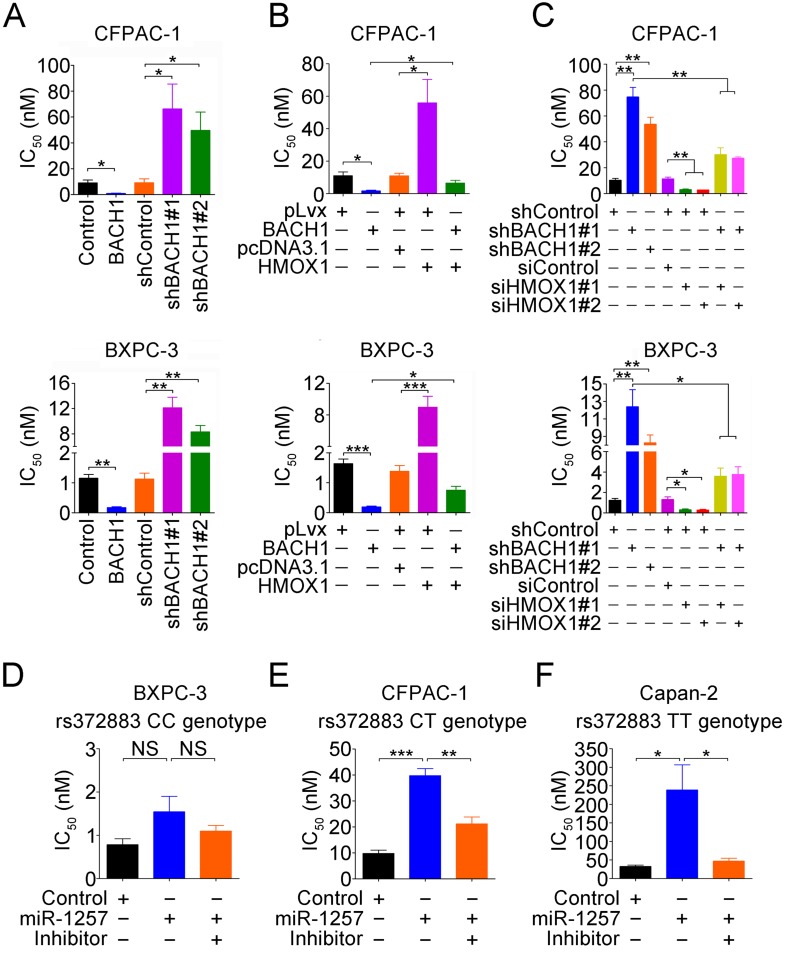
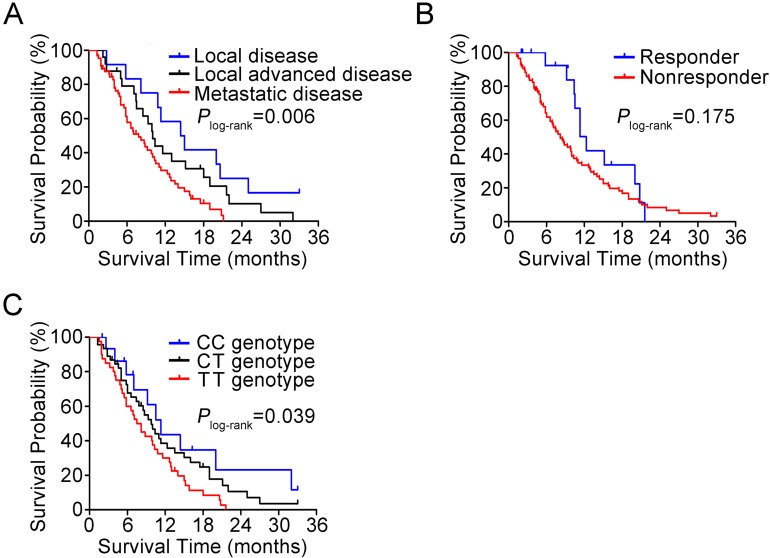
Genetic variation (rs372883C/T) in the 3'-untranslated region of BTB and CNC homology 1 (BACH1) has been associated with pancreatic ductal adenocarcinoma (PDAC) risk in our previous genome-wide association study; however, the action roles of this genetic variation in PDAC remains unknown. Methods:BACH1 expression was measured by quantitative real-time PCR, Western blot and immunohistochemistry. The effects of BACH1 on cell proliferation and sensitivity to gemcitabine were examined by alteration of BACH1 expression in PDAC cells. Angiogenesis was determined in vitro using a human umbilical vein endothelial cell model. Reporter gene assays were conducted to compare the effects of microRNA-1257 on rs372883 variation. The associations between rs372883 variants and survival time in patients treated with gemcitabine were estimated by logistic regression. Results: We found substantially lower BACH1 expression in PDAC compared with normal pancreatic tissues and the rs372883T allele had significantly lower BACH1 levels than the rs372883C allele in both tumor and normal tissues. Knockdown of BACH1 expression provoked proliferation of PDAC cells and angiogenesis, which might result from upregulation of hemeoxygenase-1 that evokes oncogenic AKT and ERK signaling. The rs372883T>C change inhibits interaction of BACH1 with microRNA-1257, resulting in increased BACH1 expression. PDAC patients with the rs372883T allele were more resistant to gemcitabine and had shorter survival time compared with those with the rs372883C allele. Conclusion: These results shed light on the mechanism underlying the associations of BACH1 rs372883 variation with risk of developing PDAC and differential gemcitabine sensitivity in patients.
Keywords: BACH1; HO-1; genetic variation; pancreatic cancer; survival.
Conflict of interest statement
Competing Interests: The authors have declared that no competing interest exists.
Figures

Similar articles
-
Transcription factor BACH1 in cancer: roles, mechanisms, and prospects for targeted therapy.Biomark Res. 2024 Feb 7;12(1):21. doi: 10.1186/s40364-024-00570-4. Biomark Res. 2024. PMID: 38321558 Free PMC article. Review.
-
S100A14 promotes progression and gemcitabine resistance in pancreatic cancer.Pancreatology. 2021 Apr;21(3):589-598. doi: 10.1016/j.pan.2021.01.011. Epub 2021 Jan 22. Pancreatology. 2021. PMID: 33579599
-
MiR-21 upregulation induced by promoter zone histone acetylation is associated with chemoresistance to gemcitabine and enhanced malignancy of pancreatic cancer cells.Asian Pac J Cancer Prev. 2013;14(12):7529-36. doi: 10.7314/apjcp.2013.14.12.7529. Asian Pac J Cancer Prev. 2013. PMID: 24460329
-
Integrinβ1 modulates tumour resistance to gemcitabine and serves as an independent prognostic factor in pancreatic adenocarcinomas.Tumour Biol. 2016 Sep;37(9):12315-12327. doi: 10.1007/s13277-016-5061-7. Epub 2016 Jun 11. Tumour Biol. 2016. PMID: 27289231
-
The Multifaceted Roles of BACH1 in Disease: Implications for Biological Functions and Therapeutic Applications.Adv Sci (Weinh). 2025 Mar;12(10):e2412850. doi: 10.1002/advs.202412850. Epub 2025 Jan 30. Adv Sci (Weinh). 2025. PMID: 39887888 Free PMC article. Review.
Cited by
-
The landscape of GWAS validation; systematic review identifying 309 validated non-coding variants across 130 human diseases.BMC Med Genomics. 2022 Apr 1;15(1):74. doi: 10.1186/s12920-022-01216-w. BMC Med Genomics. 2022. PMID: 35365203 Free PMC article.
-
PRMT1 promotes epigenetic reprogramming associated with acquired chemoresistance in pancreatic cancer.Cell Rep. 2024 May 28;43(5):114176. doi: 10.1016/j.celrep.2024.114176. Epub 2024 Apr 30. Cell Rep. 2024. PMID: 38691454 Free PMC article.
-
Transcription factor BACH1 in cancer: roles, mechanisms, and prospects for targeted therapy.Biomark Res. 2024 Feb 7;12(1):21. doi: 10.1186/s40364-024-00570-4. Biomark Res. 2024. PMID: 38321558 Free PMC article. Review.
-
Metformin inhibits pancreatic cancer metastasis caused by SMAD4 deficiency and consequent HNF4G upregulation.Protein Cell. 2021 Feb;12(2):128-144. doi: 10.1007/s13238-020-00760-4. Epub 2020 Jul 31. Protein Cell. 2021. PMID: 32737864 Free PMC article.
-
Cytoprotective Role of Heme Oxygenase-1 in Cancer Chemoresistance: Focus on Antioxidant, Antiapoptotic, and Pro-Autophagy Properties.Antioxidants (Basel). 2023 Jun 5;12(6):1217. doi: 10.3390/antiox12061217. Antioxidants (Basel). 2023. PMID: 37371947 Free PMC article. Review.
References
-
- Li D, Xie K, Wolff R, Abbruzzese JL. Pancreatic cancer. Lancet. 2004;363:1049–57. - PubMed
-
- Siegel R, Ma J, Zou Z, Jemal A. Cancer statistics, 2014. CA Cancer J Clin. 2014;64:9–29. - PubMed
-
- Burris 3rd HA, Moore MJ, Andersen J, Green MR, Rothenberg ML, Modiano MR. et al. Improvements in survival and clinical benefit with gemcitabine as first-line therapy for patients with advanced pancreas cancer: a randomized trial. J Clin Oncol. 1997;15:2403–13. - PubMed
-
- Oettle H, Richards D, Ramanathan RK, van Laethem JL, Peeters M, Fuchs M. et al. A phase III trial of pemetrexed plus gemcitabine versus gemcitabine in patients with unresectable or metastatic pancreatic cancer. Ann Oncol. 2005;16:1639–45. - PubMed
-
- Raimondi S, Maisonneuve P, Lowenfels AB. Epidemiology of pancreatic cancer: an overview. Nat Rev Gastroenterol Hepatol. 2009;6:699–708. - PubMed
Publication types
MeSH terms
Substances
LinkOut - more resources
Full Text Sources
Other Literature Sources
Medical
Molecular Biology Databases
Research Materials
Miscellaneous
