. 2018 Jan 12;5(4):499-522.
doi: 10.1016/j.jcmgh.2018.01.006. eCollection 2018.

Organic Solute Transporter α-β Protects Ileal Enterocytes From Bile Acid-Induced Injury

Affiliations

Organic Solute Transporter α-β Protects Ileal Enterocytes From Bile Acid-Induced Injury

Courtney B Ferrebee et al. Cell Mol Gastroenterol Hepatol. .

Abstract

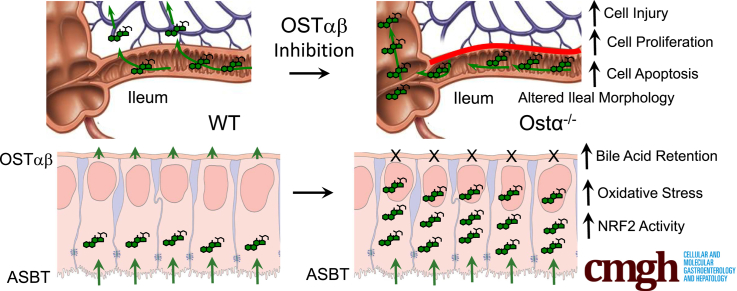
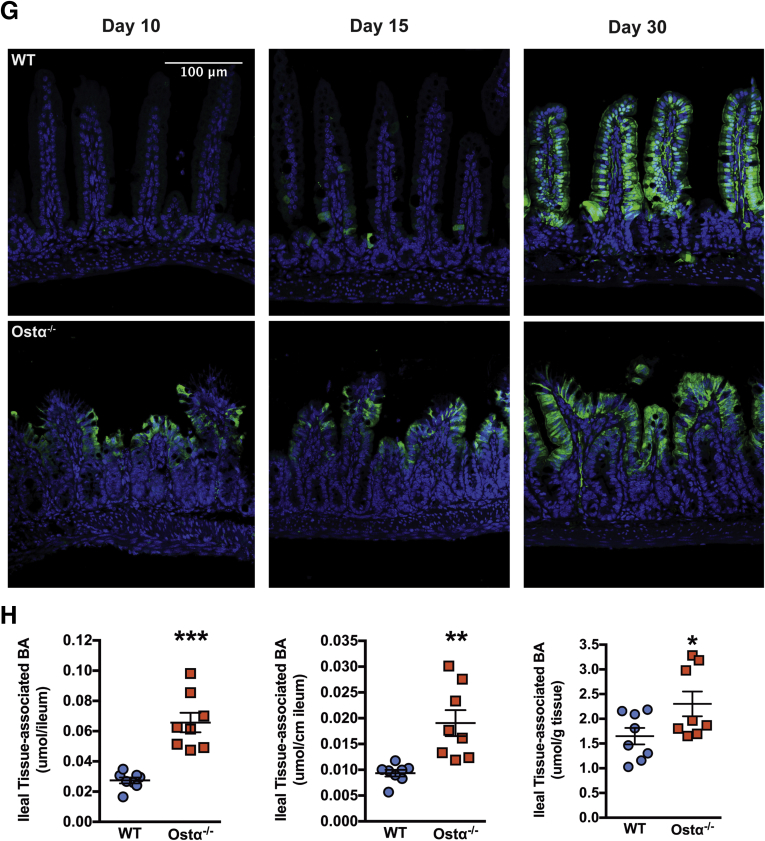
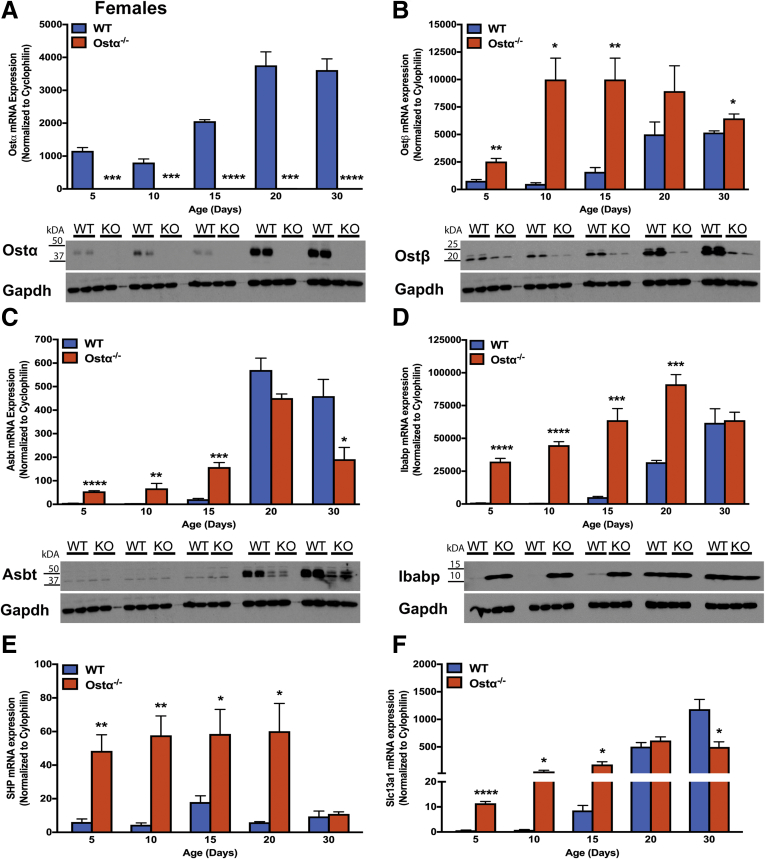
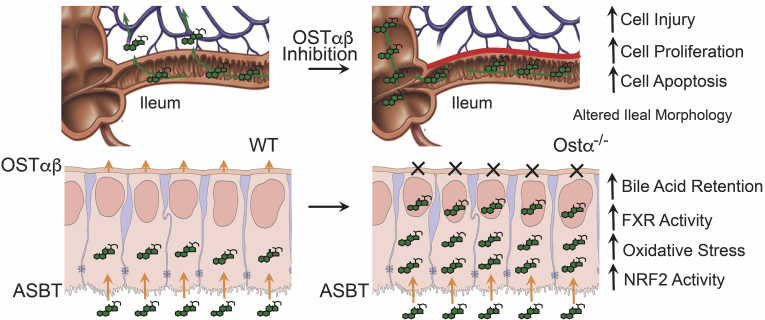
Background & aims: Ileal bile acid absorption is mediated by uptake via the apical sodium-dependent bile acid transporter (ASBT), and export via the basolateral heteromeric organic solute transporter α-β (OSTα-OSTβ). In this study, we investigated the cytotoxic effects of enterocyte bile acid stasis in Ostα-/- mice, including the temporal relationship between intestinal injury and initiation of the enterohepatic circulation of bile acids.

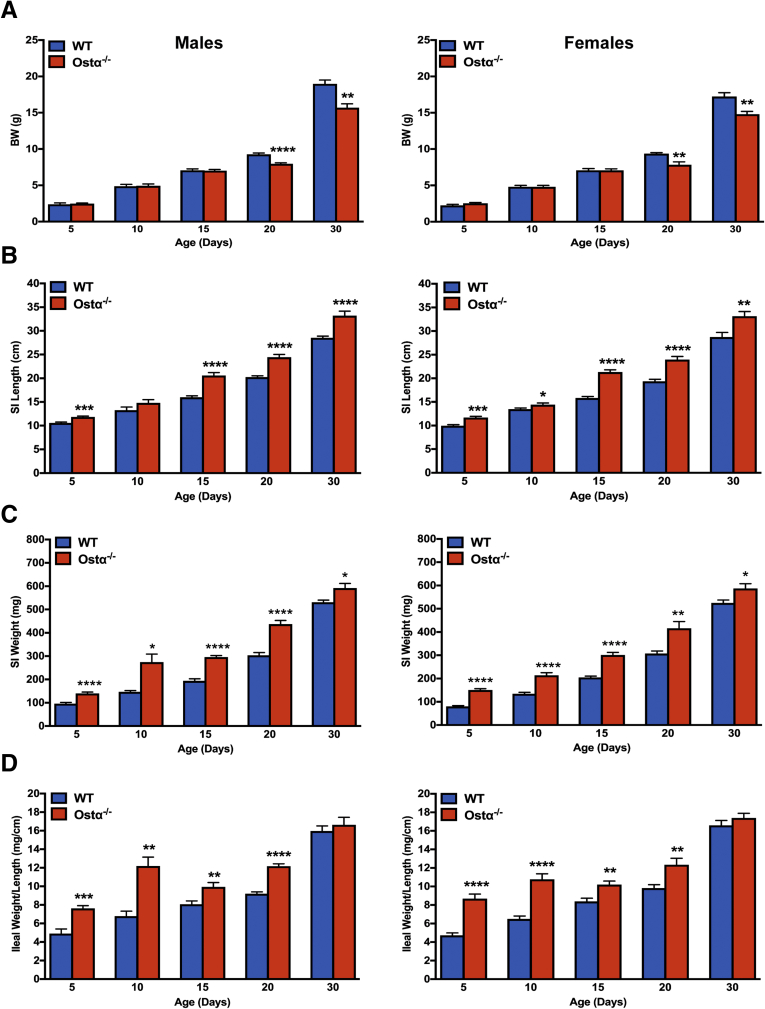
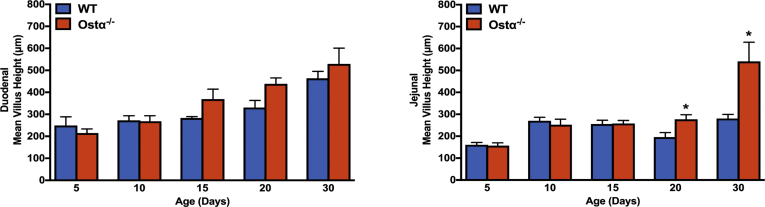
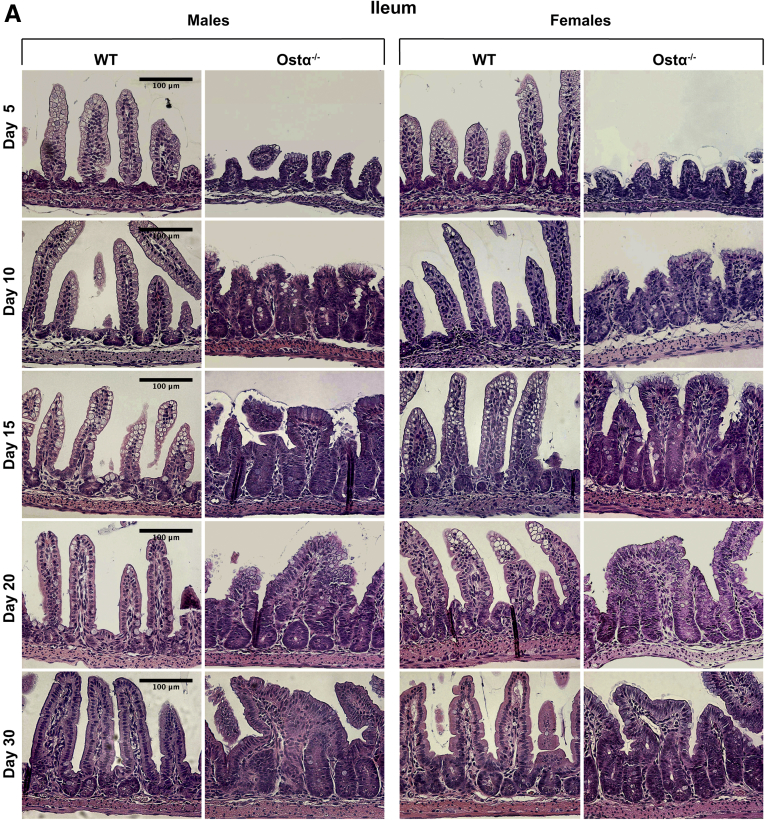
Methods: Ileal tissue morphometry, histology, markers of cell proliferation, gene, and protein expression were analyzed in male and female wild-type and Ostα-/- mice at postnatal days 5, 10, 15, 20, and 30. Ostα-/-Asbt-/- mice were generated and analyzed. Bile acid activation of intestinal Nrf2-activated pathways was investigated in Drosophila.

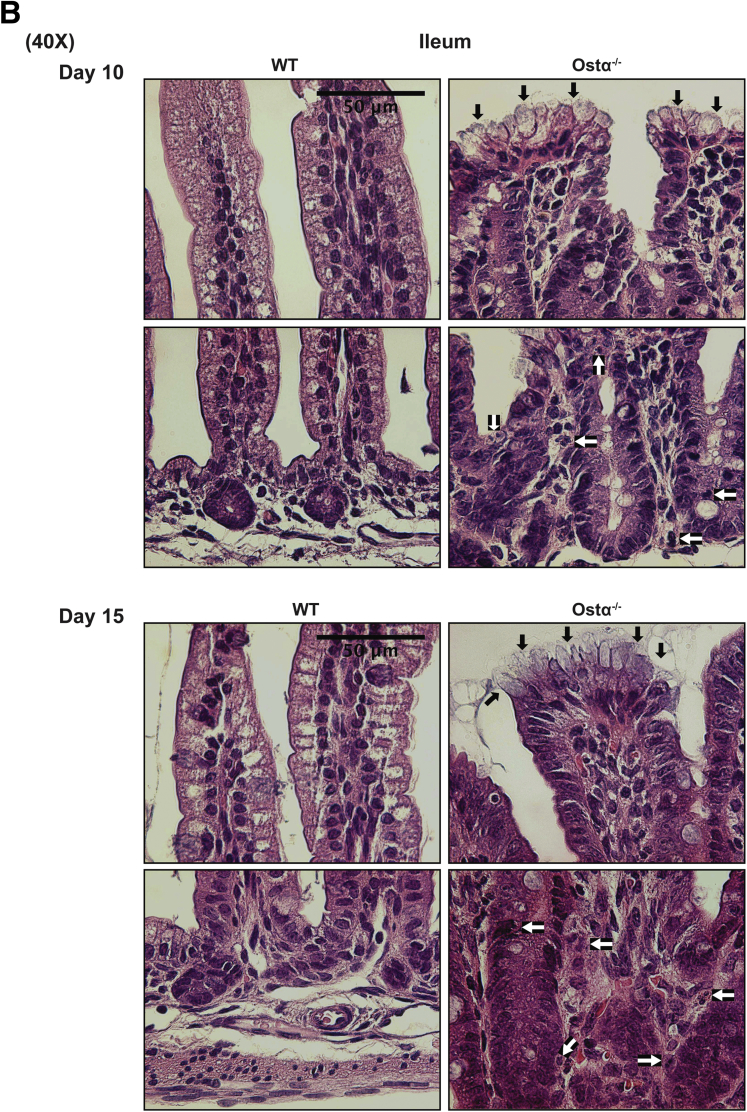
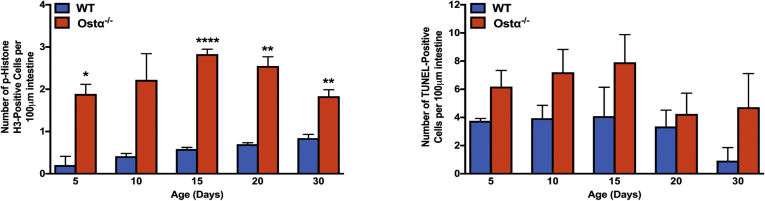
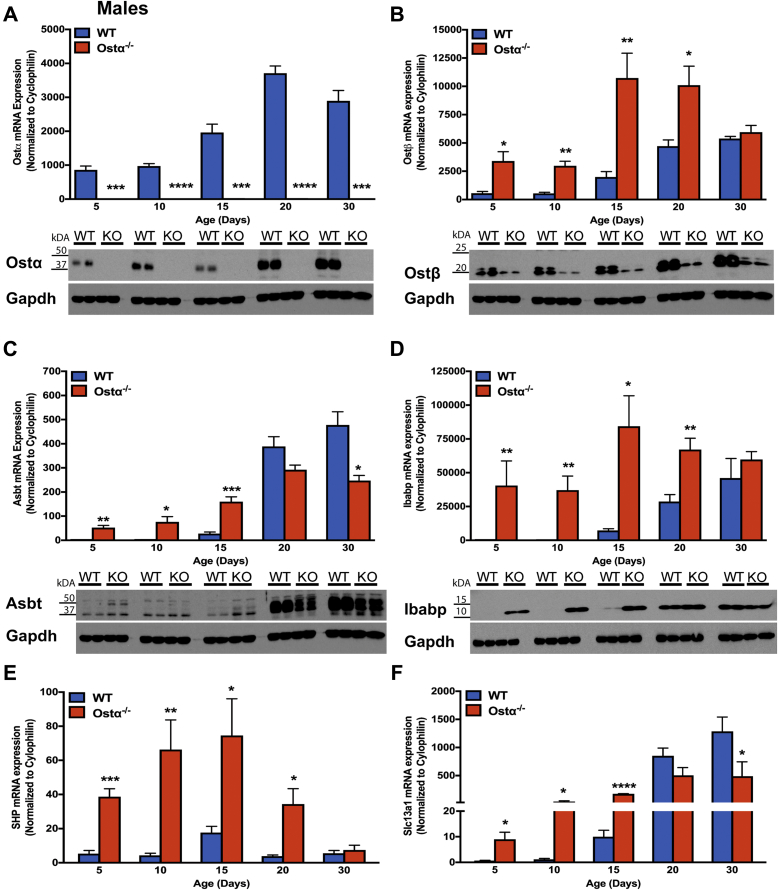
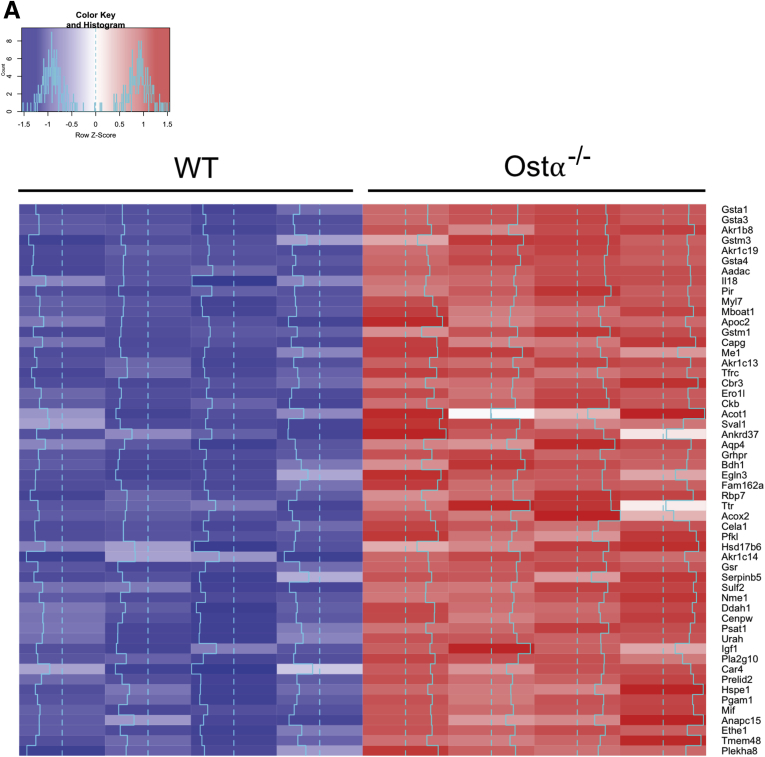
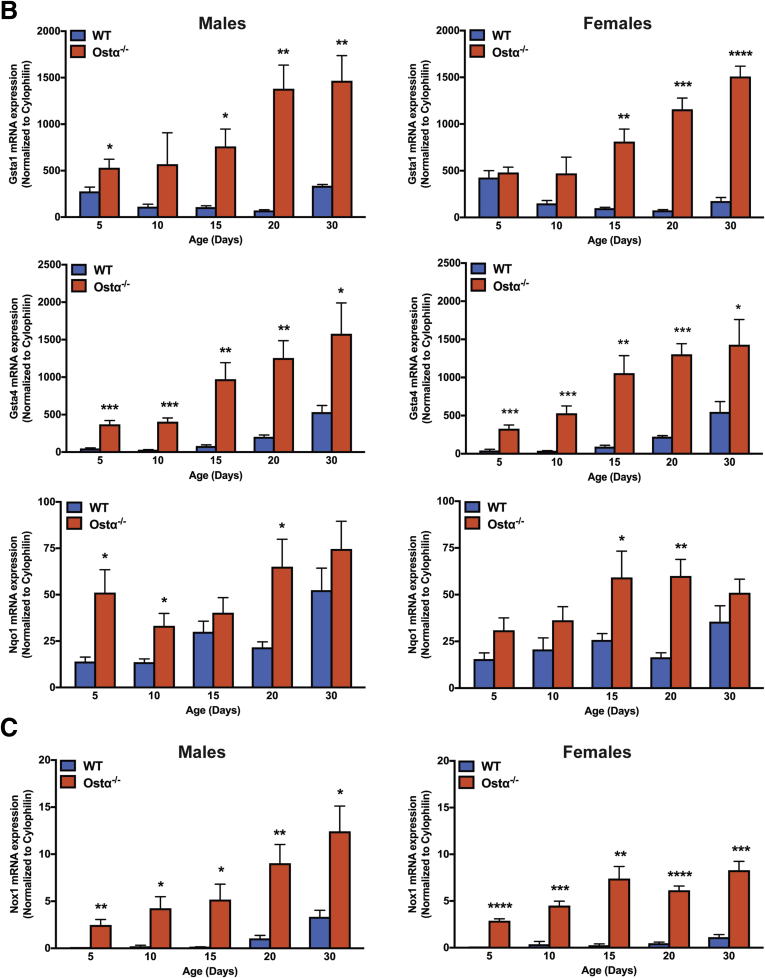
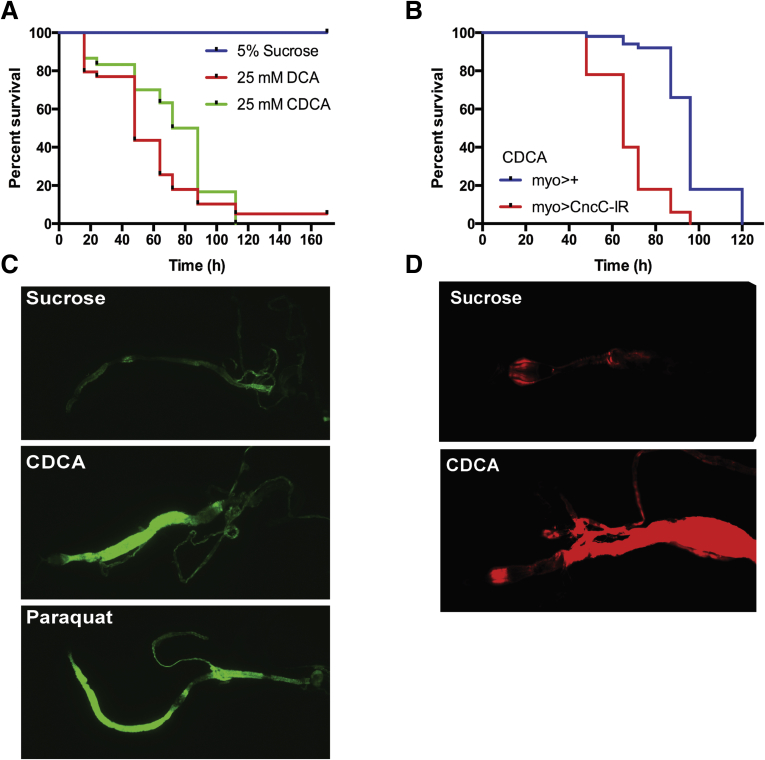
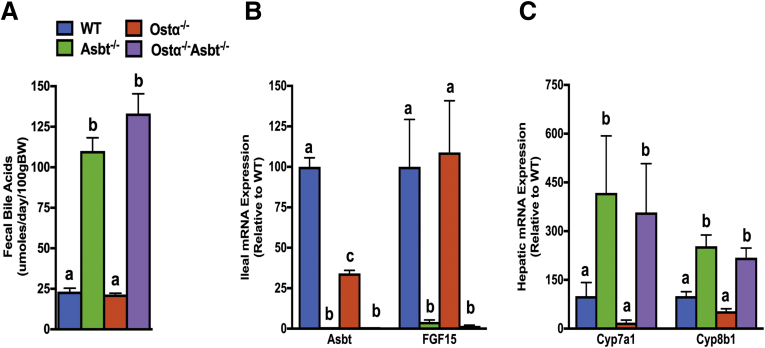
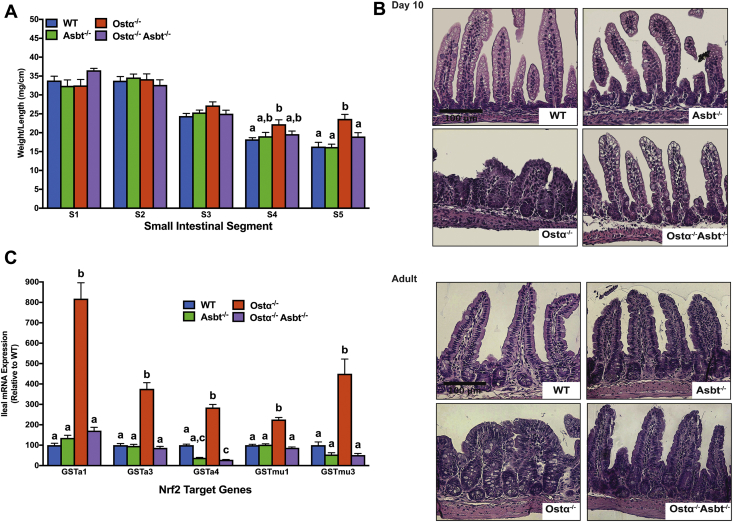
Results: As early as day 5, Ostα-/- mice showed significantly increased ileal weight per length, decreased villus height, and increased epithelial cell proliferation. This correlated with premature expression of the Asbt and induction of bile acid-activated farnesoid X receptor target genes in neonatal Ostα-/- mice. Expression of reduced nicotinamide adenine dinucleotide phosphate oxidase-1 and Nrf2-anti-oxidant responsive genes were increased significantly in neonatal Ostα-/- mice at these postnatal time points. Bile acids also activated Nrf2 in Drosophila enterocytes and enterocyte-specific knockdown of Nrf2 increased sensitivity of flies to bile acid-induced toxicity. Inactivation of the Asbt prevented the changes in ileal morphology and induction of anti-oxidant response genes in Ostα-/- mice.

Conclusions: Early in postnatal development, loss of Ostα leads to bile acid accumulation, oxidative stress, and a restitution response in ileum. In addition to its essential role in maintaining bile acid homeostasis, Ostα-Ostβ functions to protect the ileal epithelium against bile acid-induced injury. NCBI Gene Expression Omnibus: GSE99579.

Keywords: ARE, anti-oxidant response element; Asbt, apical sodium-dependent bile acid transporter; CDCA, chenodeoxycholic acid; Drosophila; FGF, fibroblast growth factor; FXR, farnesoid X receptor; GAPDH, glyceraldehyde-3-phosphate dehydrogenase; GFP, green fluorescence protein; GSH, reduced glutathione; GSSG, oxidized glutathione; Ibabp, ileal bile acid binding protein; Ileum; NEC, necrotizing enterocolitis; Neonate; Nox, reduced nicotinamide adenine dinucleotide phosphate oxidase; Nrf2, nuclear factor (erythroid-derived 2)-like 2; Nuclear Factor Erythroid-Derived 2-Like 2; Ost, organic solute transporter; PBS, phosphate-buffered saline; ROS, reactive oxygen species; Reactive Oxygen Species; TNF, tumor necrosis factor; TUNEL, terminal deoxynucleotidyl transferase–mediated deoxyuridine triphosphate nick-end labeling; WT, wild type; cRNA, complementary RNA; mRNA, messenger RNA.


Figures

None
Graphical abstract
Figure 1
Figure 1
Ontogeny of the small intestinal morphologic changes in male and female WT and Ostα-/-mice. (A) Body weight (BW). (B) Small intestinal (SI) length. (C) Small intestinal weight. (D) Distal small intestinal weight per unit length. The small intestine was subdivided into 3 equal-length segments and the weight of the distal third encompassing the ileum is shown as mg/cm length. Mice from 2 to 4 litters were included in the analysis for each sex, genotype, and postnatal age group (n = 8–20 per group). Mean values ± SEM are shown. Significant differences between genotypes for that sex and age were as follows: *P < .05, **P < 0.01, ***P < .001, and ****P < .0001.
Figure 2
Figure 2
Intestinal morphology of proximal small intestine and jejunum in male and female WT and Ostα-/-mice. Quantitative morphometric analysis of small intestine of WT and Ostα-/- mice. The small intestine of mice of the indicated age and genotype was divided into 3 equal segments. H&E-stained sections from segments 1 and 2 were used to measure the villus height in 20 well-oriented, high-power fields per mouse. Data are expressed as the means (n = 3–5 mice per group). Mean values ± SEM are shown. Significant differences between genotypes for that age were as follows: *P < .05.
Figure 3
Figure 3
Ontogeny of the morphologic and histologic changes in the distal small intestine of male and female WT and Ostα-/-mice. (A) Representative light micrographs of H&E-stained transverse sections of distal small intestine. Original magnification, 20×. Scale bar: 100 μm. (B) Representative light micrographs of H&E-stained transverse sections of distal small intestine from 10- and 15-day old WT and Ostα-/- mice. Original magnification, 40×. Scale bar: 50 μm. The altered apical border and mucin-producing goblet cells at the villus tips of Ostα-/- mice are indicated by the black arrows. Mitotic figures, apoptotic cells, and immune cells in the Ostα-/- mice are indicated by the white arrows.
Figure 3
Figure 3
Ontogeny of the morphologic and histologic changes in the distal small intestine of male and female WT and Ostα-/-mice. (A) Representative light micrographs of H&E-stained transverse sections of distal small intestine. Original magnification, 20×. Scale bar: 100 μm. (B) Representative light micrographs of H&E-stained transverse sections of distal small intestine from 10- and 15-day old WT and Ostα-/- mice. Original magnification, 40×. Scale bar: 50 μm. The altered apical border and mucin-producing goblet cells at the villus tips of Ostα-/- mice are indicated by the black arrows. Mitotic figures, apoptotic cells, and immune cells in the Ostα-/- mice are indicated by the white arrows.
Figure 4
Figure 4
Ileal proliferation and apoptosis. Quantitation of the number of phosphohistone H3 and TUNEL-positive cells per unit area. Mice from 2 to 4 litters were included in the analysis for each genotype and postnatal age group (n = 5–8 per group). Mean values ± SEM are shown. Significant differences between genotypes for that age were as follows: *P < .05, **P < .01, and ***P < .001.
Figure 5
Figure 5
Expression of proinflammatory genes in ileum of male and female WT and Ostα-/-mice. RNA was isolated from the distal small intestine of individual mice (n = 4–5 per group) and used for real-time PCR analysis. The mRNA expression was normalized using cyclophilin. Mean values ± SEM are shown. Significant differences between genotypes for that age and sex were as follows: *P < .05, **P < 0.01.
Figure 6
Figure 6
Expression of bile acid transporters and FXR target genes in distal small intestine of male WT and Ostα-/-mice. Expression of mRNA and protein for bile acid transport–related genes: (A) Ostα, (B) Ostβ, (C) Asbt, and (D) Ibabp. Expression of mRNA for FXR target genes: (E) Shp and (F) Slc13a1. For mRNA expression measurements, RNA was isolated from the distal small intestine of individual male mice (n = 4–5 per group) and used for real-time PCR analysis. The mRNA expression was normalized using cyclophilin. For protein expression, extracts were prepared from distal intestine from individual male mice. Equal amounts of protein from 3 to 5 mice per group were pooled and duplicate samples were subjected to immunoblotting analysis. Blots were stripped and re-probed using antibodies to GAPDH as a loading control. (G) Immunostaining of transverse sections of distal small intestine for Ibabp. Original magnification: 20×. Scale bar: 100 μm. (H) Ileal bile acid content of day 10 male WT and Ostα-/- mice. Bile acids were extracted from terminal ileum (last 20% of the small intestine) of 10-day-old male WT or Ostα-/- mice and quantified by enzymatic assay. The bile acid content is expressed as mass per whole ileum, mass per unit length of ileum, and mass per unit weight of ileum. For mRNA expression, bars indicate means ± SEM. Significant differences between genotypes for that age were as follows: *P < .05, **P < .01, and ***P < .001, ∗∗∗∗P < .0001.
Figure 6
Figure 6
Expression of bile acid transporters and FXR target genes in distal small intestine of male WT and Ostα-/-mice. Expression of mRNA and protein for bile acid transport–related genes: (A) Ostα, (B) Ostβ, (C) Asbt, and (D) Ibabp. Expression of mRNA for FXR target genes: (E) Shp and (F) Slc13a1. For mRNA expression measurements, RNA was isolated from the distal small intestine of individual male mice (n = 4–5 per group) and used for real-time PCR analysis. The mRNA expression was normalized using cyclophilin. For protein expression, extracts were prepared from distal intestine from individual male mice. Equal amounts of protein from 3 to 5 mice per group were pooled and duplicate samples were subjected to immunoblotting analysis. Blots were stripped and re-probed using antibodies to GAPDH as a loading control. (G) Immunostaining of transverse sections of distal small intestine for Ibabp. Original magnification: 20×. Scale bar: 100 μm. (H) Ileal bile acid content of day 10 male WT and Ostα-/- mice. Bile acids were extracted from terminal ileum (last 20% of the small intestine) of 10-day-old male WT or Ostα-/- mice and quantified by enzymatic assay. The bile acid content is expressed as mass per whole ileum, mass per unit length of ileum, and mass per unit weight of ileum. For mRNA expression, bars indicate means ± SEM. Significant differences between genotypes for that age were as follows: *P < .05, **P < .01, and ***P < .001, ∗∗∗∗P < .0001.
Figure 7
Figure 7
Ontogeny of distal intestinal expression of bile acid transporters and FXR target genes in female WT and Ostα-/-mice. Expression of mRNA and protein for bile acid transport–related genes: (A) Ostα, (B) Ostβ, (C) Asbt, and (D) Ibabp. Expression of mRNA for FXR target genes: (E) Shp and (F) Slc13a1. RNA was isolated from the distal small intestine of individual female mice (n = 4–5 per group) and used for real-time PCR analysis. The mRNA expression was normalized using cyclophilin. Mean values ± SEM are shown. Significant differences between genotypes for that age were as follows: *P < .05, **P < .01, ***P < .001, and ****P < .0001. For protein expression, extracts were prepared from distal intestine from individual mice. Equal amounts of protein from 3 to 5 mice per group were pooled and duplicate samples were subjected to immunoblotting analysis. Blots were re-probed using antibodies to GAPDH as a load control.
Figure 8
Figure 8
Ileal expression of Nrf2 ARE target genes. (A) Microarray analysis of ileum in adult male WT and Ostα-/- mice. Differentially expressed genes whose expression was induced (2-fold change; P < .05; n = 4) in Ostα-/- vs WT mice are shown as a heat map. The blue line indicates the Z score for each gene. (B) Expression of mRNA for Nrf2 target genes in male and female WT and Ostα-/- mice. (C) Expression of Nox1 mRNA in ileum of male and female WT and Ostα-/- mice. RNA was isolated from the distal small intestine of individual mice at the indicated ages (n = 4–5 per group) and used for real-time PCR analysis. The mRNA expression was normalized using cyclophilin. Mean values ± SEM are shown. Significant differences between genotypes for that age and sex were as follows: *P < .05, **P < .01, ***P < .001, and ****P < .0001.
Figure 8
Figure 8
Ileal expression of Nrf2 ARE target genes. (A) Microarray analysis of ileum in adult male WT and Ostα-/- mice. Differentially expressed genes whose expression was induced (2-fold change; P < .05; n = 4) in Ostα-/- vs WT mice are shown as a heat map. The blue line indicates the Z score for each gene. (B) Expression of mRNA for Nrf2 target genes in male and female WT and Ostα-/- mice. (C) Expression of Nox1 mRNA in ileum of male and female WT and Ostα-/- mice. RNA was isolated from the distal small intestine of individual mice at the indicated ages (n = 4–5 per group) and used for real-time PCR analysis. The mRNA expression was normalized using cyclophilin. Mean values ± SEM are shown. Significant differences between genotypes for that age and sex were as follows: *P < .05, **P < .01, ***P < .001, and ****P < .0001.
Figure 9
Figure 9
Bile acid cytotoxicity and protective role of intestinal Nrf2 (Cap ‘n’ collar isoform-c [cncC]) in Drosophila. (A) Relative survival of 5-day-old adult Drosophila in response to feeding CDCA or deoxycholic acid (DCA). Log-rank test for CDCA or DCA vs sucrose, P < .001, n = 30–44 per group. (B) Relative survival of 5-day-old adult Drosophila in which the levels of cncC (UAS-CncCIR) are diminished; log-rank test for myolA-GAL4 vs myolA-GAL4, UAS-cncCIR, P < .0001, n = 50 per group. (C) Detection of ARE-dependent GFP expression in the midgut of gstD-gfp adult Drosophila fed sucrose, sucrose plus chenodeoxycholic acid, or sucrose plus paraquat. (D) ROS generation in midgut after ingestion of sucrose or sucrose plus 25 mmol/L CDCA. ROS were detected by oxidation of the hydrocyanine ROS-sensitive dye, Hydro-Cy3. Images within a panel were taken at the same confocal settings: original magnification, 20×.
Figure 10
Figure 10
Bile acid metabolism and small intestinal morphologic changes in adult male WT, Asbt-/-, Ostα-/-, and Asbt-/-Ostα-/-mice. (A) Fecal bile acid excretion. (B) Ileal expression of Asbt and FGF15 mRNA. (C) Hepatic expression of Cyp7a1 and Cyp8b1 in adult male mice for the indicated genotypes. The mRNA expression (n = 5) was determined by real-time PCR analysis (in triplicate) and normalized using cyclophilin. The mRNA expression is expressed relative to WT (set at 100%). Male mice (age, 8 wk) were included in the analysis (n = 5 per genotype). Mean values ± SEM are shown. Different lowercase letters indicate significant differences (P < .05) between genotypes. BW, body weight.
Figure 11
Figure 11
Inactivation of the Asbt prevents ileal injury in Ostα-/-mice. (A) Small intestinal weight per unit length in adult (age, 8 wk) WT, Asbt-/-, Ostα-/-, and Asbt-/-Ostα-/- male mice. The small intestine was subdivided into 5 equal-length segments and the weight of each is shown as mg/cm length. Mean values ± SEM (n = 5 mice per group) are shown. Distinct lowercase letters indicate significant differences (P < .05) between genotypes for that particular intestinal segment. (B) Representative light micrographs of H&E-stained transverse sections of distal small intestine from day 10 and adult (age, 8 wk) WT, Asbt-/-, Ostα-/-, and Asbt-/-Ostα-/- male mice. Original magnification, 20×. Scale bar: 100 μm. (C) Gstα1, Gstα3, Gstα4, Gstmu1, and Gstmu3 mRNA expression in adult male mice for the indicated genotypes. The mRNA expression (n = 5 mice per group) was determined by real-time PCR analysis (in triplicate) and normalized using cyclophilin. The mRNA levels are shown relative to WT (set at 100%). Different lowercase letters indicate significant differences (P < .05) between genotypes for that gene.
Figure 12
Figure 12
Ostα-Ostβ protects the ileum against bile acid accumulation and bile acid–induced injury. The schematic summarizes our findings. OSTα-OSTβ functions along with the ASBT to reabsorb bile acids from the ileal lumen and to maintain their enterohepatic circulation. Ostα deficiency leads to ileal morphologic changes associated with increased enterocyte proliferation and apoptosis. In the ileal epithelium, loss of Ostα leads to increased bile acid retention and increased FXR target gene expression early in postnatal development. This is associated with increased oxidative stress, increased expression of Nrf2/anti-oxidant and cytoprotective genes, and restitution of the epithelium.

References

    1. Boyer J.L. Bile formation and secretion. Compr Physiol. 2013;3:1035–1078. - PMC - PubMed
    1. Dawson P.A., Karpen S.J. Intestinal transport and metabolism of bile acids. J Lipid Res. 2015;56:1085–1099. - PMC - PubMed
    1. Dawson P.A., Hubbert M., Haywood J., Craddock A.L., Zerangue N., Christian W.V., Ballatori N. The heteromeric organic solute transporter alpha-beta, Ostalpha-Ostbeta, is an ileal basolateral bile acid transporter. J Biol Chem. 2005;280:6960–6968. - PMC - PubMed
    1. Ballatori N., Christian W.V., Lee J.Y., Dawson P.A., Soroka C.J., Boyer J.L., Madejczyk M.S., Li N. OSTalpha-OSTbeta: a major basolateral bile acid and steroid transporter in human intestinal, renal, and biliary epithelia. Hepatology. 2005;42:1270–1279. - PubMed
    1. Heubi J.E., Balistreri W.F., Fondacaro J.D., Partin J.C., Schubert W.K. Primary bile acid malabsorption: defective in vitro ileal active bile acid transport. Gastroenterology. 1982;83:804–811. - PubMed

LinkOut - more resources