. 2017 Dec 29;5(4):669-677.e2.
doi: 10.1016/j.jcmgh.2017.12.008. eCollection 2018.

Enhanced Utilization of Induced Pluripotent Stem Cell-Derived Human Intestinal Organoids Using Microengineered Chips

Affiliations

Enhanced Utilization of Induced Pluripotent Stem Cell-Derived Human Intestinal Organoids Using Microengineered Chips

Michael J Workman et al. Cell Mol Gastroenterol Hepatol. .

Abstract

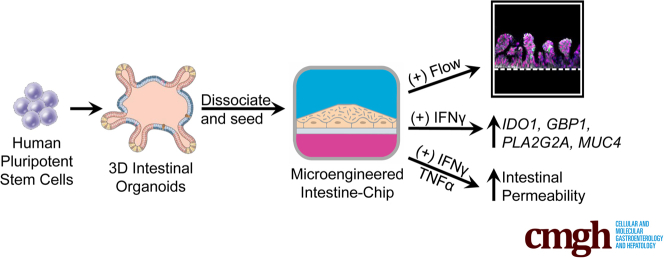
Background and aims: Human intestinal organoids derived from induced pluripotent stem cells have tremendous potential to elucidate the intestinal epithelium's role in health and disease, but it is difficult to directly assay these complex structures. This study sought to make this technology more amenable for study by obtaining epithelial cells from induced pluripotent stem cell-derived human intestinal organoids and incorporating them into small microengineered Chips. We then investigated if these cells within the Chip were polarized, had the 4 major intestinal epithelial subtypes, and were biologically responsive to exogenous stimuli.

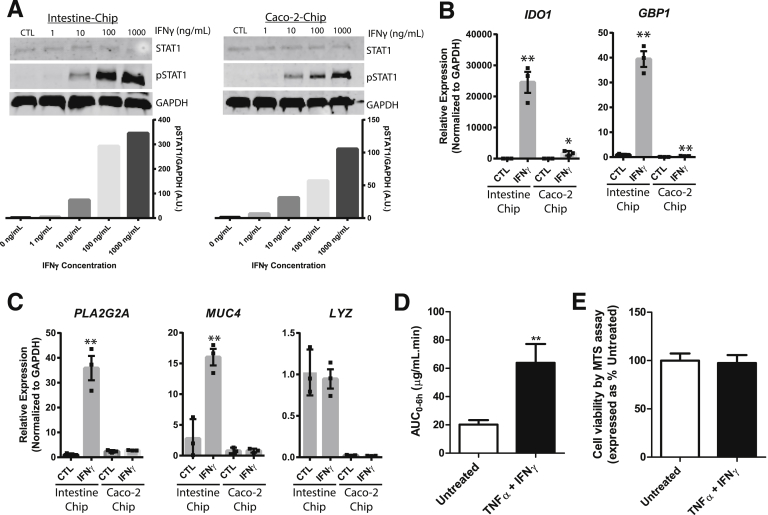
Methods: Epithelial cells were positively selected from human intestinal organoids and were incorporated into the Chip. The effect of continuous media flow was examined. Immunocytochemistry and in situ hybridization were used to demonstrate that the epithelial cells were polarized and possessed the major intestinal epithelial subtypes. To assess if the incorporated cells were biologically responsive, Western blot analysis and quantitative polymerase chain reaction were used to assess the effects of interferon (IFN)-γ, and fluorescein isothiocyanate-dextran 4 kDa permeation was used to assess the effects of IFN-γ and tumor necrosis factor-α on barrier function.

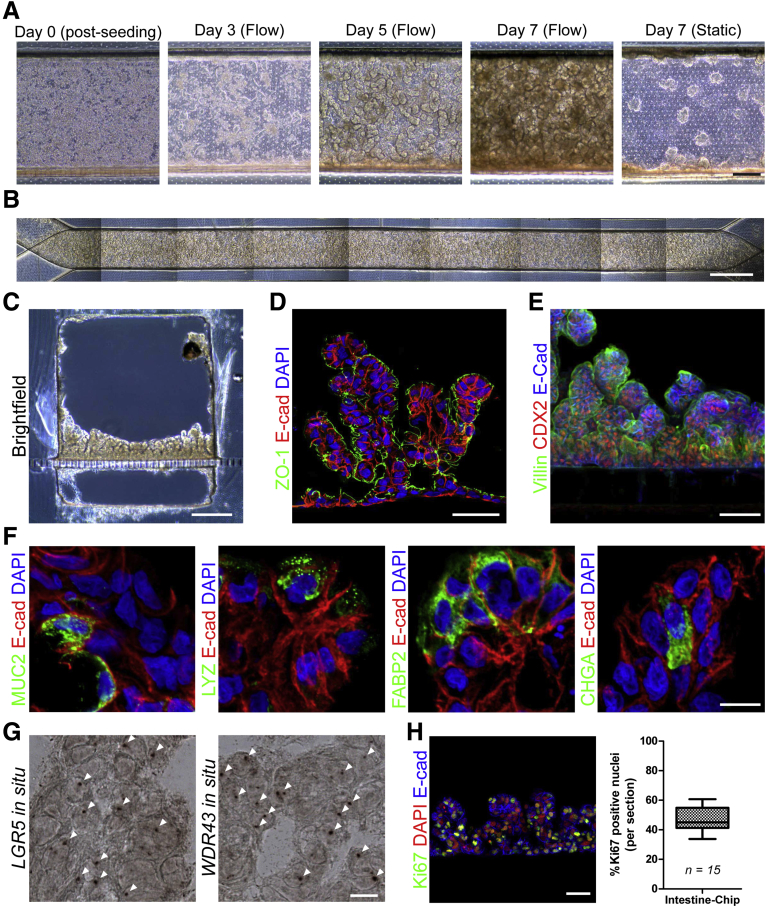
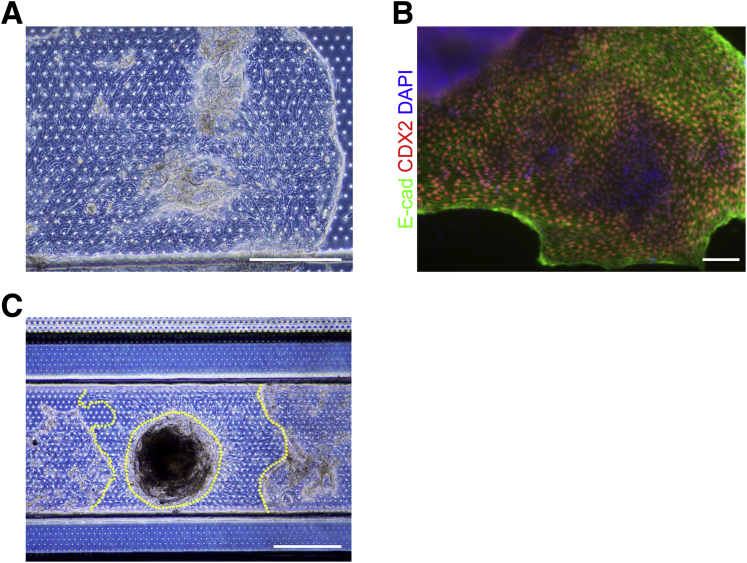
Results: The optimal cell seeding density and flow rate were established. The continuous administration of flow resulted in the formation of polarized intestinal folds that contained Paneth cells, goblet cells, enterocytes, and enteroendocrine cells along with transit-amplifying and LGR5+ stem cells. Administration of IFN-γ for 1 hour resulted in the phosphorylation of STAT1, whereas exposure for 3 days resulted in a significant upregulation of IFN-γ related genes. Administration of IFN-γ and tumor necrosis factor-α for 3 days resulted in an increase in intestinal permeability.

Conclusions: We demonstrate that the Intestine-Chip is polarized, contains all the intestinal epithelial subtypes, and is biologically responsive to exogenous stimuli. This represents a more amenable platform to use organoid technology and will be highly applicable to personalized medicine and a wide range of gastrointestinal conditions.

Keywords: GBP1, guanylate binding protein 1; HIOs, human intestinal organoids; Human Intestinal Organoids; IDO1, indolamine 2,3-dioxygenase 1; IFN-γ, interferon-γ; Induced Pluripotent Stem Cells; PDMS, poly(dimethylsiloxane); Small Microengineered Chips; TNF-α, tumor necrosis factor-α; iPSCs, induced pluripotent stem cells.


Figures

None
Graphical abstract
Figure 1
Figure 1
(A) Schematic of workflow for incorporation of iPSC-derived HIOs into the Intestine-Chip. Scale bar = 200 μm. (B) Representative images showing polarized HIOs immunopositive for E-cadherin (red) and ZO-1 (green), and HIOs immunopositive for E-cadherin/CDH1 (red), CDX2 (gray), and vimentin (green) all counterstained with DAPI (blue). Scale bar = 50 μm. (C) Schematic of the small microengineered Chip used in this study. (D) HIO-epithelial cells ranging in concentrations from 2.5–7.5 × 106 cells/mL were seeded into the Chip and representative phase contrast images were obtained after 24 hours. Yellow lines denote areas of the Chip not covered by HIO-derived epithelial cells. Scale bar = 200 μm. (E) HIO-epithelial cells were seeded at 6.25 × 106 cells/mL into the Intestine-Chip and E-cadherin/CDH1+ cells (red) counterstained with DAPI (blue) were imaged 3 days later. Images were stitched together to show a fully confluent monolayer of intestinal epithelial cells along the entire channel of the Chip. Scale bar = 1 mm.
Figure 2
Figure 2
(A) Representative phase contrast image of HIO-derived epithelial cells seeded into the Chip. Cells were exposed to continuous media flow at 30 μL/h and imaged after 0, 3, 5, and 7 days. Static Chip was imaged after 7 days. Scale bar = 200 μm. (B) Stitched phase contrast image of HIO-epithelial cells that were exposed to continual media flow at 30 μL/h for 5 days. Scale bar = 1 mm. (C) Representative brightfield image of cross-section of Chip that was exposed to continual media flow at 30 μL/h for 14 days. Scale bar = 250 μm. Representative fluorescent images showing (D) E-cadherin/CDH1 (red), ZO-1 (green), DAPI (blue), and (E) E-cadherin (blue), CDX2 (red), and Villin (green), in cross-section of Chip under conditions similar to C. Both scale bars = 50 μm. (F) Representative fluorescent images showing E-cadherin/CDH1 (red), and MUC2, lysozyme, FABP2, and chromogranin A (all green), counterstained with DAPI (blue), in cross-section of Chips that were exposed to continual media flow at 30 μL/h for 7 days. Scale bar = 10 μm. (G) Representative images of in situ hybridization for LGR5+ and WDR43+ (white arrows) in conditions similar to F. Scale bar = 10 μm. (H) Representative fluorescent image showing E-cadherin/CDH1 (blue), Ki67 (green), and DAPI (blue) in conditions similar to F. Scale bar = 100 μm. Graph shows percent Ki67+ nuclei per section.
Figure 3
Figure 3
(A) Western blot analyses and quantification of phosphorylation of STAT1 in Chips containing either HIO-derived intestinal epithelial or Caco2 cells in response to exposure of increasing concentrations (0–1000 ng/mL) of IFN-γ in the lower channel for 1 hour. Glyceraldehyde-3-phosphate dehydrogenase and STAT1 were used as loading controls. Image J analysis was used to quantify levels of phospho-STAT1 compared with glyceraldehyde-3-phosphate dehydrogenase. (B) Quantitative reverse-transcription polymerase chain reaction analyses of IDO1 and GBP1 and (C) PLA2G2A, MUC4, and LYZ in Chips incorporating either HIO-derived epithelial or Caco-2 cells in response to exposure of 10 ng/mL of IFN-γ in the lower channel for 3 days. Three independent experiments were carried out; data represent mean ± SEM; *P < .05, **P < .01 compared with respective untreated controls. (D) Area under the curve of fluorescein isothiocyanate–dextran 4 kDa permeation over 6 hours was statistically higher (P < .01) in Intestine-Chip treated with IFN-γ and TNF-α compared with untreated. (E) Following the permeability studies, MTS cytotoxicity assay was carried out and showed no statistical difference between Intestine-Chips treated with IFN-γ and TNF-α or untreated. Two independent experiments were carried out; data represent mean ± SEM. **P < .01. AUC, area under the curve; CTL, control; GAPDH, glyceraldehyde-3-phosphate dehydrogenase.
Supplementary Figure 1
(A) Phase contrast image (scale bar = 500 μm) and (B) fluorescent image (scale bar = 100 μm) showing E-cadherin/CDH1 (green), CDX2 (red), counterstained with DAPI (blue) of intact HIO that was incorporated into the Chip and imaged 3 days later. (C) Phase contrast image showing epithelial and mesenchymal cells that arose from intact HIOs that were incorporated into the Chip and imaged 4 days later. Yellow dotted lines represent mesenchymal cells in Chip. Scale bar = 500 μm.
Supplementary Figure 2
Representative phase contrast images of HIO-derived epithelial cells seeded into the chip. Cells were exposed to continuous media flow of 60 μL/h and imaged after 0, 3, 5, and 7 days. Scale bar = 200 μm.
Supplementary Figure 3
Representative fluorescent images showing E-cadherin (gray), CDX2 (red), and MUC2, lysozyme, FABP2, and chromogranin A (all green) in cross-section of Chips incorporating Caco-2 cells that were exposed to continual media flow of 30 μL/h and imaged after 8 days. Scale bar = 50 μm.

References

    1. Strater J., Wedding U., Barth T.F., Koretz K., Elsing C., Moller P. Rapid onset of apoptosis in vitro follows disruption of beta 1-integrin/matrix interactions in human colonic crypt cells. Gastroenterology. 1996;110:1776–1784. - PubMed
    1. Grossmann J., Mohr S., Lapentina E.G., Fiocchi C., Levine A.D. Sequential and rapid activation of select caspases during apoptosis of normal intestinal epithelial cells. Am Physiol. 1998;274(6 Pt 1):G1117–G1124. - PubMed
    1. Sato T., Stange D.E., Ferrante M., Vries R.G., Van Es J.H., Van den Brink S., Van Houdt W.J., Pronk A., Van Gorp J., Siersema P.D., Clevers H. Long-term expansion of epithelial organoids from human colon, adenoma, adenocarcinoma, and Barrett's epithelium. Gastroenterology. 2011;141:1762–1772. - PubMed
    1. VanDussen K.L., Marinshaw J.M., Shaikh N., Miyoshi H., Moon C., Tarr P.I., Ciorba M.A., Stappenbeck T.S. Development of an enhanced human gastrointestinal epithelial culture system to facilitate patient-based assays. Gut. 2015;64:911–920. - PMC - PubMed
    1. Spence J.R., Mayhew C.N., Rankin S.A., Kuhar M.F., Vallance J.E., Tolle K., Hoskins E.E., Kalinichenko V.V., Wells S.I., Zorn A.M., Shroyer N.F., Wells J.M. Directed differentiation of human pluripotent stem cells into intestinal tissue in vitro. Nature. 2011;470:105–109. - PMC - PubMed