. 2018 Jul 10;18(14):2124-2133.
doi: 10.1039/c8lc00196k.

An acoustofluidic trap and transfer approach for organizing a high density single cell array

Affiliations

An acoustofluidic trap and transfer approach for organizing a high density single cell array

Korine A Ohiri et al. Lab Chip. .

Abstract

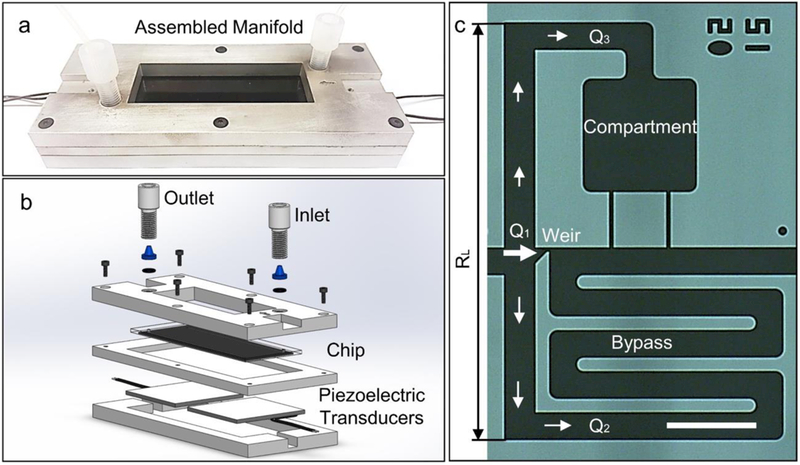
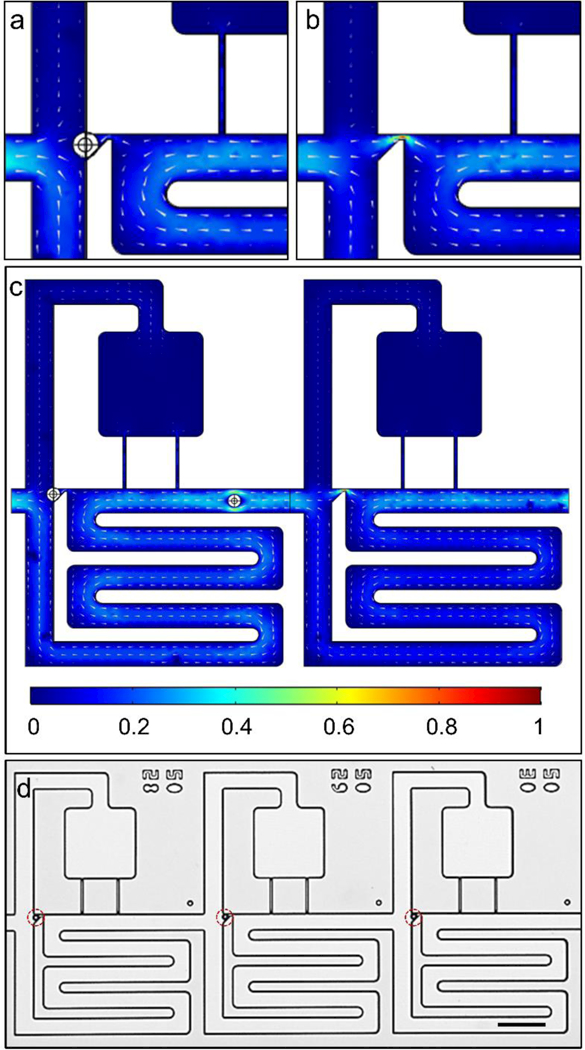
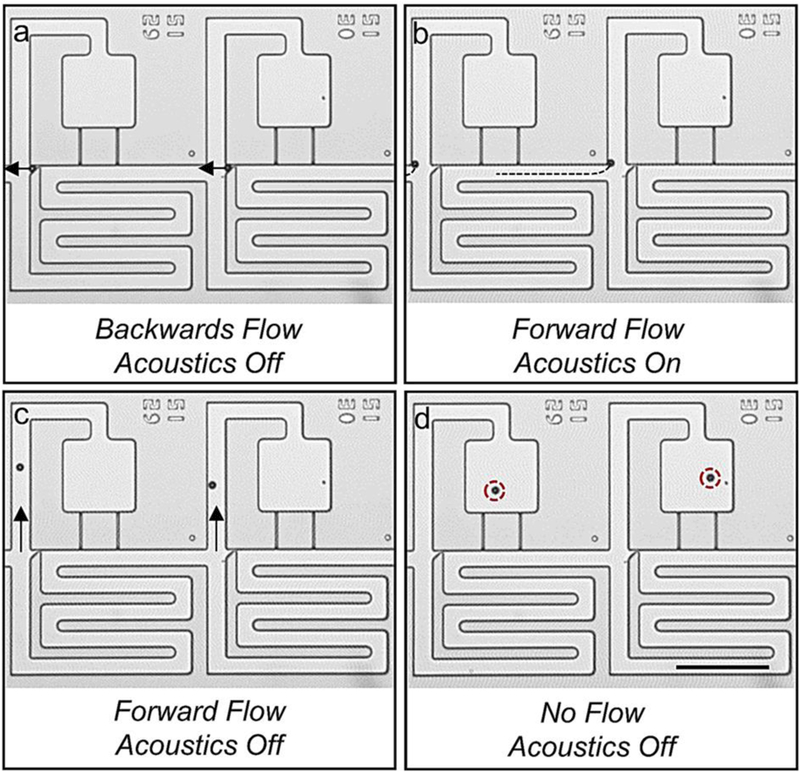
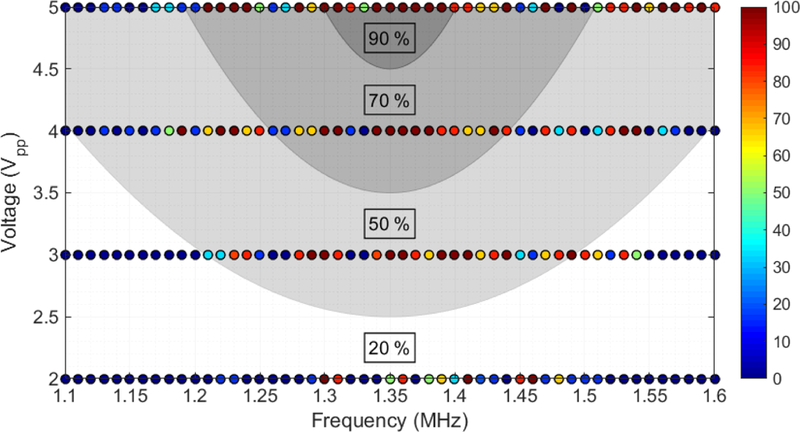
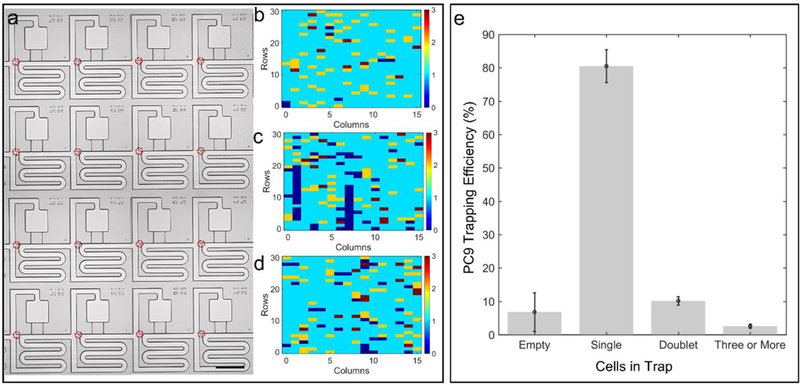
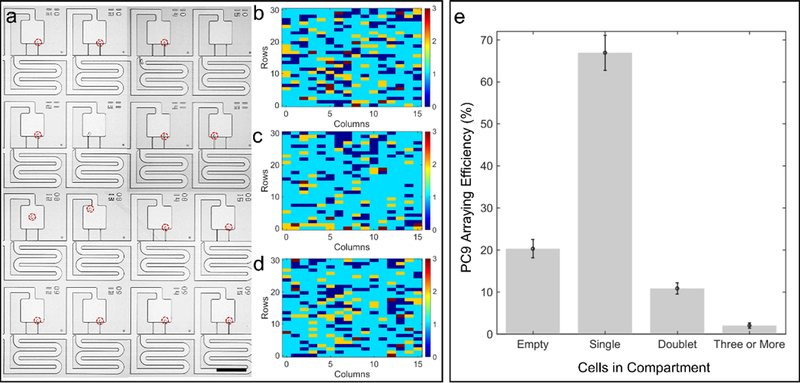
We demonstrate a hybrid microfluidic system that combines fluidic trapping and acoustic switching to organize an array of single cells at high density. The fluidic trapping step is achieved by balancing the hydrodynamic resistances of three parallel channel segments forming a microfluidic trifurcation, the purpose of which was to capture single cells in a high-density array. Next, the cells were transferred into adjacent larger compartments by generating an array of streaming micro-vortices to move the cells to the desired streamlines in a massively parallel format. This approach can compartmentalize single cells with efficiencies of ≈67% in compartments that have diameters on the order of ∼100 um, which is an appropriate size for single cell proliferation studies and other single cell biochemical measurements.


Figures

Figure 1.
Figure 1.
Acoustofluidic single cell array. (a) Image of chip in the aluminum manifold. (b) Schematic of entire set-up indicating the location of the chip, inlet, outlet, and piezoelectric transducers. Here, the piezoelectric transducers were acoustically coupled to the microfluidic chip using electrode gel (see Materials and Methods for more details).” (c) Image of individual acoustofluidic element with characteristic length (RL) and comprised of a weir (1), bypass (2), and compartment region (3). Scale bar indicates 100 μm.
Figure 2.
Figure 2.
Demonstration of hydrodynamic trapping in trifurcation design. COMSOL simulation of an (a) occluded weir, (b) unoccupied weir, and (c) the entire acoustofluidic element. (d) Beads captured in trap sites of acoustofluidic array. Legend indicates normalized velocity and scale bar represents 100 μm.
Figure 3.
Figure 3.
Image sequence detailing the acoustic switching mechanism. (a) Beads are captured in weirs using an oscillatory pressure profile. Once each site is occupied, beads are unloaded from weirs using backward flow. (b) Beads are slowly propelled towards the trifurcation junction (their paths are indicated by the dotted lines) using positive pressure and are acoustically trapped at the leading corner of the compartment region. (c) Beads are flowed into the compartment region. (d) Beads are loaded in the compartment region. Scale bar indicates 200 μm.
Figure 4.
Figure 4.
Color plot of switching efficiencies of polystyrene beads onto the leading corners of the compartment region upon acoustic excitation (n=6 compartments). Shaded regions indicate average switching efficiencies over the specified range.
Figure 5.
Figure 5.
(a) Red fluorescent image of nanoparticles under acoustic excitation at 1.4 MHz and 5 Vpp. (b) Normalized velocity magnitudes of 8.5 μm polystyrene beads approaching the entrance corner of the compartment region. Here, the dashed circles indicate the outline of the bead (or cell) at its final position. Scale bar indicates 100 μm.
Figure 6.
Figure 6.
(a) Trajectories of 8.5 μm polystyrene beads approaching the entrance corner of the compartment region. (b) Plot of maximum force before contact versus voltage. R2 = 0.9656.
Figure 7.
Figure 7.
Trapping efficiency for PC9 cells in the weirs of the trifurcation. (a) Representative image of trapped cells. Number of cells captured in individual trap sites for trial (b) one, (c) two, and (d) three. (e) Distribution of cells in n = 3 acoustofluidic chips. Scale bar indicates 200 μm.
Figure 8.
Figure 8.
Arraying efficiency for PC9 cells in the compartment region of the trifurcation. (a) Representative image of arrayed cells. Number of cells captured in individual array sites for trial (b) one, (c) two, and (d) three. (e) Distribution of cells in n = 3 acoustofluidic chips. Scale bar indicates 200 μm.

References

    1. Elowitz MB, Levine AJ, Siggia ED and Swain PS, Science, 2002, 297, 1183–1186. - PubMed
    1. Shalek AK, Satija R, Shuga J, Trombetta JJ, Gennert D, Lu D, Chen P, Gertner RS, Gaublomme JT, Yosef N, Schwartz S, Fowler B, Weaver S, Wang J, Wang X, Ding R, Raychowdhury R, Friedman N, Hacohen N, Park H, May AP and Regev A, Nature, 2014, 510, 363–369. - PMC - PubMed
    1. Kalisky T and Quake SR, Nat Methods, 2011, 8, 311–314. - PubMed
    1. Shalek AK and Benson M, Sci Transl Med, 2017, 9. - PMC - PubMed
    1. Vallejos CA, Risso D, Scialdone A, Dudoit S and Marioni JC, Nature Methods, 2017, 14, 565–571. - PMC - PubMed

Publication types

LinkOut - more resources