Adult Glioma Incidence and Survival by Race or Ethnicity in the United States From 2000 to 2014
- PMID: 29931168
- PMCID: PMC6143018
- DOI: 10.1001/jamaoncol.2018.1789
Adult Glioma Incidence and Survival by Race or Ethnicity in the United States From 2000 to 2014
Abstract
Importance: Glioma is the most commonly occurring malignant brain tumor in the United States, and its incidence varies by age, sex, and race or ethnicity. Survival after brain tumor diagnosis has been shown to vary by these factors.
Objective: To quantify the differences in incidence and survival rates of glioma in adults by race or ethnicity.
Design, setting, and participants: This population-based study obtained incidence data from the Central Brain Tumor Registry of the United States and survival data from Surveillance, Epidemiology, and End Results registries, covering the period January 1, 2000, to December 31, 2014. Average annual age-adjusted incidence rates with 95% CIs were generated by glioma histologic groups, race, Hispanic ethnicity, sex, and age groups. One-year and 5-year relative survival rates were generated by glioma histologic groups, race, Hispanic ethnicity, and insurance status. The analysis included 244 808 patients with glioma diagnosed in adults aged 18 years or older. Data were collected from January 1, 2000, to December 31, 2014. Data analysis took place from December 11, 2017, to January 31, 2018.
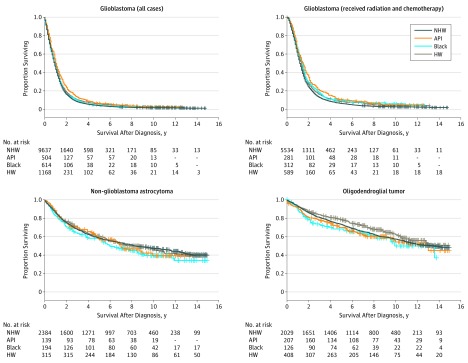
Results: Overall, 244 808 patients with glioma were analyzed. Of these, 150 631 (61.5%) were glioblastomas, 46 002 (18.8%) were non-glioblastoma astrocytomas, 26 068 (10.7%) were oligodendroglial tumors, 8816 (3.6%) were ependymomas, and 13 291 (5.4%) were other glioma diagnoses in adults. The data set included 137 733 males (56.3%) and 107 075 (43.7%) females. There were 204 580 non-Hispanic whites (83.6%), 17 321 Hispanic whites (7.08%), 14 566 blacks (6.0%), 1070 American Indians or Alaska Natives (0.4%), and 5947 Asians or Pacific Islanders (2.4%). Incidences of glioblastoma, non-glioblastoma astrocytoma, and oligodendroglial tumors were higher among non-Hispanic whites than among Hispanic whites (30% lower overall), blacks (52% lower overall), American Indians or Alaska Natives (58% lower overall), or Asians or Pacific Islanders (52% lower overall). Most tumors were more common in males than in females across all race or ethnicity groups, with the great difference in glioblastoma where the incidence was 60% higher overall in males. Most tumors (193 329 [79.9%]) occurred in those aged 45 years or older, with differences in incidence by race or ethnicity appearing in all age groups. Survival after diagnosis of glioma of different subtypes was generally comparable among Hispanic whites, blacks, and Asians or Pacific Islanders but was lower among non-Hispanic whites for many tumor types, including glioblastoma, irrespective of treatment type.
Conclusions and relevance: Incidence of glioma and 1-year and 5-year survival rates after diagnosis vary significantly by race or ethnicity, with non-Hispanic whites having higher incidence and lower survival rates compared with individuals of other racial or ethnic groups. These findings can inform future discovery of risk factors and reveal unaddressed health disparities.
Conflict of interest statement
Figures

References
-
- Lacroix M, Abi-Said D, Fourney DR, et al. A multivariate analysis of 416 patients with glioblastoma multiforme: prognosis, extent of resection, and survival. J Neurosurg. 2001;95(2):190-198. - PubMed
-
- National Cancer Institute. DevCan—Probability of developing or dying of cancer. https://surveillance.cancer.gov/devcan/. Accessed January 31, 2018.
-
- Curry WT Jr, Carter BS, Barker FG II. Racial, ethnic, and socioeconomic disparities in patient outcomes after craniotomy for tumor in adult patients in the United States, 1988-2004. Neurosurgery. 2010;66(3):427-437. - PubMed
MeSH terms
LinkOut - more resources
Full Text Sources
Other Literature Sources
Medical