. 2018 Sep 1;526(13):2048-2067.
doi: 10.1002/cne.24478. Epub 2018 Aug 22.

Asymmetric vasopressin signaling spatially organizes the master circadian clock

Affiliations

Asymmetric vasopressin signaling spatially organizes the master circadian clock

Joseph L Bedont et al. J Comp Neurol. .

Abstract

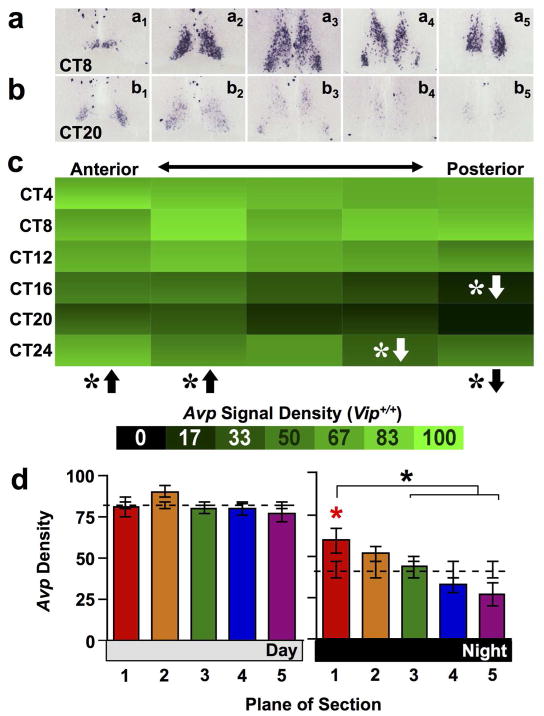
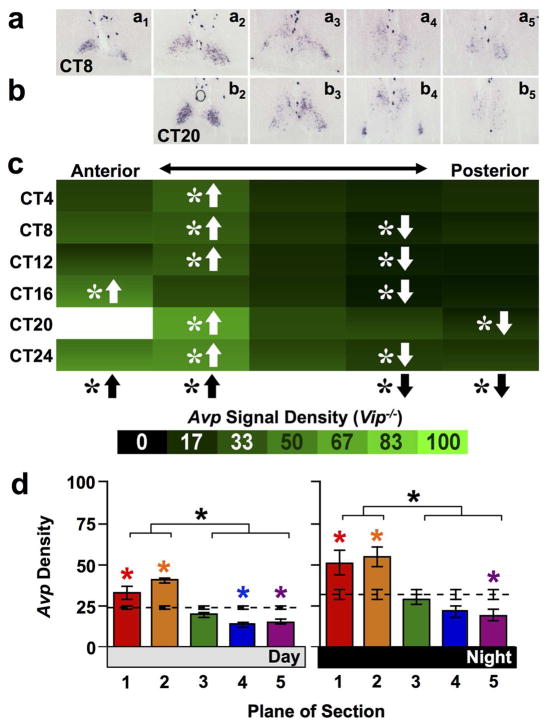
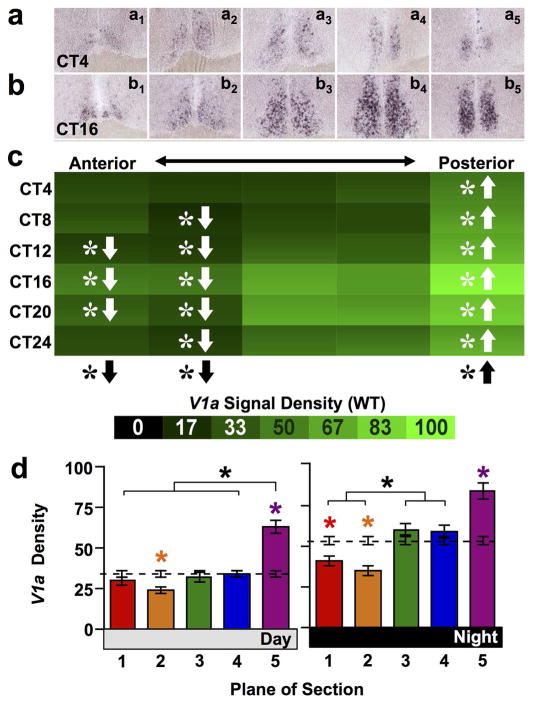
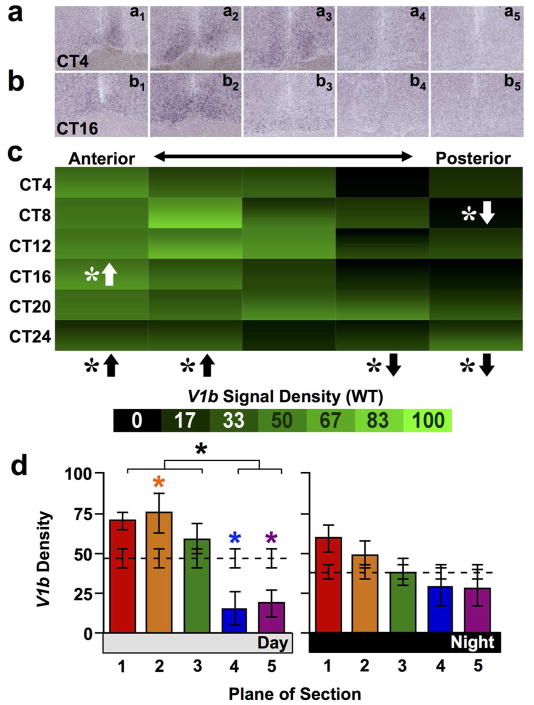
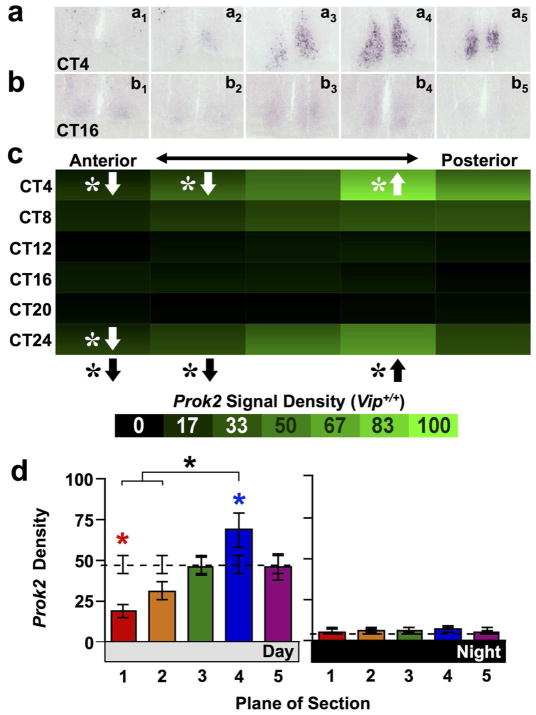
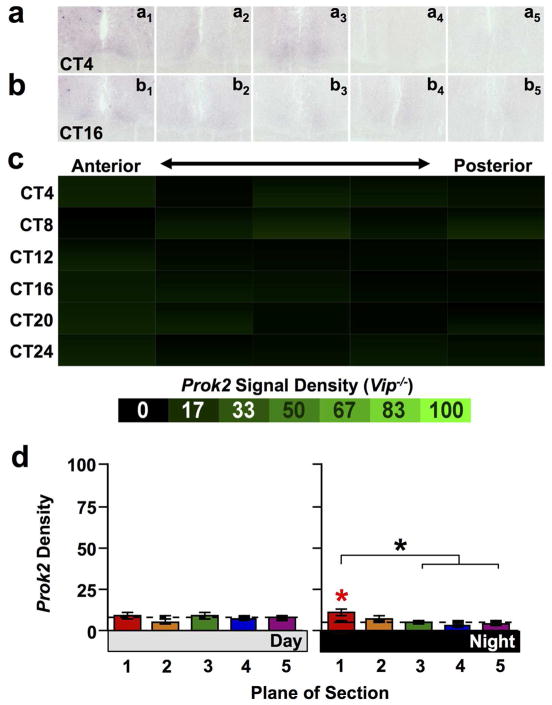
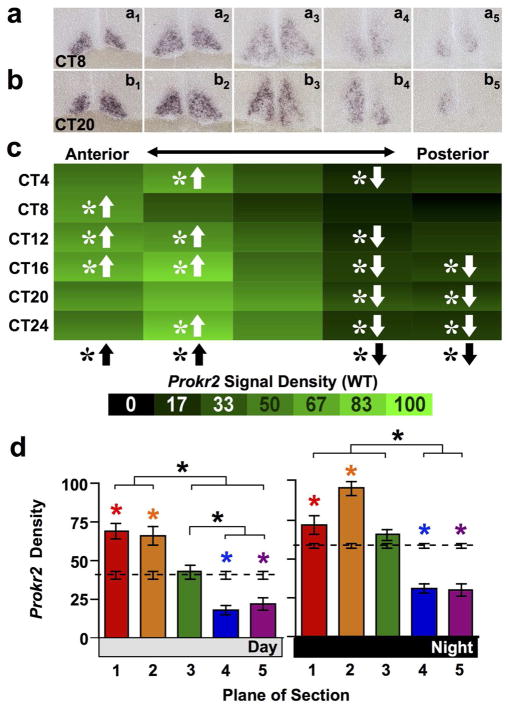
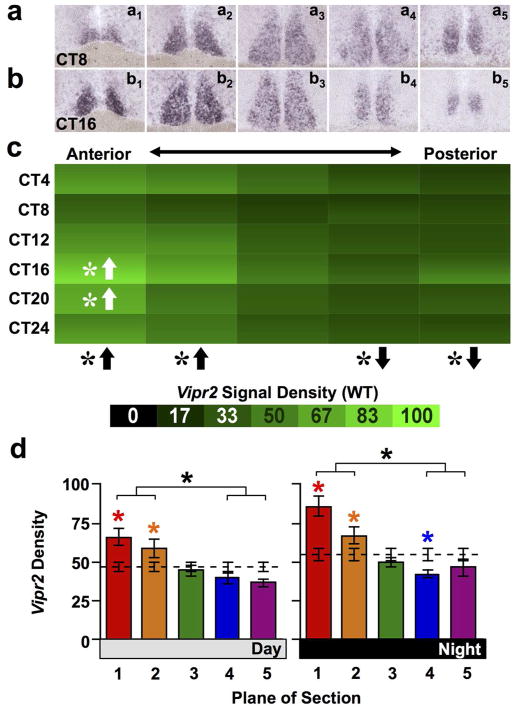
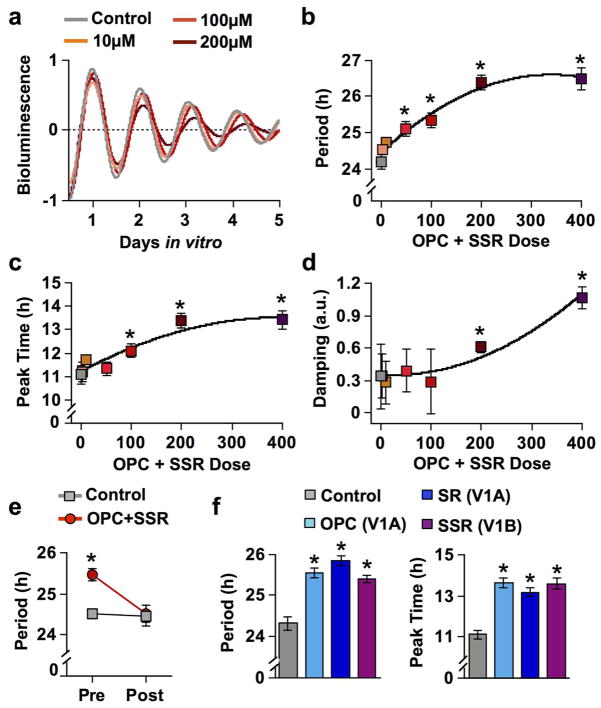
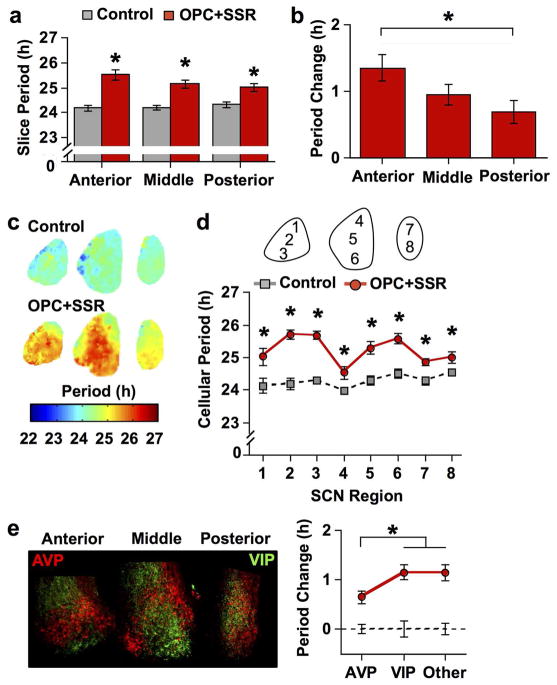
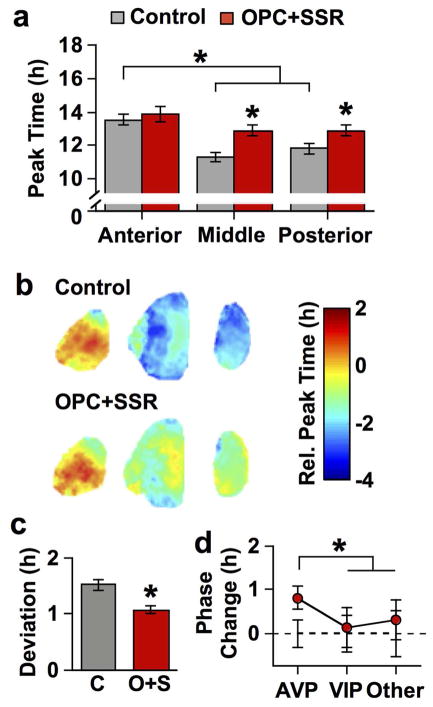
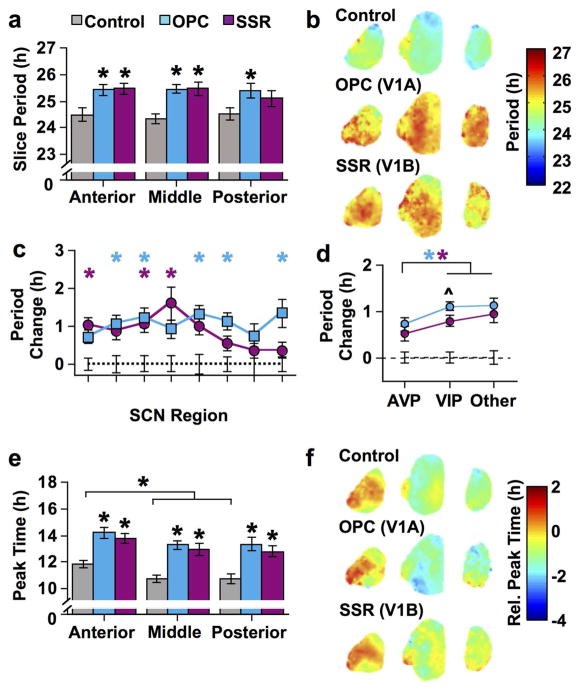
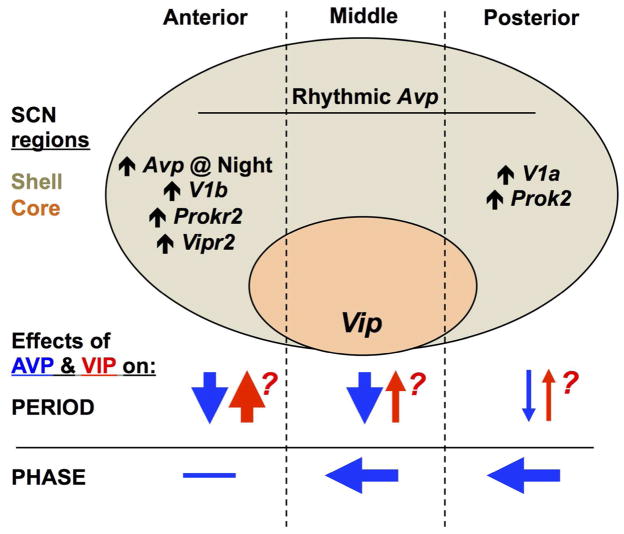
The suprachiasmatic nucleus (SCN) is the neural network that drives daily rhythms in behavior and physiology. The SCN encodes environmental changes through the phasing of cellular rhythms across its anteroposterior axis, but it remains unknown what signaling mechanisms regulate clock function along this axis. Here we demonstrate that arginine vasopressin (AVP) signaling organizes the SCN into distinct anteroposterior domains. Spatial mapping of SCN gene expression using in situ hybridization delineated anterior and posterior domains for AVP signaling components, including complementary patterns of V1a and V1b expression that suggest different roles for these two AVP receptors. Similarly, anteroposterior patterning of transcripts involved in Vasoactive Intestinal Polypeptide- and Prokineticin2 signaling was evident across the SCN. Using bioluminescence imaging, we then revealed that inhibiting V1A and V1B signaling alters period and phase differentially along the anteroposterior SCN. V1 antagonism lengthened period the most in the anterior SCN, whereas changes in phase were largest in the posterior SCN. Further, separately antagonizing V1A and V1B signaling modulated SCN function in a manner that mapped onto anteroposterior expression patterns. Lastly, V1 antagonism influenced SCN period and phase along the dorsoventral axis, complementing effects on the anteroposterior axis. Together, these results indicate that AVP signaling modulates SCN period and phase in a spatially specific manner, which is expected to influence how the master clock interacts with downstream tissues and responds to environmental changes. More generally, we reveal anteroposterior asymmetry in neuropeptide signaling as a recurrent organizational motif that likely influences neural computations in the SCN clock network.

Keywords: RRID: AB_2313978; RRID: AB_2340474; RRID: AB_2556546; RRID: AB_518682; RRID: IMSR_JAX:006852; anteroposterior; circadian; spatiotemporal; suprachiasmatic; vasopressin.


Figures

Figure 1
Figure 1. Avp expression across the anteroposterior SCN in wild type mice
a–b) Representative slices illustrating Avp expression across the anteroposterior SCN in wild type mice. Subscript indicates plane of section from Plane 1 (most anterior) to Plane 5 (most posterior). Images for each circadian time (CT) illustrate the times of peak and trough expression. c) Heat maps illustrating temporal patterns of Avp expression for each plane of section 1–5, corresponding to plane of section in the raw images immediately above (n = 3 slices per circadian time point for each plane). For each cell, variance is encoded as a vertical color gradient depicting +/− SEM. White asterisks with directional arrows indicate that Avp expression in that plane of section was higher (up arrow) or lower (down arrow) density relative to the Whole SCN at that circadian time point. LSM Contrasts: * p < 0.01. Black asterisks with directional arrows below heat maps indicate that Avp expression in that plane of section differed from Whole SCN across the 24-hour cycle overall. LSM Contrasts: * p < 0.05. d) Normalized Avp expression (Mean ± SEM) during subjective day (CT04-CT12) and subjective night (CT16-24) across the anteroposterior SCN (n = 9 slices per time bin per plane). Dashed line indicates average density for the Whole SCN. Asterisks with brackets indicate differences among SCN planes- Tukey’s HSD, * p < 0.05. Asterisks located immediately above bars (color-coded in online version) indicate SCN planes that differ from Whole SCN- LSM Contrasts * p < 0.01.
Figure 2
Figure 2. Avp expression across the anteroposterior SCN in Vip−/− mice
a–b) Representative slices illustrating Avp expression in Vip−/− mice. c) Heat maps illustrating temporal patterns of Avp expression, with density values of Vip−/− SCN normalized to peak values in wild type SCN to facilitate genotype comparisons. n = 3 slices per circadian time point (except CT20 Plane 1, n = 1 slice). d) Normalized Avp expression (Mean ± SEM) during subjective day (CT04-CT12) and subjective night (CT16-24) across the anteroposterior SCN. n = 7–9 slices per Day/Night time point for each plane. Other conventions as in Figure 1.
Figure 3
Figure 3. V1a expression across the anteroposterior SCN in wild type mice
a–b) Representative slices illustrating V1a expression. c) Heat maps illustrating temporal patterns of V1a expression. n = 3–4 slices per circadian time point for each plane. d) Normalized V1a expression (Mean ± SEM) during subjective day (CT04-CT12) and subjective night (CT16-24) across the anteroposterior SCN. n = 11–12 slices per group per plane. Other conventions as in Figure 1.
Figure 4
Figure 4. V1b expression across the anteroposterior SCN in wild type mice
a–b) Representative slices illustrating V1b expression. c) Heat maps illustrating temporal patterns of V1a expression. n = 3–4 slices per circadian time point for each plane. d) Normalized V1a expression (Mean ± SEM) during subjective day (CT04-CT12) and subjective night (CT16-24) across the anteroposterior SCN. n = 11–12 slices per group per plane. Other conventions as in Figure 1.
Figure 5
Figure 5. Prok2 expression across the anteroposterior SCN in wild type mice
a–b) Representative slices illustrating Prok2 expression. c) Heat maps illustrating temporal patterns of V1a expression. n = 3 slices per circadian time point for each plane. d) Normalized V1a expression (Mean ± SEM) during subjective day (CT00-CT08) and subjective night (CT12-CT20) across the anteroposterior SCN. n = 9 slices per group per plane. Other conventions as in Figure 1.
Figure 6
Figure 6. Prok2 expression across the anteroposterior SCN in Vip−/− mice
a–b) Representative slices illustrating Prok2 expression. c) Heat maps illustrating temporal patterns of V1a expression. n = 3 slices per circadian time point for each plane. d) Normalized V1a expression (Mean ± SEM) during subjective day (CT00-CT08) and subjective night (CT12-CT20) across the anteroposterior SCN. n = 9 slices per group per plane. Other conventions as in Figure 1.
Figure 7
Figure 7. Prokr2 expression across the anteroposterior SCN in wild type mice
a–b) Representative slices illustrating Prokr2 expression. c) Heat maps illustrating temporal patterns of V1a expression. n = 3–4 slices per circadian time point for each plane. d) Normalized V1a expression (Mean ± SEM) during subjective day (CT04-CT12) and subjective night (CT16-24) across the anteroposterior SCN. n = 11–12 slices per group per plane. Other conventions as in Figure 1.
Figure 8
Figure 8. Vipr2 expression across the anteroposterior SCN in wild type mice
a–b) Representative slices illustrating Vipr2 expression. c) Heat maps illustrating temporal patterns of V1a expression. n = 3–4 slices per circadian time point for each plane. d) Normalized V1a expression (Mean ± SEM) during subjective day (CT04-CT12) and subjective night (CT16-CT24) across the anteroposterior SCN. n = 11–12 slices per group per plane. Other conventions as in Figure 1.
Figure 9
Figure 9. V1 antagonism lengthens SCN period and delays phase in a dose-dependent manner
a) PER2::LUC rhythms of SCN slices at different doses of OPC+SSR. b) Dose response curve of average period length (± SEM) of SCN slices in vitro. c) Dose response curve for average ZT peak time (± SEM) of SCN slices in vitro. d) Dose response curve for rhythm damping (± SEM) in SCN slices in vitro. e) Period length of SCN slices cultured with 100μM OPC+SSR or vehicle control before (pre) and after (post) medium exchange to washout drugs. f) Period length and peak time of SCN slices cultured with vehicle control or 100μM single receptor antagonists: OPC (V1A), SR (V1A), or SSR (V1B). LSM Contrasts *p < 0.01 different from control; n = 4–9 slices per group. Note that small error bars may be obscured by symbols.
Figure 10
Figure 10. V1 antagonism lengthens SCN period in a region-dependent manner
a) Average period length (± SEM) in vitro of SCN slices collected from three anteroposterior positions. b) Average change in cellular period (± SEM) relative to control conditions (line at 0) across anteroposterior positions. c) Period maps (color-coded in online version) illustrating regional effects of V1 antagonism. d) Average period length (± SEM) of cellular rhythms in different SCN regions. e) Magnitude of the period lengthening across neurochemically-distinct regions. Left: Representative images illustrating AVP- and VIP-immunoreactivity in cultured SCN slices (color-coded in online version). Note VIP+ neurons are located in the ventral region of the anterior and middle SCN slice, which can be distinguished from VIP+ fibers in other regions by the brighter, circular staining pattern. Right: Average change in cellular period (± SEM) relative to control conditions (dashed line at 0) across neuropeptide regions. Regions used for grouping are AVP: 1, 4, 7, 8; VIP: 3, 6; Other: 2, 5. For A–E) * p < 0.01, + p < 0.05, n = 7–8 slices per group for each plane. Note that small error bars may be obscured by symbols.
Figure 11
Figure 11. V1 antagonism alters SCN phase relationships by delaying phase in a region-specific manner
a) Average peak time (± SEM) on the first day in vitro normalized to the zeitgeber time (ZT) on the day of slice collection. b) Average phase maps for control and OPC+SSR anteroposterior SCN slices (color-coded in online version). c) Standard deviation of peak time displayed by SCN neurons across all three slices collected from each mouse. d) Average change in cellular phase (± SEM) relative to control conditions (dashed line at 0) across neurochemically-distinct regions. Regions used for each neurochemical group are AVP: 1, 4, 7, 8, Other: 2, 5, VIP: 3, 6. For A–E) * p < 0.01; +, p < 0.05; n = 7–8 slices per group for each plane. Note that small error bars may be obscured by symbols.
Figure 12
Figure 12. Signaling through V1A and V1B AVP receptors influences SCN period and phase
a) Average period (± SEM) in vitro of SCN slices. b) Average period maps for each group (color-coded in online version). c) Average change in cellular period (± SEM) relative to control conditions (dashed line at 0) in different SCN regions. d) Average change in cellular period (± SEM) relative to control conditions (dashed line at 0) across neurochemically-distinct regions. Regions used for each neurochemical group are AVP: 1, 4, 7, 8, Other: 2, 5, VIP: 3, 6. e) Average ZT peak time (± SEM) in vitro of SCN slices. f) Average phase maps for each group (color-coded in online version). For a & e) * p < 0.01; + p < 0.05. For c–d) * p < 0.01 different from control (color-coded in online version to represent specific antagonist group); ^ p < 0.01 difference between V1A and V1B antagonists; n = 7–8 slices per group for each plane. Note that small error bars may be obscured by symbols.
Figure 13
Figure 13. Model of the regionalized role of AVP in SCN period and phase computation
Schematic representation of the SCN network in the sagittal plane, with the location of the shell and core compartments illustrated and subdivided into anterior, middle, and posterior regions. Avp is rhythmically expressed throughout the SCN in wild type mice, but higher basal Avp expression and other region-specific patterns of gene expression for signaling transcripts are indicated where appropriate. Arrows below illustrate putative effects of AVP and VIP signaling on period and phase. Question marks alongside symbols for VIP signaling reflect the speculative nature of region-specific effects because it is unknown how VIP deficiency affects clock function across the anteroposterior SCN.

References

    1. Abrahamson EE, Moore RY. Suprachiasmatic nucleus in the mouse: Retinal innervation, intrinsic organization and efferent projections. Brain Res. 2001;916(1–2):172–191. - PubMed
    1. Albers HE, Liou SY, Stopa EG, Zoeller RT. Interaction of colocalized neuropeptides: Functional significance in the circadian timing system. J Neurosci. 1991;11(3):846–851. - PMC - PubMed
    1. An S, Tsai C, Ronecker J, Bayly A, Herzog ED. Spatiotemporal distribution of vasoactive intestinal polypeptide receptor 2 in mouse suprachiasmatic nucleus. J Comp Neurol. 2012;520(12):2730–2741. - PMC - PubMed
    1. Antle MC, Foley DK, Foley NC, Silver R. Gates and oscillators: A network model of the brain clock. J Biol Rhythms. 2003;18(4):339–350. - PMC - PubMed
    1. Aschoff J. Response curves in circadian periodicity. In: Aschoff J, editor. Circadian Clocks. Amsterdam: North Holland; 1965. pp. 95–111.

Publication types

MeSH terms

LinkOut - more resources