

A brain network model for depression: From symptom understanding to disease intervention
- PMID: 29931740
- PMCID: PMC6490158
- DOI: 10.1111/cns.12998
A brain network model for depression: From symptom understanding to disease intervention
Abstract
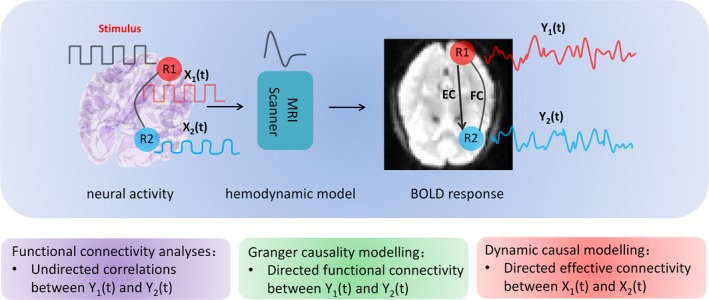
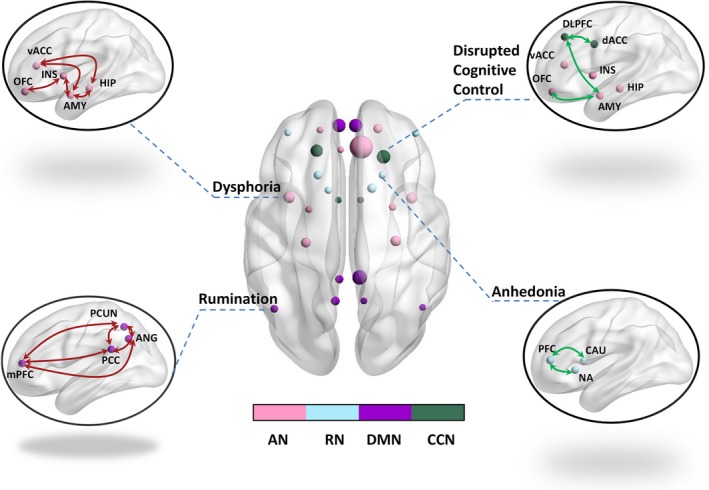
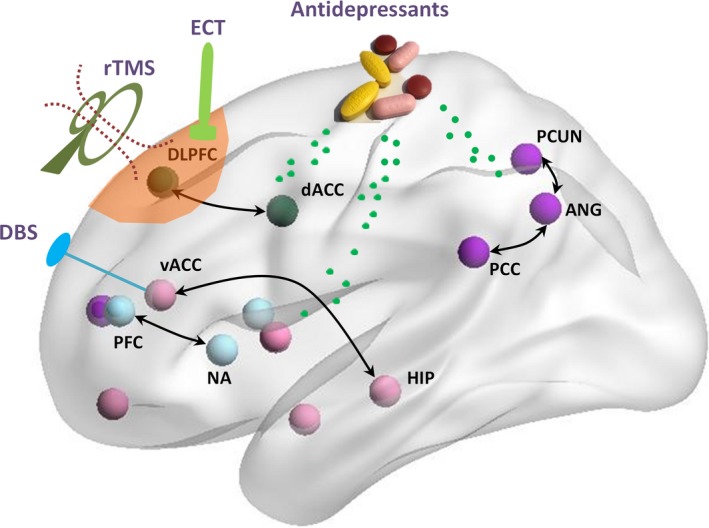
Understanding the neural substrates of depression is crucial for diagnosis and treatment. Here, we review recent studies of functional and effective connectivity in depression, in terms of functional integration in the brain. Findings from these studies, including our own, point to the involvement of at least four networks in patients with depression. Elevated connectivity of a ventral limbic affective network appears to be associated with excessive negative mood (dysphoria) in the patients; decreased connectivity of a frontal-striatal reward network has been suggested to account for loss of interest, motivation, and pleasure (anhedonia); enhanced default mode network connectivity seems to be associated with depressive rumination; and diminished connectivity of a dorsal cognitive control network is thought to underlie cognitive deficits especially ineffective top-down control of negative thoughts and emotions in depressed patients. Moreover, the restoration of connectivity of these networks-and corresponding symptom improvement-following antidepressant treatment (including medication, psychotherapy, and brain stimulation techniques) serves as evidence for the crucial role of these networks in the pathophysiology of depression.
Keywords: affective network; cognitive control network; default mode network; depression; reward network.
© 2018 John Wiley & Sons Ltd.
Figures
References
-
- Kruijshaar ME, Barendregt J, Vos T, et al. Lifetime prevalence estimates of major depression: an indirect estimation method and a quantification of recall bias. Eur J Epidemiol. 2005;20:103‐111. - PubMed
-
- Friston KJ, Frith CD, Frackowiak RSJ. Time‐dependent changes in effective connectivity measured with PET. Hum Brain Mapp. 1993a;1:69‐80.
-
- Friston KJ, Frith CD, Liddle PF, Frackowiak RS. Functional connectivity: the principal‐component analysis of large (PET) data sets. J Cereb Blood Flow Metab. 1993b;13:5‐14. - PubMed
-
- Friston KJ. Functional and effective connectivity in neuroimaging: a synthesis. Hum Brain Mapp. 1994;2:56‐78.
-
- Goebel R, Roebroeck A, Kim DS, Formisano E. Investigating directed cortical interactions in time‐resolved fMRI data using vector autoregressive modeling and Granger causality mapping. Magn Reson Imaging. 2003;21:1251‐1261. - PubMed
Publication types
MeSH terms
Grants and funding
LinkOut - more resources
Full Text Sources
Other Literature Sources
Medical
