. 2019 Feb;597(4):1073-1085.
doi: 10.1113/JP275810. Epub 2018 Aug 25.

Effects of living at moderate altitude on pulmonary vascular function and exercise capacity in mice with sickle cell anaemia

Affiliations

Effects of living at moderate altitude on pulmonary vascular function and exercise capacity in mice with sickle cell anaemia

Scott K Ferguson et al. J Physiol. 2019 Feb.

Abstract

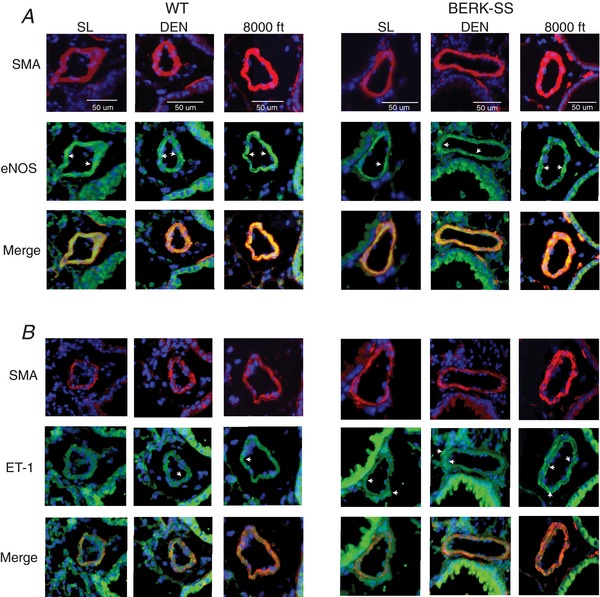
Key points: Sickle cell disease (SCD) results in cardiopulmonary dysfunction, which may be exacerbated by prolonged exposure to environmental hypoxia. It is currently unknown whether exposure to mild and moderate altitude exacerbates SCD associated cardiopulmonary and systemic complications. Three months of exposure to mild (1609 m) and moderate (2438 m) altitude increased rates of haemolysis and right ventricular systolic pressures in mice with SCD compared to healthy wild-type cohorts and SCD mice at sea level. The haemodynamic changes in SCD mice that had lived at mild and moderate altitude were accompanied by changes in the balance between pulmonary vascular endothelial nitric oxide synthase and endothelin receptor expression and impaired exercise tolerance. These data demonstrate that chronic altitude exposure exacerbates the complications associated with SCD and provides pertinent information for the clinical counselling of SCD patients.

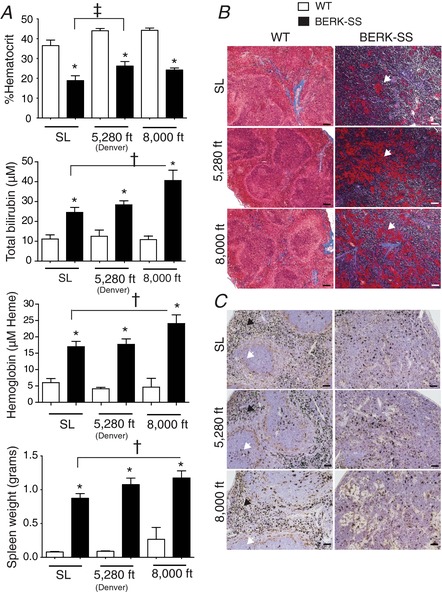
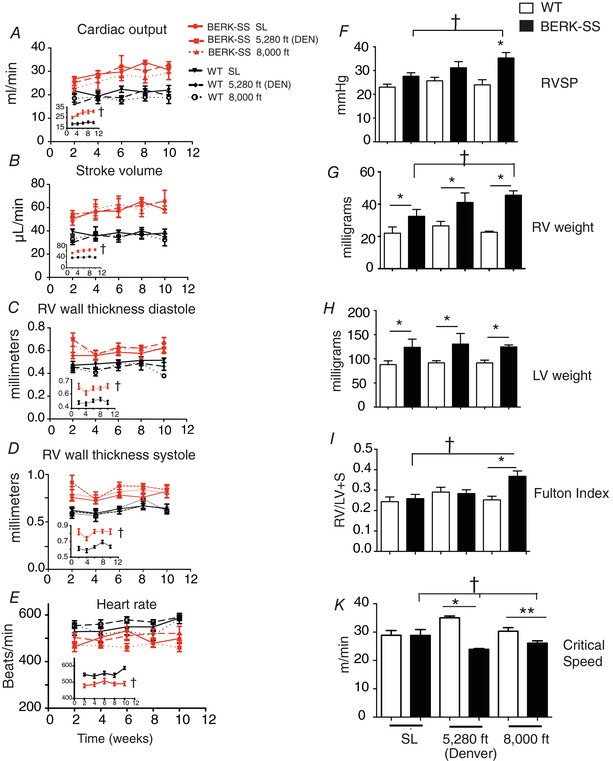
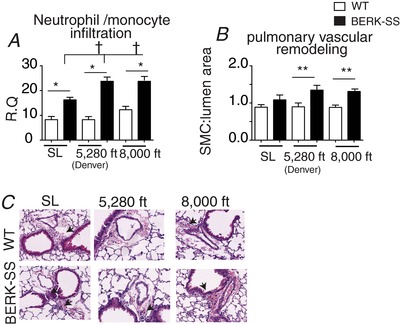
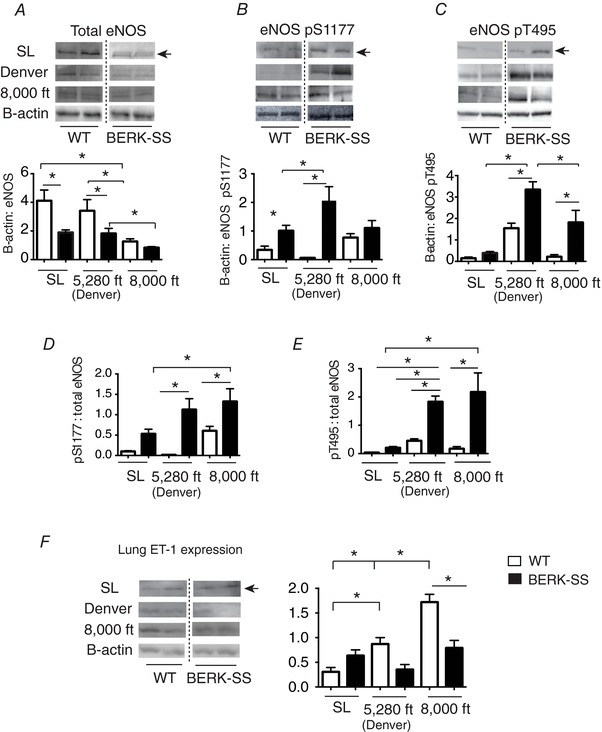
Abstract: Exposure to high altitude worsens symptoms and crises in patients with sickle cell disease (SCD). However, it remains unclear whether prolonged exposure to low barometric pressures exacerbates SCD aetiologies or impairs quality of life. We tested the hypothesis that, relative to wild-type (WT) mice, Berkley sickle cell mice (BERK-SS) residing at sea level, mild (1609 m) and moderate (2438 m) altitude would have a higher rate of haemolysis, impaired cardiac function and reduced exercise tolerance, and that the level of altitude would worsen these decrements. Following 3 months of altitude exposure, right ventricular systolic pressure was measured (solid-state transducer). In addition, the adaptive balance between pulmonary vascular endothelial nitric oxide synthase and endothelin was assessed in lung tissue to determine differences in pulmonary vascular adaptation and the speed/duration relationship (critical speed) was used to evaluate treadmill exercise tolerance. At all altitudes, BERK-SS mice had a significantly lower percentage haemocrit and higher total bilirubin and free haemoglobin concentration (P < 0.05 for all). right ventricular systolic pressures in BERK-SS were higher than WT at moderate altitude and also compared to BERK-SS at sea level (P < 0.05, for both). Critical speed was significantly lower in BERK-SS at mild and moderate altitude (P < 0.05). BERK-SS demonstrated exacerbated SCD complications and reduced exercise capacity associated with an increase in altitude. These results suggest that exposure to mild and moderate altitude enhances the progression of SCD in BERK-SS mice compared to healthy WT cohorts and BERK-SS mice at sea level and provides crucial information for the clinical counselling of SCD patients.

Keywords: BERK mouse; critical speed; hemolysis; hypoxia.


Figures

Figure 1
Figure 1. Hematologic responses
A, top: total %Hct for WT (open bars) and BERK‐SS mice (solid bars). * P < 0.0001 vs. WT. ‡P = 0.011 vs. BERK‐SS + sea level (n = 6–8). A, upper‐middle: total bilirubin for WT (open bars) and BERK‐SS mice (solid bars). * P < 0.001 vs. WT. †P = 0.026 vs. BERK‐SS + sea level (n = 6–8). A, lower‐middle: plasma haemoglobin concentrations for WT (open bars) vs. BERK‐SS mice (solid bars). * P < 0.0001 vs. WT. †P = 0.044 vs. BERK‐SS + sea level (n = 6–8). A, lower‐panel: spleen weights for WT (open bars) and BERK‐SS mice (solid bars). * P < 0.0001 vs. WT. †P = 0.031 vs. BERK‐SS + sea level (n = 6–8). B, Masson's Trichrome and fibrinogen staining of spleens from WT and BERK‐SS mice. White arrows show deposits of fibrinogen in collagen rich regions of the spleen red/white pulp. Magnification 10× (scale bar = 100 μm). C, Perls’ DAB iron staining of spleens from WT and BERK‐SS mice. White arrows show intact structures of the white pulp, whereas dark arrows show intact structure of the red pulp. Magnification 20× (scale bar = 50 μm). [Color figure can be viewed at wileyonlinelibrary.com]
Figure 2
Figure 2. Haemodynamic and ventricular characterization of pulmonary hypertension
AE, serial ECG of differences between WT (black lines) vs. BERK‐SS mice (red lines). Insets all WT groups combined vs. all BERK‐SS groups combined. †P < 0.0001 (n = 6–8). F, RVSP. * P < 0.01 BERK‐SS 8000 feet (solid bars) vs. WT mice (open bars) for all elevations (n = 6–8). †P < 0.01, BERK‐SS 8000 feet vs. Berk‐SS (sea level) (n = 6–8). G, RV weight. * P < 0.04 for BERK‐SS (solid bars) vs. WT mice (open bars) at each corresponding altitude. †P < 0.01 (n = 6–8) BERK‐SS 8000 feet vs. Berk‐SS (sea level). H, left ventricular weight. * P < 0.03 (n = 6–8) for BERK‐SS (solid bars) vs. WT mice (open bars) at each corresponding altitude. I, Fulton index. * P = 0.01 (n = 6–8) BERK‐SS vs. WT mice housed at 8000 feet. †P < 0.01 (n = 6–8) BERK‐SS mice housed at 8000 feet vs. BERK‐SS (solid bars) and WT mice (open bars) housed at sea level. J, CS. * P = 0.001 (n = 5) BERK‐SS (solid bars) vs. WT (open bars) housed at 5280 feet. ** P = 0.021 (n = 5) BERK SS (solid bars) vs. WT (open bars) housed at 8000 feet. †P ≤ 0.037 (n = 5) BERK‐SS housed at sea level vs. BERK‐SS housed at 5280 feet and 8000 feet. [Color figure can be viewed at wileyonlinelibrary.com]
Figure 3
Figure 3. Pulmonary artery remodelling
A, quantification of neutrophil / monocyte cells surrounding pulmonary arteries. * P < 0.001, BERK‐SS (solid bars) vs. WT mice (open bars). †P < 0.01 (n = 6–8) BERK‐SS (solid bars) housed at Denver and 8000 feet vs. BERK‐SS mice housed at sea level. B, quantification of medial hypertrophy in medium sized vessels (50–100 μm). ** P = 0.03 (n = 6–8) BERK‐SS (solid bars) housed at Denver and 8000 feet vs. WT cohorts (open bars). C, representative microphotographs of medium sized vessel (50 to 100 μm) stained for haemtoxylin and eosin (H&E). [Color figure can be viewed at wileyonlinelibrary.com]
Figure 4
Figure 4. eNOS and ET‐1 lung expression
A, total eNOS expression in BERK‐SS (solid bars) vs. WT mice (open bars). * P ≤ 0.03 (n = 6–8). B, phosphorylated serine 1177 (pS1177) eNOS in BERK‐SS (solid bars) vs. WT mice (open bars). * P ≤ 0.01, (n = 6–8). C, phosphorylated threonine 495 (pT495) eNOS in BERK‐SS (solid bars) vs. WT (open bars) P ≤ 0.012 (n = 6–8). D, ratio of pS1177 eNOS to total eNOS. * P ≤ 0.04 (n = 6–8). E, ratio of pT495 eNOS to total eNOS. * P ≤ 0.002 (n = 6–8). F, lung ET‐1 expression. * P ≤ 0.04 (n = 6–8).
Figure 5
Figure 5. Localization of lung eNOS and ET‐1 expression from a representative animal
Microphotographs of serial lung sections are from distal pulmonary arteries ∼50 μm in diameter showing (A) eNOS expression and (B) ET‐1 expression in resistant arteries. Images were originally captured at 20×. White arrows show areas of eNOS or ET‐1 expression. Red: smooth muscle actin (SMA). Green: eNOS or ET‐1. Blue: 4′,6‐diamidino‐2‐phenylindole. [Color figure can be viewed at wileyonlinelibrary.com]

Comment in

References

    1. Anthi A, Machado RF, Jison ML, Taveira‐DaSilva AM, Rubin LJ, Hunter L, Hunter CJ, Coles W, Nichols J & Avila NA (2007). Hemodynamic and functional assessment of patients with sickle cell disease and pulmonary hypertension. Am J Resp Crit Care Med 175, 1272–1279. - PMC - PubMed
    1. Bakeer N, James J, Roy S, Wansapura J, Shanmukhappa SK, Lorenz JN, Osinska H, Backer K, Huby AC, Shrestha A, Niss O, Fleck R, Quinn CT, Taylor MD, Purevjav E, Aronow BJ, Towbin JA & Malik P (2016). Sickle cell anemia mice develop a unique cardiomyopathy with restrictive physiology. Proc Natl Acad Sci U S A 113, E5182‐5191. - PMC - PubMed
    1. Barst RJ, Mubarak KK, Machado RF, Ataga KI, Benza RL, Castro O, Naeije R, Sood N, Swerdlow PS & Hildesheim M (2010). Exercise capacity and haemodynamics in patients with sickle cell disease with pulmonary hypertension treated with bosentan: results of the ASSET studies. Br J Haematol 149, 426–435. - PMC - PubMed
    1. Bourque sea level , Whittingham HA, Brien SE, Davidge ST & Adams MA (2012). Role of endothelin‐1 in the hyper‐responsiveness to nitrovasodilators following acute NOS inhibition. Br J Pharmacol 165, 1992–1999. - PMC - PubMed
    1. Buehler PW, Baek JH, Lisk C, Connor I, Sullivan S, Kominsky D, Majka S, Stenmark KR, Nozik‐Grayck E, Bonventura J & Irwin D (2012). Free hemolgobin induction of pulmonary vascular disease: evidence for and inflammatory mechanism. Am J Physiol Lung Cell Mol Physiol 303, 312–326. - PMC - PubMed

Publication types

LinkOut - more resources