

Mitochondrial-Localized Versus Cytosolic Intracellular CO-Releasing Organic PhotoCORMs: Evaluation of CO Effects Using Bioenergetics
- PMID: 29932318
- PMCID: PMC6117112
- DOI: 10.1021/acschembio.8b00387
Mitochondrial-Localized Versus Cytosolic Intracellular CO-Releasing Organic PhotoCORMs: Evaluation of CO Effects Using Bioenergetics
Abstract
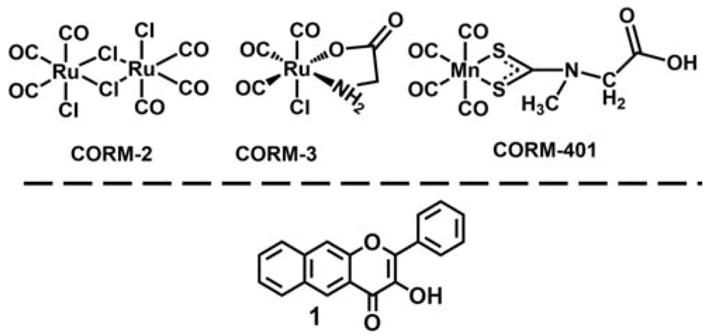
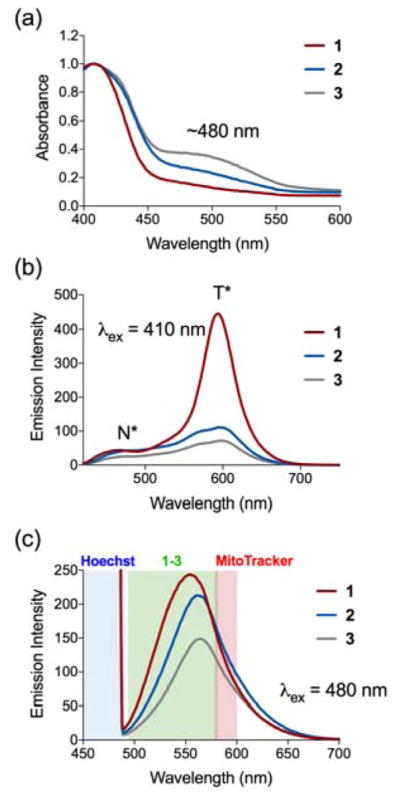
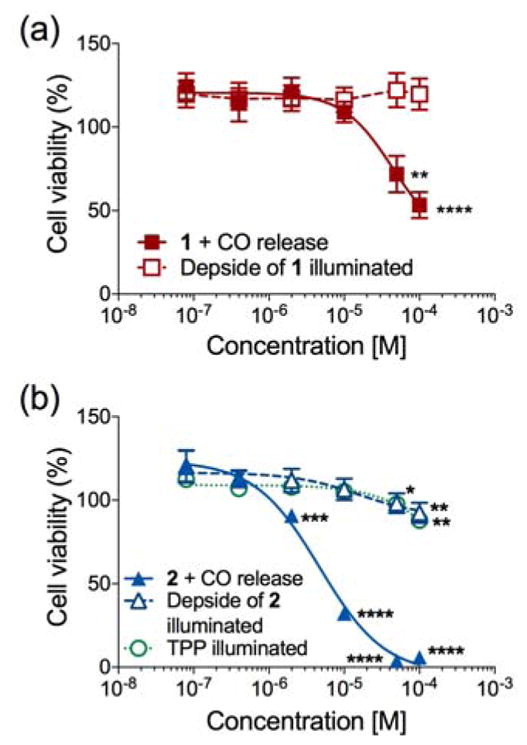
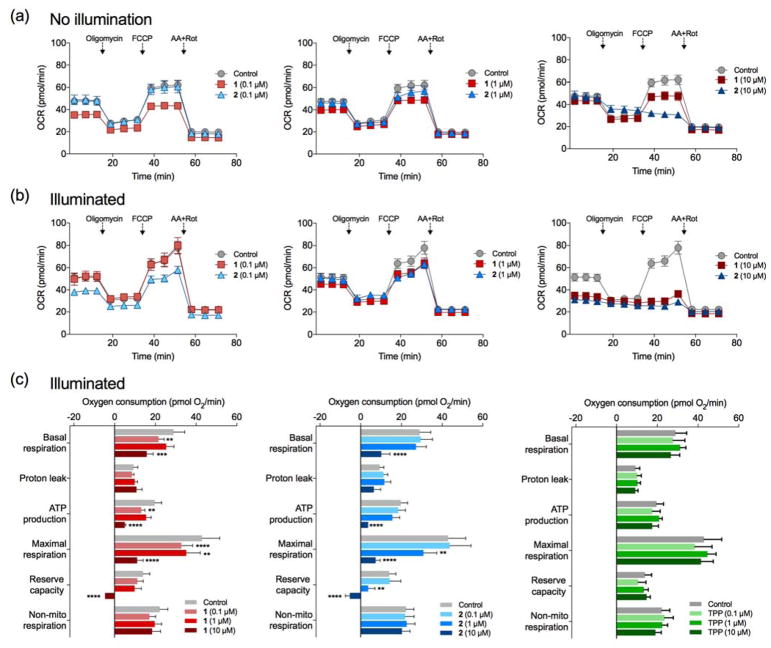
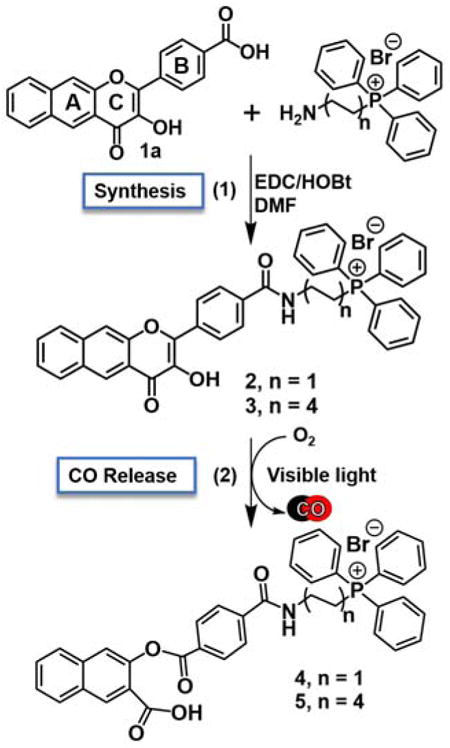
While interactions between carbon monoxide (CO) and mitochondria have been previously studied, the methods used to deliver CO (gas or CO-releasing metal carbonyl compounds) lack subcellular targeting and/or controlled delivery. Thus, the effective concentration needed to produce changes in mitochondrial bioenergetics is yet to be fully defined. To evaluate the influence of mitochondrial-targeted versus intracellularly released CO on mitochondrial oxygen consumption rates, we developed and characterized flavonol-based CO donor compounds that differ at their site of release. These molecules are metal-free, visible light triggered CO donors (photoCORMs) that quantitatively release CO and are trackable in cells via confocal microscopy. Our studies indicate that at a concentration of 10 μM, the mitochondrial-localized and cytosolic CO-releasing compounds are similarly effective in terms of decreasing ATP production, maximal respiration, and the reserve capacity of A549 cells. This concentration is the lowest to impart changes in mitochondrial bioenergetics for any CO-releasing molecule (CORM) reported to date. The results reported herein demonstrate the feasibility of using a structurally tunable organic photoCORM framework for comparative intracellular studies of the biological effects of carbon monoxide.
Figures
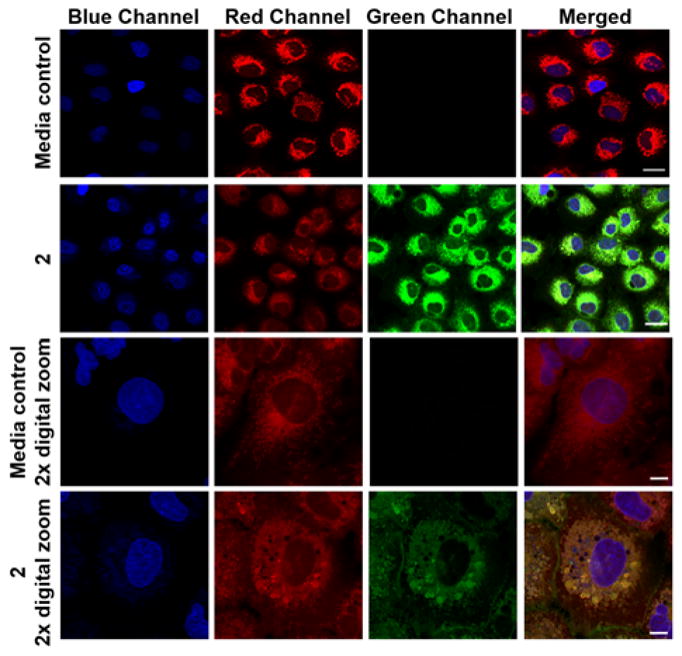
 ), the MitoTracker mitochondria stain (
 ) the CO donor (
 ) or a merge of the three fluorescence channels. Scale bar indicates 20 μm for rows 1 and 2. Scale bar indicates 10 μm for rows 3 and 4.
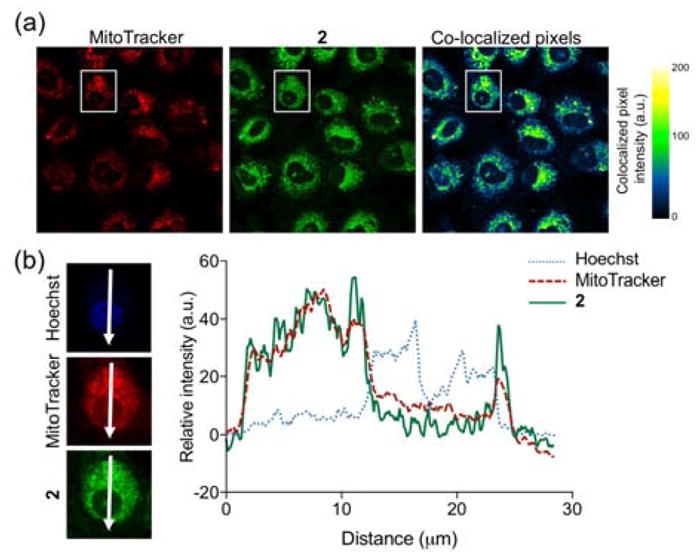
Similar articles
-
Development of Triggerable, Trackable, and Targetable Carbon Monoxide Releasing Molecules.Acc Chem Res. 2020 Oct 20;53(10):2273-2285. doi: 10.1021/acs.accounts.0c00402. Epub 2020 Sep 15. Acc Chem Res. 2020. PMID: 32929957 Free PMC article.
-
Carbon monoxide shifts energetic metabolism from glycolysis to oxidative phosphorylation in endothelial cells.FEBS Lett. 2016 Oct;590(20):3469-3480. doi: 10.1002/1873-3468.12434. Epub 2016 Oct 11. FEBS Lett. 2016. PMID: 27670394
-
Carbon monoxide rescues mice from lethal sepsis by supporting mitochondrial energetic metabolism and activating mitochondrial biogenesis.J Pharmacol Exp Ther. 2009 May;329(2):641-8. doi: 10.1124/jpet.108.148049. Epub 2009 Feb 3. J Pharmacol Exp Ther. 2009. PMID: 19190234
-
CO-releasing Metal Carbonyl Compounds as Antimicrobial Agents in the Post-antibiotic Era.J Biol Chem. 2015 Jul 31;290(31):18999-9007. doi: 10.1074/jbc.R115.642926. Epub 2015 Jun 8. J Biol Chem. 2015. PMID: 26055702 Free PMC article. Review.
-
Obesity and mitochondrial uncoupling - an opportunity for the carbon monoxide-based pharmacology of metabolic diseases.Pharmacol Res. 2025 May;215:107741. doi: 10.1016/j.phrs.2025.107741. Epub 2025 Apr 17. Pharmacol Res. 2025. PMID: 40252782 Review.
Cited by
-
Development of Triggerable, Trackable, and Targetable Carbon Monoxide Releasing Molecules.Acc Chem Res. 2020 Oct 20;53(10):2273-2285. doi: 10.1021/acs.accounts.0c00402. Epub 2020 Sep 15. Acc Chem Res. 2020. PMID: 32929957 Free PMC article.
-
Chemical Reactivities of Two Widely Used Ruthenium-Based CO-Releasing Molecules with a Range of Biologically Important Reagents and Molecules.Anal Chem. 2021 Mar 30;93(12):5317-5326. doi: 10.1021/acs.analchem.1c00533. Epub 2021 Mar 21. Anal Chem. 2021. PMID: 33745269 Free PMC article.
-
Tracking CO release in cells via the luminescence of donor molecules and/or their by-products.Isr J Chem. 2019 May;59(5):339-350. doi: 10.1002/ijch.201800172. Epub 2019 Feb 11. Isr J Chem. 2019. PMID: 31516159 Free PMC article.
-
Carbon monoxide: An emerging therapy for acute kidney injury.Med Res Rev. 2020 Jul;40(4):1147-1177. doi: 10.1002/med.21650. Epub 2019 Dec 9. Med Res Rev. 2020. PMID: 31820474 Free PMC article. Review.
-
Visible-Light-Activated Quinolone Carbon-Monoxide-Releasing Molecule: Prodrug and Albumin-Assisted Delivery Enables Anticancer and Potent Anti-Inflammatory Effects.J Am Chem Soc. 2018 Aug 1;140(30):9721-9729. doi: 10.1021/jacs.8b06011. Epub 2018 Jul 23. J Am Chem Soc. 2018. PMID: 29983046 Free PMC article.
References
-
- Motterlini R, Foresti R. Biological signaling by carbon monoxide and carbon monoxide-releasing molecules. Am J Physiol Cell Physiol. 2017;312:C302–C313. - PubMed
-
- Motterlini R, Otterbein LE. The therapeutic potential of carbon monoxide. Nat Rev Drug Disc. 2010;9:728–743. - PubMed
-
- Bilban M, Haschemi A, Wegiel B, Chin BY, Wagner O, Otterbein LE. Heme oxygenase and carbon monoxide initiate homeostatic signaling. J Mol Med (Berl) 2008;86:267–279. - PubMed
Publication types
MeSH terms
Substances
Grants and funding
LinkOut - more resources
Full Text Sources
Other Literature Sources
