. 2018 Sep 1;22(3):205-214.
doi: 10.5935/1518-0557.20180041.

External validation of a time-lapse model; a retrospective study comparing embryo evaluation using a morphokinetic model to standard morphology with live birth as endpoint

Affiliations

External validation of a time-lapse model; a retrospective study comparing embryo evaluation using a morphokinetic model to standard morphology with live birth as endpoint

Emma Adolfsson et al. JBRA Assist Reprod. .

Abstract

Objective: To validate a morphokinetic implantation model developed for EmbryoScope on embryos with known outcome, compared to standard morphology in a retrospective single center study.

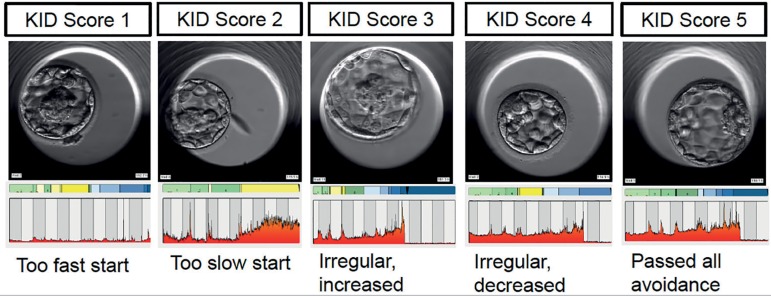
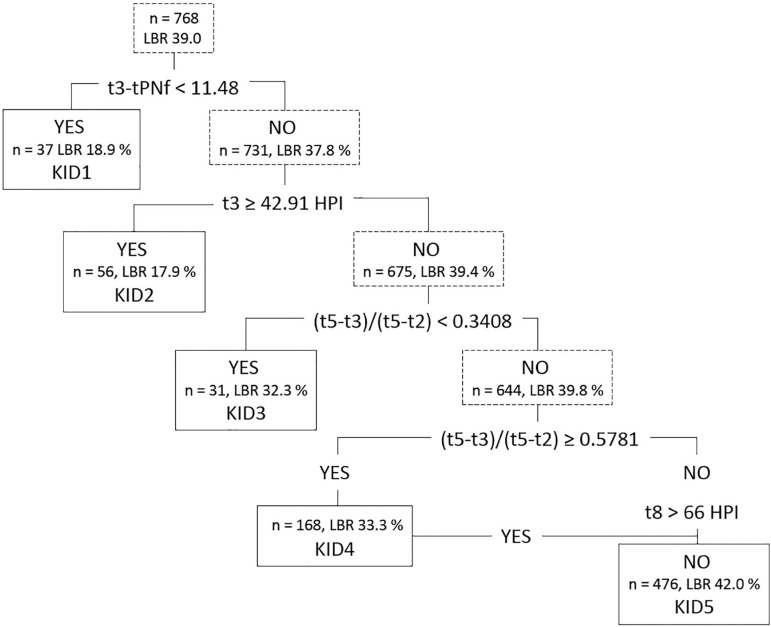
Methods: Morphokinetic annotation of 768 embryos with known outcome between 2013 -2015; corresponding to 116 D3 fresh embryos, 80 D6 frozen blastocysts, and 572 D5 blastocysts, fresh or frozen. The embryos were ranked by the KIDScore into five classes, KID1-5, and grouped into four classes based on standard morphology. Pregnancy rates, clinical pregnancy rates and live birth rates were compared. Combinations of morphology and morphokinetics were evaluated for implantation rates and live births.

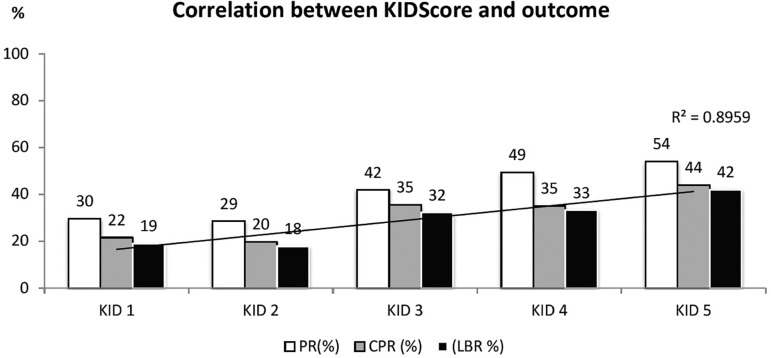
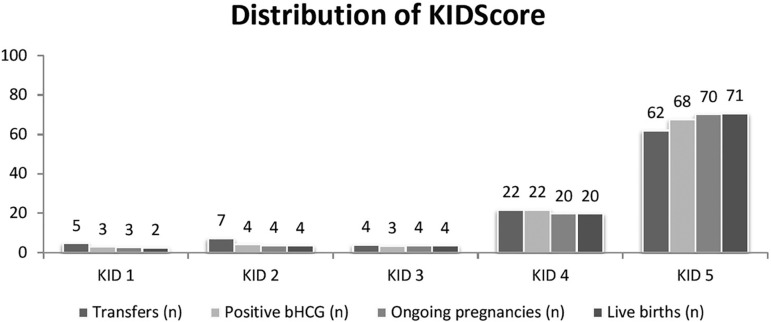
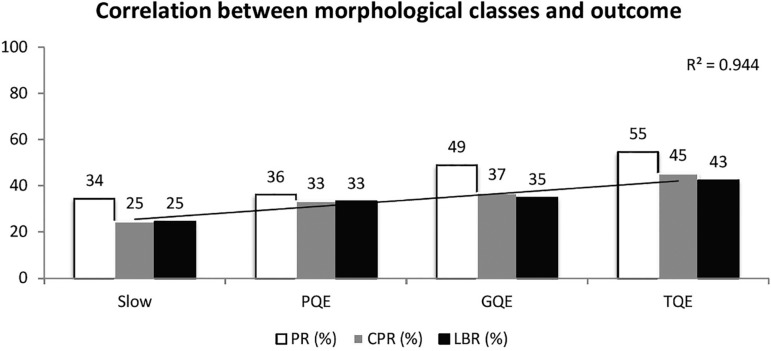
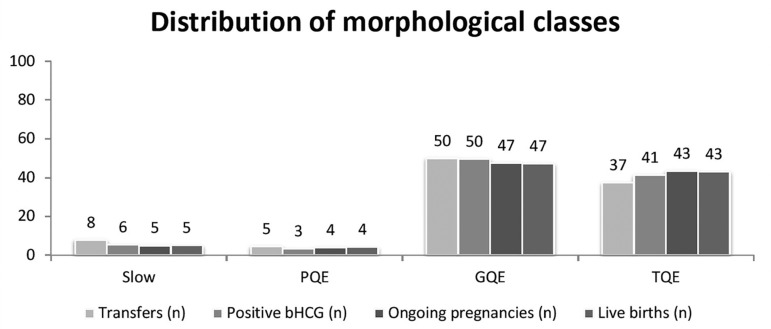
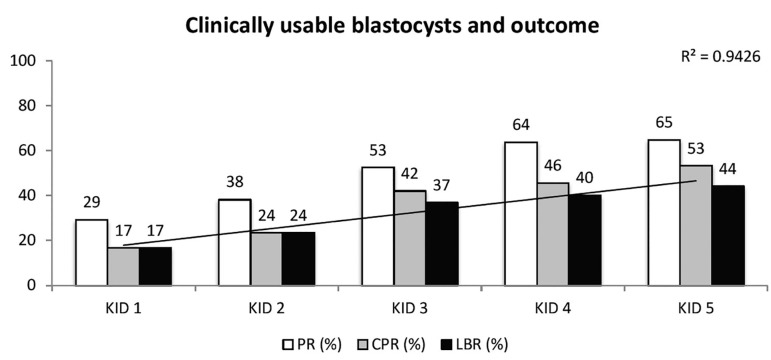
Results: Live birth rate increased with increasing KIDScore, from 19% for KID1 to 42% for KID5. Of all live births, KID5 contributed with 71%, KID4 with 20%, KID3 with 4%, KID2 with 4%, and KID1 with 2%. For morphology, the corresponding figure was 43% for Top Quality, 47% for Good Quality, 4% for Poor Quality, and 5% for Slow embryos. For day 3 embryos, KID5 embryos had the highest live birth rates, and contributed to 83% of the live births; whereas the second best morphological class had the highest live birth rate and contributed to most of the live births. For blastocysts, the KIDScore and morphology performed equally well. Combining morphology and morphokinetics indicated stronger predictive power for morphokinetics.

Conclusions: Overall, the KIDScore correlates with both implantation and live birth in our clinical setting. Compared to morphology, the KIDScore was superior for day 3 embryos, and equally good for blastocysts at predicting live births.

Keywords: Algorithm; embryo evaluation; embryo selection; morphokinetics; time-lapse image.


Figures

Figure 1
Figure 1
Examples of KID1 to KID 5 embryos from Örebro Fertility Clinic, with corresponding bar showing time-lapse annotation. KID1 embryos have a too fast start up to three cells. KID2 embryos have too slow initial development. KID3 embryos have irregular divisions with increasing development speed between the two and five-cell stages. KID4 embryos also have irregular divisions but with decreasing development speed between the two and five-cell stages, or, have not reached eight cells prior to 66 hours post insemination. KID5 embryos have passed all avoidance criteria. The perfect embryo should spend as little time as possible in yellow zones representing uneven cell numbers, and develop in a timely manner from one cell to two cells, from two cells to four cells, and so on. These embryos show that morphology is separate from morphokinetics. In each KID class, there are embryos with the potential to develop into clinically usable blastocysts that appear to be of high quality to the embryologist using standard morphology as embryo evaluation tool.
Figure 2
Figure 2
The hierarchical model with five splits used to generate the KIDScore D3 Basic, adapted from Petersen et al., 2016. Number of inputted embryos, distribution of embryos into KIDScore classes, and corresponding live birth rates (LBR) are shown in the figure. The embryos are ranked based on i) initial cleavage speed up to three cells, ii) t3 time point, ,iii and iiii) irregular cell divisions from 2 cells to 5 cells as described by the (t5-t3)/(t5-t2) equation, and iiiii) on reaching eight cells before 66 hours post insemination (HPI). KID4 embryos are composed of two types of embryos: those that have irregular divisions and those that do not reach eight cells prior to 66 HPI.
Figure 3
Figure 3
Correlation between KIDScore and outcome, all embryos included. Highest live birth rate (LBR) was found with KID5, followed by KID4, KID3, and then similar values for KID1 and KID2. Pregnancy rates (PR) and clinical pregnancy rate (CPR) show the same pattern. A regression curve with correlation coefficient is presented for LBR.
Figure 4
Figure 4
Distribution of the KIDScore - all embryos included. The figure shows the percentage of each KIDScore class on different categories (number of transfers, number of positive pregnancy tests, number of ongoing pregnancies, and number of live births).
Figure 5
Figure 5
Correlation between morphological classes and outcome, for all embryos included in the study. The LBR increases from 25% for PQE, to 43% for TQE. PQE = poor quality embryos, GQE = good quality embryos, TQE = top quality embryos, PR = pregnancy rate, CPR = clinical pregnancy rate, LBR = live birth rate. A regression curve with correlation coefficient is presented for LBR.
Figure 6
Figure 6
Distribution of morphological classes, all embryos included in the study. The figure shows the percentage of each morphological class on each category (number of transfers, number of positive pregnancy tests, number of ongoing pregnancies, and number of live births). Surprisingly, the majority of embryos are ranked as second highest class GQE, not in the best class, with very few embryos in the poorest categories. PQE = poor quality embryo, GQE = good quality embryo, TQE = top quality embryo.
Figure 7
Figure 7
Correlation between clinically usable blastocysts, i.e. Grade 3BB or better (Gardner Schoolcraft criteria) and outcome. Highest LBR is found for KID5 blastocysts, a 2.6 increase compared to KID1. PR = pregnancy rate, CPR = clinical pregnancy rate, LBR = live birth rate. Regression curve with correlation coefficient is presented for LBR

References

    1. Adamson GD, Abusief ME, Palao L, Witmer J, Palao LM, Gvakharia M. Improved implantation rates of day 3 embryo transfers with the use of an automated time-lapse-enabled test to aid in embryo selection. Fertil Steril. 2016;105:369-75.e6. doi: 10.1016/j.fertnstert.2015.10.030. - DOI - PubMed
    1. Alpha Scientists in Reproductive Medicine. ESHRE Special Interest Group of Embryology The Istanbul consensus workshop on embryo assessment: proceedings of an expert meeting. Hum Reprod. 2011;26:1270–1283. doi: 10.1093/humrep/der037. - DOI - PubMed
    1. Azzarello A, Hoest T, Mikkelsen AL. The impact of pronuclei morphology and dynamicity on live birth outcome after time-lapse culture. Hum Reprod. 2012;27:2649–2657. doi: 10.1093/humrep/des210. - DOI - PubMed
    1. Basile N, Nogales Mdel C, Bronet F, Florensa M, Riqueiros M, Rodrigo L, García-Velasco J, Meseguer M. Increasing the probability of selecting chromosomally normal embryos by time-lapse morphokinetics analysis. Fertil Steril. 2014;101:699–704. doi: 10.1016/j.fertnstert.2013.12.005. - DOI - PubMed
    1. Basile N, Vime P, Florensa M, Aparicio Ruiz B, García Velasco JA, Remohí J, Meseguer M. The use of morphokinetics as a predictor of implantation: a multicentric study to define and validate an algorithm for embryo selection. Hum Reprod. 2015;2:276–283. doi: 10.1093/humrep/deu331. - DOI - PubMed

LinkOut - more resources