. 2018 Sep 15:355:28-42.
doi: 10.1016/j.taap.2018.06.001. Epub 2018 Jun 19.

Broad spectrum proteomics analysis of the inferior colliculus following acute hydrogen sulfide exposure

Affiliations

Broad spectrum proteomics analysis of the inferior colliculus following acute hydrogen sulfide exposure

Dong-Suk Kim et al. Toxicol Appl Pharmacol. .

Abstract

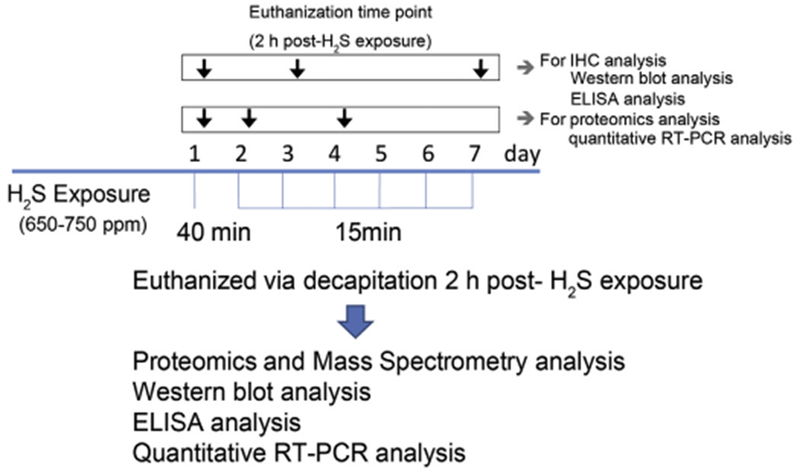
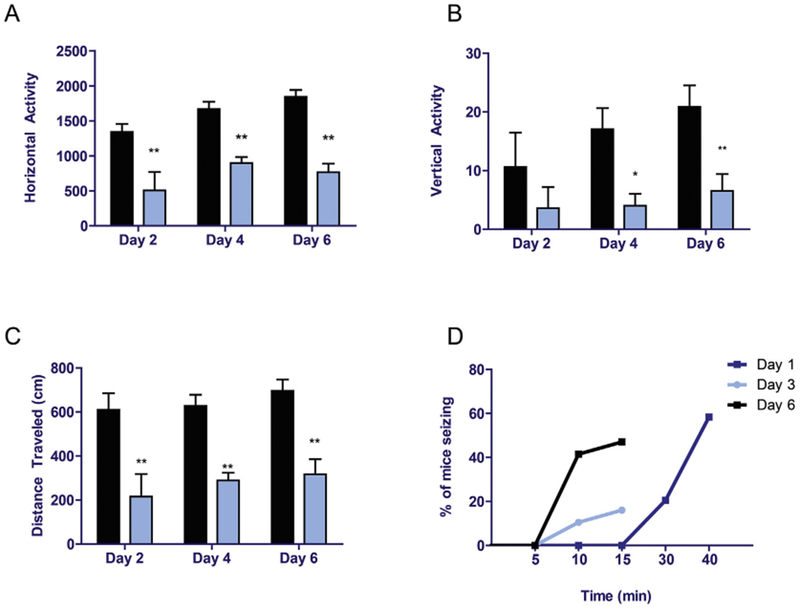
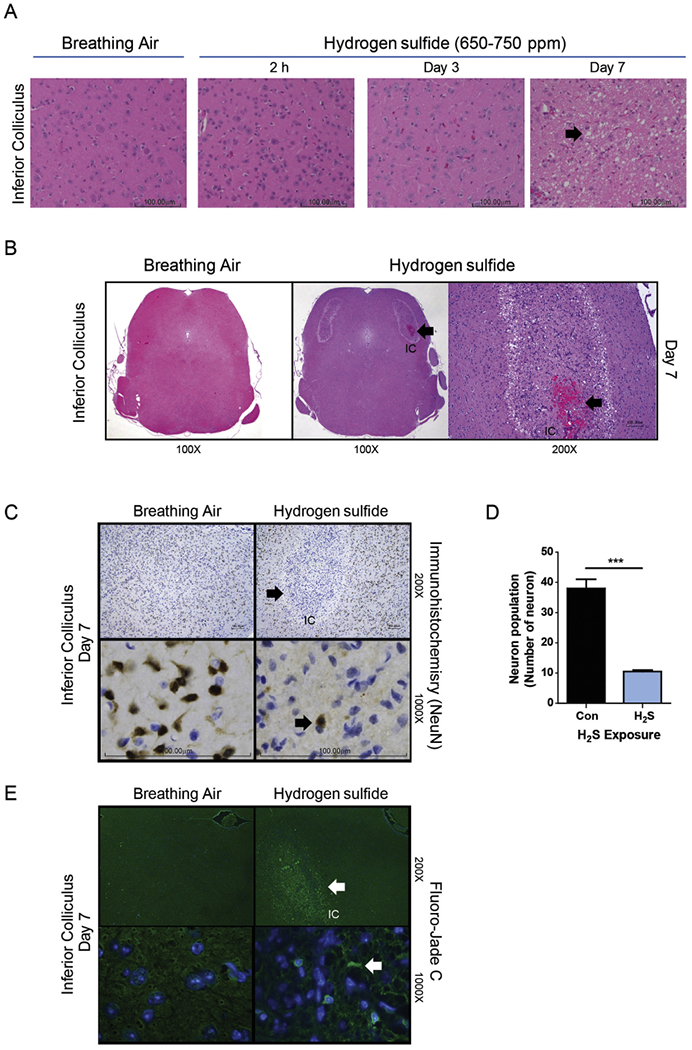
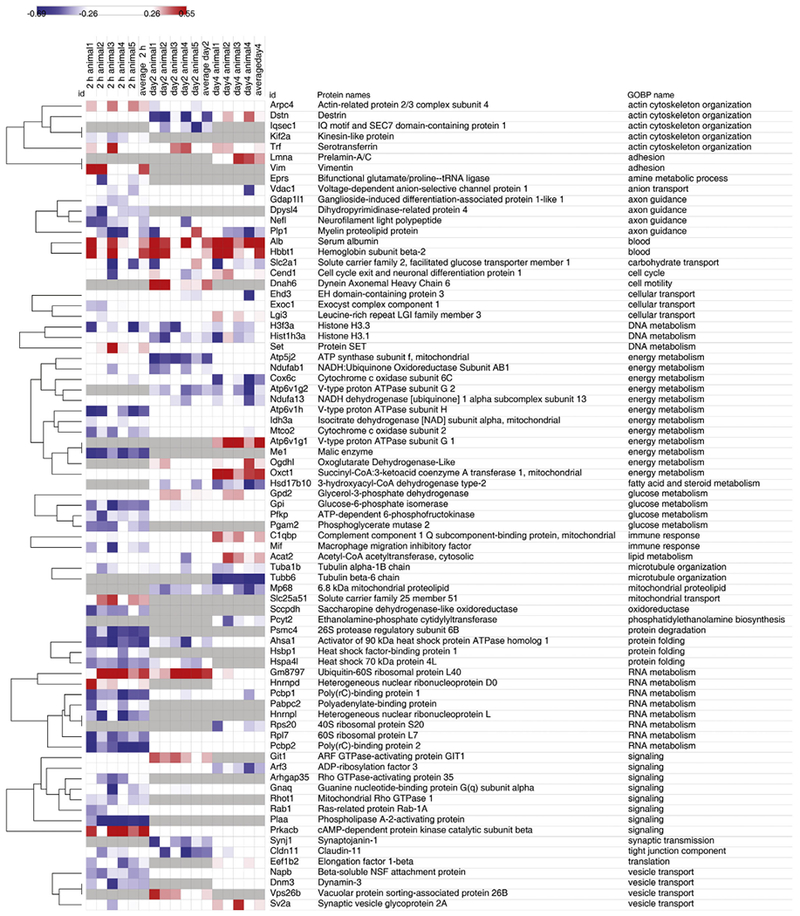
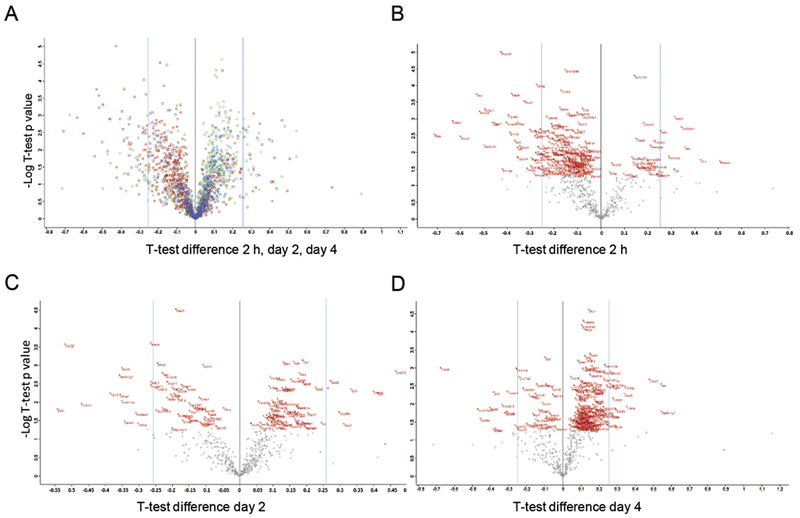
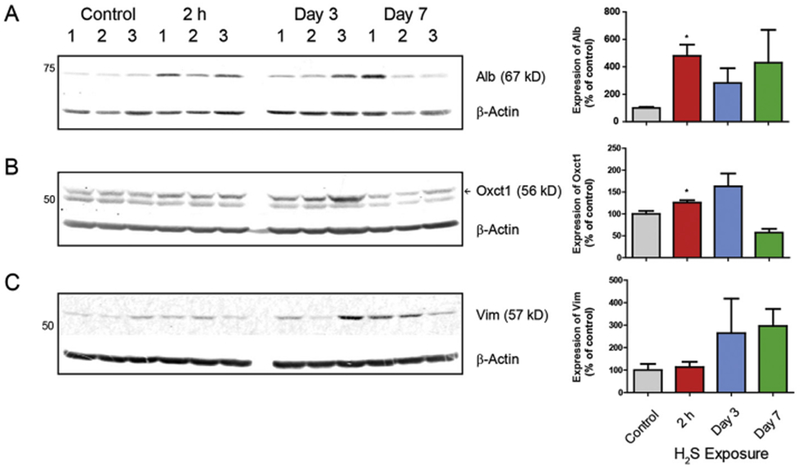
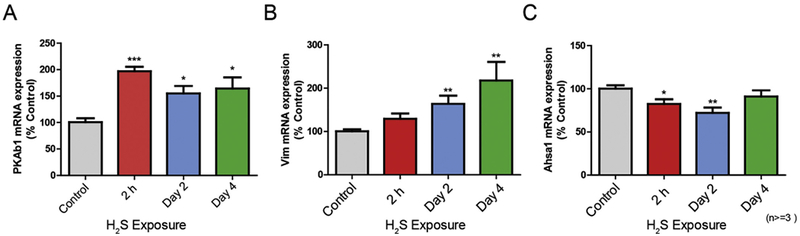
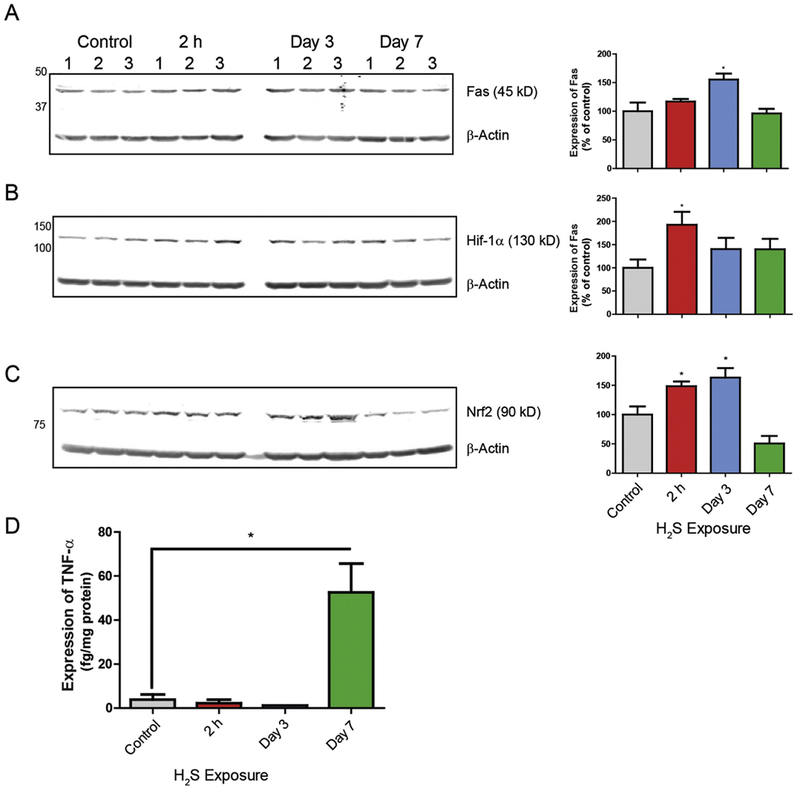
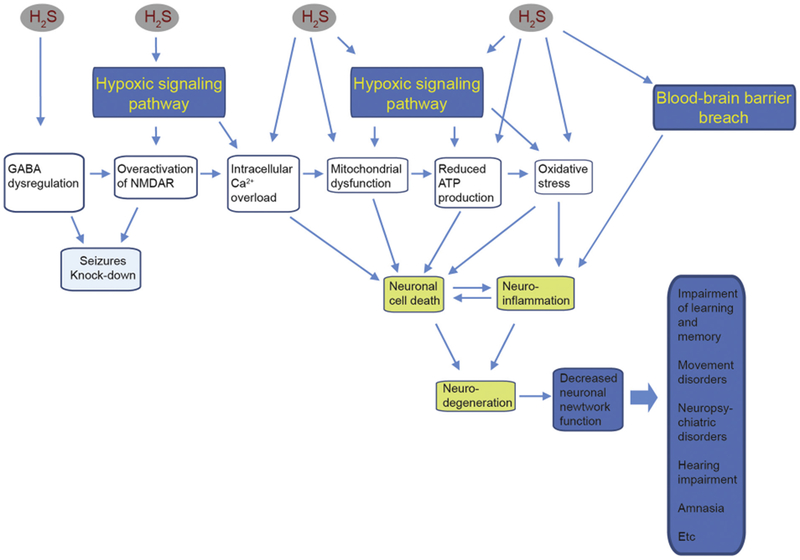
Acute exposure to high concentrations of H2S causes severe brain injury and long-term neurological disorders, but the mechanisms involved are not known. To better understand the cellular and molecular mechanisms involved in acute H2S-induced neurodegeneration we used a broad-spectrum proteomic analysis approach to identify key molecules and molecular pathways involved in the pathogenesis of acute H2S-induced neurotoxicity and neurodegeneration. Mice were subjected to acute inhalation exposure of up to750 ppm of H2S. H2S induced behavioral deficits and severe lesions including hemorrhage in the inferior colliculus (IC). The IC was microdissected for proteomic analysis. Tandem mass tags (TMT) liquid chromatography mass spectrometry (LC-MS/MS)-based quantitative proteomics was applied for protein identification and quantitation. LC-MS/MS identified 598, 562, and 546 altered proteomic changes at 2 h, and on days 2 and 4 post-H2S exposure, respectively. Of these, 77 proteomic changes were statistically significant at any of the 3 time points. Mass spectrometry data were subjected to Perseus 1.5.5.3 statistical analysis, and gene ontology heat map clustering. Expressions of several key molecules were verified to confirm H2S-dependent proteomics changes. Webgestalt pathway overrepresentation enrichment analysis with Panther engine revealed H2S exposure disrupted several biological processes including metabotropic glutamate receptor group 1 and inflammation mediated by chemokine and cytokine signaling pathways among others. Further analysis showed that energy metabolism, integrity of blood-brain barrier, hypoxic, and oxidative stress signaling pathways were also implicated. Collectively, this broad-spectrum proteomics data has provided important clues to follow up in future studies to further elucidate mechanisms of H2S-induced neurotoxicity.

Keywords: Hydrogen sulfide; Neurodegeneration; Neurotoxicity; Proteomic analysis; Proteomic profiling; TMT labeled LC-MS/MS.


Conflict of interest statement

The authors do not have any conflict of interest.

Figures

Fig. 1.
Fig. 1.
Acute exposure paradigm of hydrogen sulfide in C57 black mice. Mice were exposed to 765 ppm of H2S in a chamber for 40 min either once only (day 1) and for 15 min on the subsequent days up to day 7. Mice were sacrificed 2h post-H2S exposure on specified days of the study. Negative control mice were exposed to breathing air from a cylinder daily up to day 7. Separate groups of mice were sacrificed on days 1 (2 h post-exposure), 3, and 7 for immunohistochemistry, Western blot assay, and ELISA analysis. Groups of mice for proteomics studies and quantitative RT-PCR analysis were sacrificed on days 1 (2 h post-exposure), 2 and 4.
Fig. 2.
Fig. 2.
Acute exposure to hydrogen sulfide induced motor deficits and seizures. C57 black mice were exposed to H2S as shown in Fig. 1. Locomotor activity was measured using an automated VersaMax locomotor activity monitor for 10 min on days 2, 4, and 6. Horizontal activity (A), vertical activity (B), and total distance traveled (C) were analyzed between groups. For seizures, time to seizure and number of mice seizing were monitored (D). Asterisks (*, p < 0.05; **, p < 0.01) indicate statistically significant differences between H2S and breathing air negative control groups.
Fig. 3.
Fig. 3.
Neurodegeneration and necrosis in the IC of mice exposed to 650–750 ppm H2S in acute short-term repeated inhalation exposures over 7 days. Note the loss of neurons and development of clear vacuoles in the neuropil (arrow) on day 7 in mice exposed to H2S and the minimal morphologic effects to earlier H2S exposures or breathing air (A). H2S exposure induced hemorrhage (thick arrow) in the IC. An insert at higher magnification is included to show the hemorrhage. Hemorrhage was not seen in control mice (B). NeuN staining in brown color (arrow) of neurons (C). H2S caused marked and selective loss of neurons in the IC (1000× magnification images, C), with retention of neurons in the regions surrounding the IC (200× magnification image) (C). Computer aided image analysis of NeuN immunostained sections reveals marked loss of neurons (D) in the IC of mice exposed to H2S (p < 0.001, t-test). Representative photomicrographs of mice exposed to breathing air or H2S, hematoxylin and eosin (A) and NeuN immunohistochemistry (C). Neurons in the IC region of the H2S exposed mice on day 7 were enumerated and compared to breathing air control (D). Degenerating neurons were visualized with Flouro-Jade C staining (E). Arrow indicates degenerative neurons. Neurodegeneration was not seen in the control group. (For interpretation of the references to color in this figure legend, the reader is referred to the web version of this article.)
Fig. 4.
Fig. 4.
Heatmap of changes in proteomic profile in the IC following acute H2S exposure. Morpheus rendered Heatmap of determined changes in protein expression at 2 h and on days 2 and 4. Hierarchical clustering by Euclidean distance, row average linkage and grouping of rows by gene ontology for biological process (GOBP). Heatmap displays fold expression values of five (2 h and day 2) or four (day 4) IC tissue samples, and average fold expression values, mouse gene identifiers (gene names), protein names, and GOBP. Red color indicates upregulation of protein expression (above 1.2 fold expression vs. control), whereas blue color indicates downregulation of protein expression (below 0.83 fold expression vs. control) Grey color indicates proteins not identified. Protein expression change were converted into a log2 data display. (For interpretation of the references to colour in this figure legend, the reader is referred to the web version of this article.)
Fig. 5.
Fig. 5.
Overall distribution of proteomic profile changes in the IC following H2S exposure. A) Scatter Plot to display overall distribution of one-sample t-test differences in protein expression profiles vs. –Log one-sample t-test p values 2 h (red), day 2 (blue), and day 4 (green) following H2S exposure. Scatter Plots of one-sample t-test fold protein expression differences vs. –Log one-sample t-test p values from B) 2 h, C) day 2, and D) day 4 of H2S exposure. One-sample t-test of significantly modulated proteins in the H2S exposure group vs. the control according to fold expression values are displayed with official mouse gene symbols in red. (For interpretation of the references to colour in this figure legend, the reader is referred to the web version of this article.)
Fig. 6.
Fig. 6.
Validation of selected protein expression changes in IC following H2S exposure. Protein expression was measured by Western blot analysis. Quantitative results are shown in graphs next to Western blot images. Samples were normalized to reference gene, β-Actin. Note the significant increase in Alb and Oxctl and a trend of increased Vim. Data are presented as the mean ± S.E.M. Asterisk (*p < 0.05) indicates a significant difference between H2S group and Control group.
Fig. 7.
Fig. 7.
Validation of expression changes of three genes at the mRNA level in IC following H2S exposure. The transcriptional level of three genes (A; Prkab1, B; Vim, C; Ahsal) was measured by quantitative PCR. Samples were normalized with the reference gene Gapdh. Data are presented as the mean ± S.E.M. Note that only a single acute exposure to H2S (2 h) was needed to cause upregulation of gene expression of PkAbl and Vim or downregulation of Ahsal gene expression. Asterisks (***p < 0.001, **p < 0.01, *p < 0.05) indicate a significant difference between H2S group and Control group.
Fig. 8.
Fig. 8.
Exposure to H2S induced hypoxic signaling, Fas signaling and inflammatory response in IC. Expression of Fas, Hif-1α, and Nrf2 in IC were analyzed by Western blot assay (A, B and C). Target protein expression was normalized to β-Actin. Quantification of Fas, Hif-1α, and Nrf2 expressions are shown graphically on the right. Expression of TNF-α was measured by ELISA (D). Note that TNF-α was significantly increased in the IC on day 7. Data are presented as the mean ± S.E.M. Asterisk (*p < 0.05) indicates a significant difference between H2S group and Control group.
Fig. 9.
Fig. 9.
Overarching scheme of H2S induced neurotoxicity in the IC. This figure is a summary of the overarching hypothesis of acute H2S-induced neurotoxicity. H2S activates glutamate excitotoxicity, mitochondrial injury, hypoxia, and a breach of the blood brain barrier, and mitochondrial injury trigger neuronal cell death, neuro-inflammation and oxidative stress which ultimately leads to neurodegeneration. Key pathways uncovered in the present study fit in various nodes in this overarching scheme.

References

    1. Ahlborg G, 1951. Hydrogen sulfide poisoning in shale oil industry. A.M.A. Arch. Ind. Hygiene Occup. Med 3, 247–266. - PubMed
    1. Anantharam P,, Whitley EM, Mahama B, Kim DS, Imerman PM, Shao D, Langley MR, Kanthasamy A, Rumbeiha WK, 2017. Characterizing a mouse model for evaluation of countermeasures against hydrogen sulfide-induced neurotoxicity and neurological sequelae. Ann. N. Y. Acad. Sci 1400, 46–64. - PMC - PubMed
    1. Bandow K, Kusuyama J, Kakimoto K, Ohnishi T, Matsuguchi T, 2015. AMP-activated protein kinase (AMPK) activity negatively regulates chondrogenic differentiation. Bone 74, 125–133. - PubMed
    1. Bielow C, Mastrobuoni G, Kempa S, 2016. Proteomics quality control: quality control software for MaxQuant results. J. Proteome Res 15, 777–787. - PubMed
    1. Bruchmann A, Roller C, Walther TV, Schafer G, Lehmusvaara S, Visakorpi T, Klocker H, Cato AC, Maddalo D, 2013. Bcl-2 associated athanogene 5 (Bag5) is overexpressed in prostate cancer and inhibits ER-stress induced apoptosis. BMC Cancer 13, 96. - PMC - PubMed

Publication types

Substances