. 2019 Jul:80:14-28.
doi: 10.1016/j.matbio.2018.06.006. Epub 2018 Jun 20.

Defective lung function following influenza virus is due to prolonged, reversible hyaluronan synthesis

Affiliations

Defective lung function following influenza virus is due to prolonged, reversible hyaluronan synthesis

Thomas J Bell et al. Matrix Biol. 2019 Jul.

Abstract

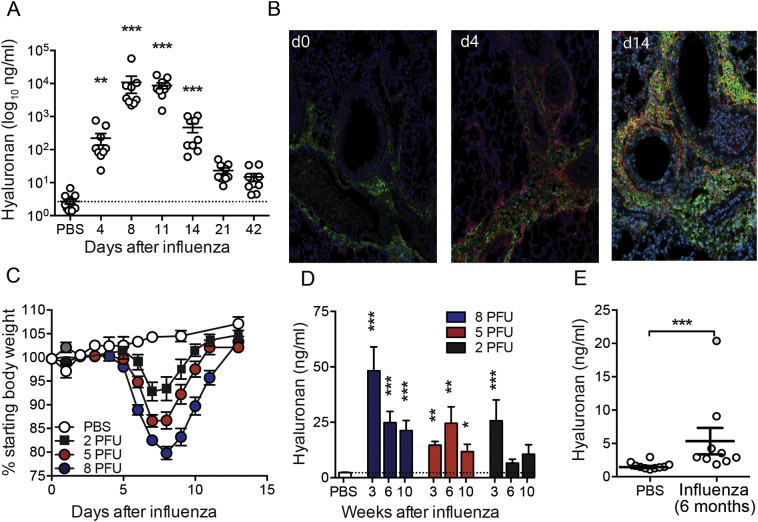
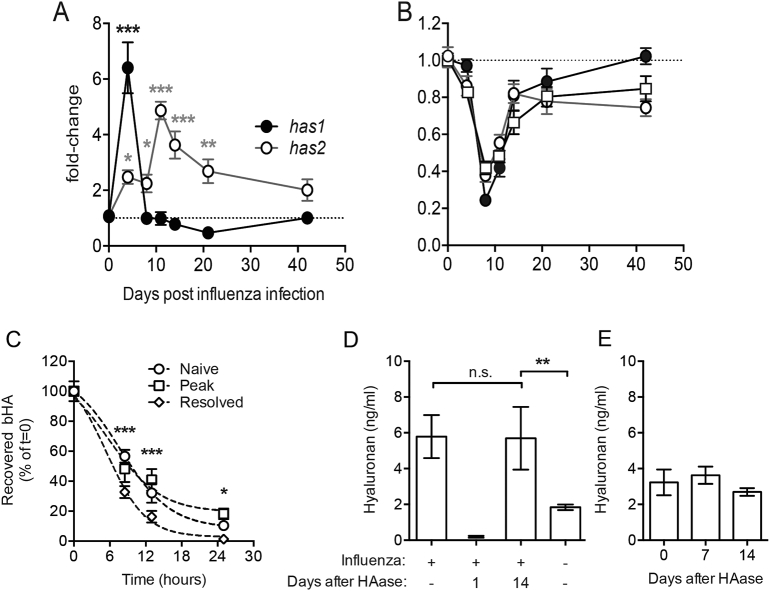
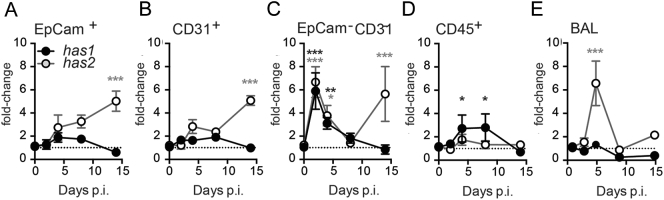
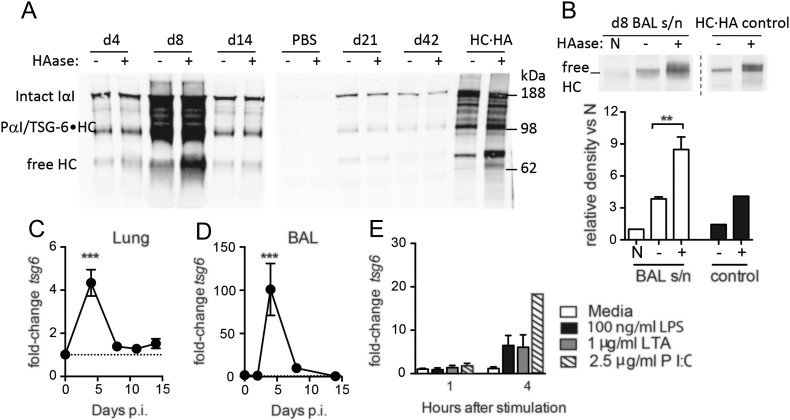
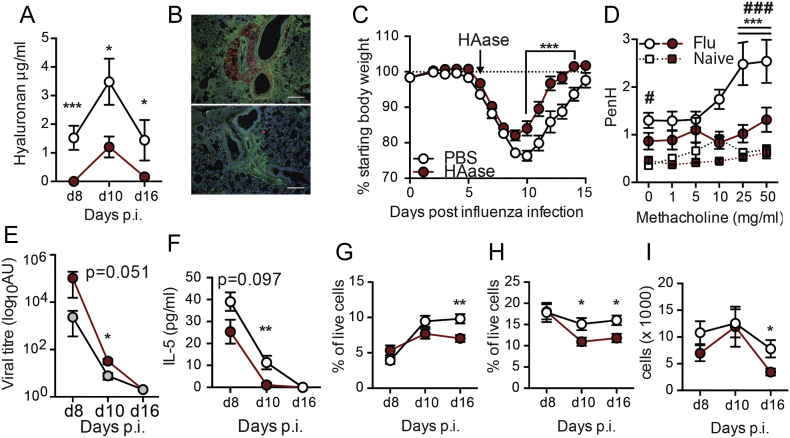
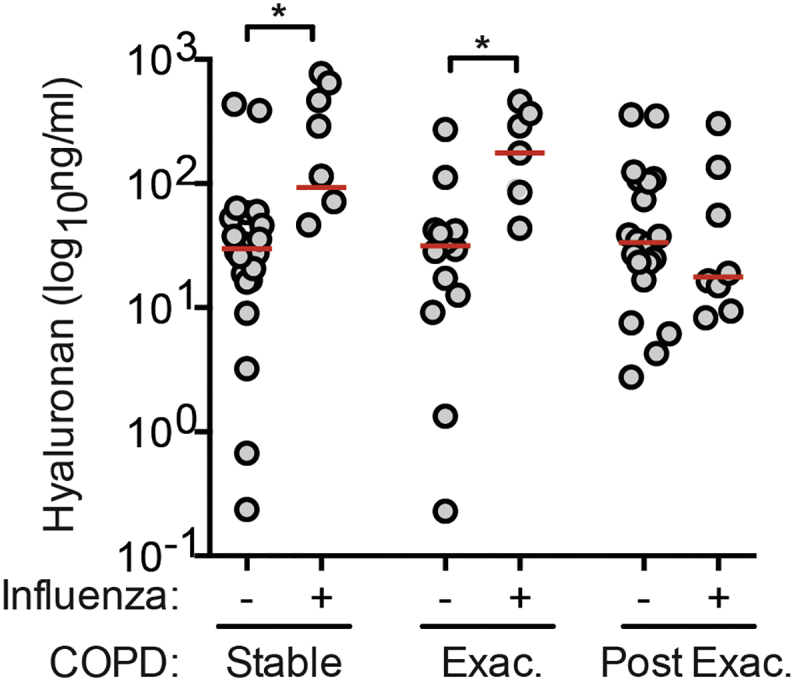
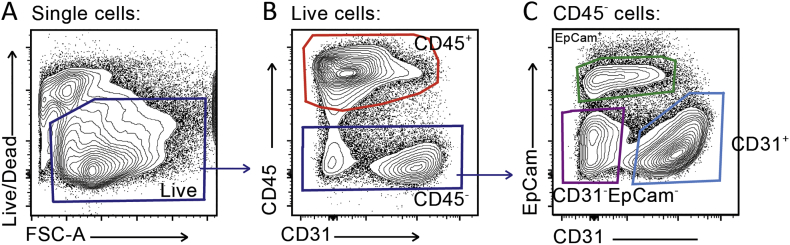
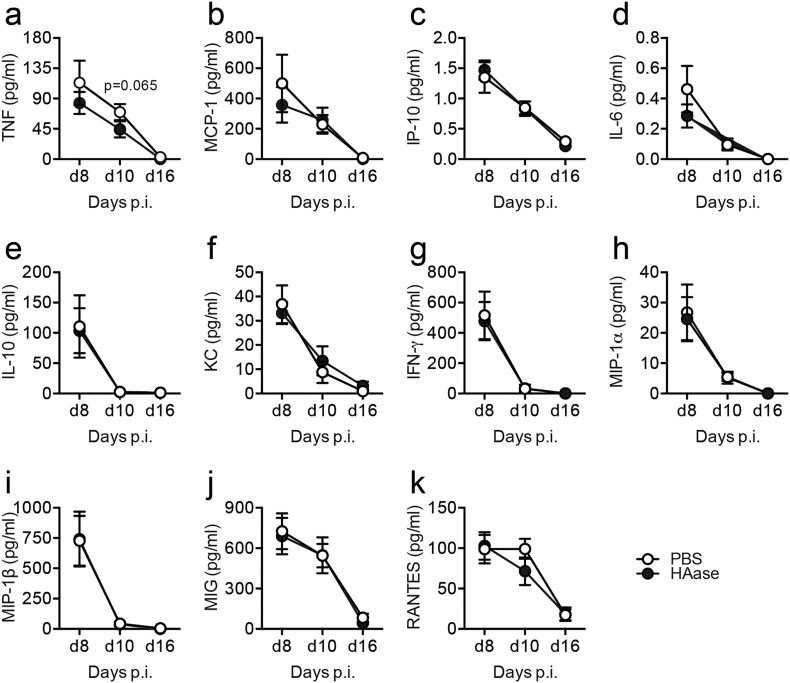
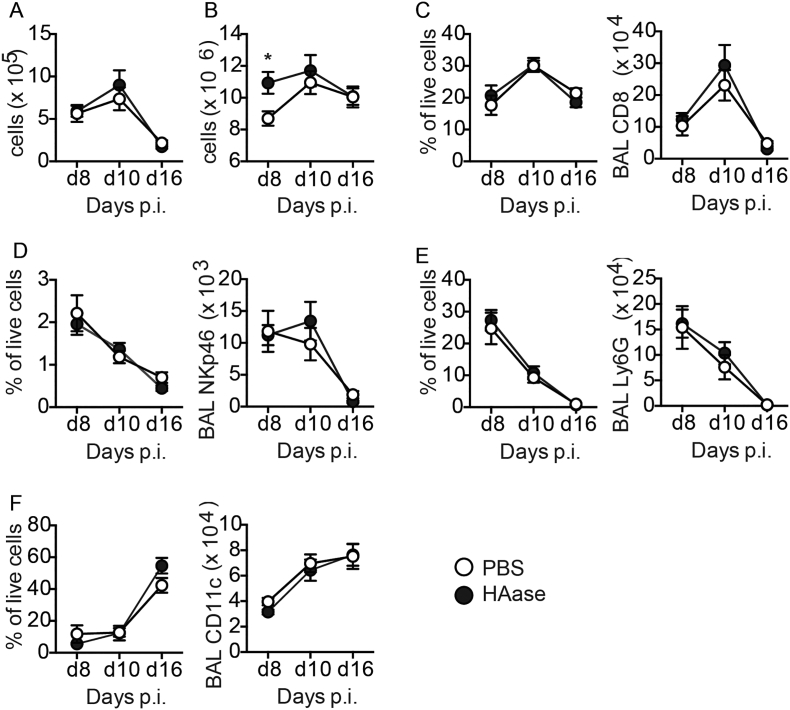
Little is known about the impact of viral infections on lung matrix despite its important contribution to mechanical stability and structural support. The composition of matrix also indirectly controls inflammation by influencing cell adhesion, migration, survival, proliferation and differentiation. Hyaluronan is a significant component of the lung extracellular matrix and production and degradation must be carefully balanced. We have discovered an imbalance in hyaluronan production following resolution of a severe lung influenza virus infection, driven by hyaluronan synthase 2 from epithelial cells, endothelial cells and fibroblasts. Furthermore hyaluronan is complexed with inter-α-inhibitor heavy chains due to elevated TNF-stimulated gene 6 expression and sequesters CD44-expressing macrophages. We show that intranasal administration of exogenous hyaluronidase is sufficient to release inter-α-inhibitor heavy chains, reduce lung hyaluronan content and restore lung function. Hyaluronidase is already used to facilitate dispersion of co-injected materials in the clinic. It is therefore feasible that fibrotic changes following severe lung infection and inflammation could be overcome by targeting abnormal matrix production.

Keywords: Fibroblasts; Inflammation; Influenza; Lung; Lung function; Matrix.


Figures

Fig. 1
Fig. 1
Hyaluronan accumulation in resolution of influenza infection. Mice were infected with 6 PFU PR8 influenza and airway hyaluronan content determined in BAL fluid by ELISA (A). Paraffin embedded formalin-fixed lung sections from mice infected with 6 PFU PR8 influenza were stained for hyaluronan using bHABP (green), CD44 (red) and nuclei using DAPI (blue) (B). Mice were infected with 2, 5 or 8 PFU PR8 influenza, weight monitored daily (C), and BAL hyaluronan content determined by ELISA after 3, 6 and 10 weeks (D). Hyaluronan content was also measured in BAL fluid from mice 6 months after treatment with PBS or infection with influenza (E). Error bars represent mean ± SEM. n = 9–13 mice/group (A), representative images from n = 3 mice (B), n = 12 mice/group (C), n = 9–17 mice/group (D) and n = 9–10 mice/group (E). * = p < 0.05, ** = p < 0.01, *** = p < 0.001 by ANOVA with Dunn's post-test (a), ANOVA with Holm-Sidak post-test (d) or Mann-Whitney U test (E).
Fig. 2
Fig. 2
Accumulation of hyaluronan after influenza infection is due to excess expression of hyaluronan synthases and not due to defects in clearance. Expression of hyaluronan synthases 1 & 2 (a; has1 & has2) and hyaluronidases 1–3 (b; squares, open circles and closed circles, respectively) was determined in whole-lung RNA extracts. Recovery of bHA in BAL fluid after intranasal administration with 20 μg bHA in naïve mice, mice at the peak of influenza infection (day 8) and influenza-resolved mice (day 14 after infection) was measured by ELISA (C). Mice were treated with Streptomyces hyaluronidase three weeks after influenza infection, and BAL hyaluronan measured after 1–14 days in treated mice, in untreated infected mice and in naïve untreated mice (D). BAL hyaluronan was also measured 7 and 14 days after hyaluronidase treatment of naïve mice (E). Relative gene expression is shown as fold-change relative to naïve (day 0) control groups after normalisation to the control genes hprt and gapdh. Error bars represent mean ± SEM. n = 8–12 mice/group (a,b), n = 3–5 mice/group (c) and n = 7–9 mice/group (D,E). * = p < 0.05, ** = p < 0.01, *** = p < 0.001 vs control group by ANOVA with Holm-Sidak post-test (A,B). * = p < 0.05, *** = p < 0.001 between naïve and resolved mice, and # = p < 0.05 between naïve and peak-infected mice by 2-way ANOVA with Dunnet's post-test (c). * = p < 0.05, ** = p < 0.01 by ANOVA with Dunn's post-test (D).
Fig. 3
Fig. 3
Hyaluronan synthase and hyaluronidase expression during influenza infection. Expression of hyaluronan synthases 1 & 2 (has1 & has2) was determined in sorted lung populations (A-D) and whole-BAL (E) RNA extracts by qPCR. Relative gene expression is shown as fold-change relative to naïve (day 0) control groups after normalisation to the control genes hprt and gapdh. Error bars represent mean ± SEM. n = 6–7 (A-D) and n = 8–12 (E) mice/group. * = p < 0.05, ** = p < 0.01, *** = p < 0.001 vs control group by ANOVA with Holm-Sidak post-test.
Fig. 4
Fig. 4
Heavy chain-hyaluronan complexes are generated after viral infection. BAL supernatants from influenza infected mice were incubated at 60 °C for 30 min in the presence (+) or absence (−) of Streptomyces hyaluronidase to release free HCs from HC·HA complexes, and intact IαI and free HCs detected by western blot (A). Additional BAL samples from day 8 after infection were either incubated on ice (N) or incubated for 30 min at 60 °C in the absence (−) or presence (+) of hyaluronidase, then free HCs detected by western blot and relative band densities quantified using ImageJ (B). HC·HA synthesised in vitro [94] was also hyaluronidase treated in parallel as a control (A,B). The expression of tsg6 mRNA was determined in whole-lung (C) and whole-BAL (D) RNA extracts from influenza-infected mice, and in isolated alveolar macrophages stimulated ex vivo with LPS, LTA or Poly(IC) (E), by qPCR. Representative blots shown from n = 2 (A) or n = 5 (B) mice, with boundaries between individual blots highlighted. Error bars represent mean ± SEM. n = 5 (B), n = 9–12 (C), n = 6–7 (D) and n = 3–5 (E). * = p < 0.05, ** = p < 0.01, *** = p < 0.001 by Mann-Whitney U test (B) or ANOVA with Holm-Sidak post-test (C-E).
Fig. 5
Fig. 5
Reducing hyaluronan accumulation improves recovery after influenza infection. Mice were infected with influenza, and then given a single dose of PBS or hyaluronidase intranasally on day 6. BAL fluid hyaluronan content was determined in heat inactivated BAL samples by ELISA (A). Representative lung sections from influenza infected mice treated with PBS (top) or hyaluronidase (bottom) were stained for DAPI (blue), CD44 (Green) and HA (red). Scale bar represents 500 μm (B). Body weight was monitored daily and is represented as percent original weight (C). Lung function was measured by whole body plethysmography under increasing doses of methacholine at day 16 after infection (D). Viral titres in whole-lung RNA extracts were measured by qPCR for viral RNA (E). IL-5 was measured in BAL fluid by CBA (F). The proportion of CD4+ T cells (G), F4/80+CD11b+SiglecF-CD11clow recruited macrophages (H) and number CD11cSiglecF+ eosinophils (I) in the BAL was determined by flow cytometry. Error bars represent mean ± SEM. n = 7–20 mice/group (A,E-H), n = 20 mice/group (B), n = 4–6 mice/group (C), n = 6–10 (d). * = p < 0.05, ** = p < 0.01, *** = p < 0.001, comparisons PBS & HAase by 2-way ANOVA with Holm-Sidak post-test (B) or Mann-Whitney U test (A,D-H). *** = p < 0.001 between PBS and hyaluronidase treated influenza-infected mice and # = p < 0.05, ### = p < 0.001 between PBS treated naïve and influenza-infected mice by 2-way ANOVA with Holm-Sidak post-test (C).
Supplementary Fig. 1
Hyaluronan is increased in sputum samples from influenza-positive COPD patients. Hyaluronan content in sputum from COPD patients was elevated in samples PCR-positive for influenza. Influenza status was determined by PCR, and samples stratified into three groups based on COPD disease state at time of sample collection: Stable (n = 29), Exacerbation (Exac.) (n = 20) and 2–6 weeks Post-Exacerbation (Post Exac.) (n = 28). Line indicates the median. * = p < 0.05 by Mann-Whitney U test. All Hyaluronan measurement was by ELISA.
Supplementary Fig. 2
Gating plan for isolation of lung cell populations by flow cytometry. To sort immune, epithelial, endothelial and lineage negative stromal cells by flow cytometry, whole lung was digested with collagenase and DNase then homogenised to single cell suspension. Viable cells were selected (a), and CD45+ immune cells collected (b). Of the CD45- cells, EpCam+ epithelial cells, CD31+ endothelial cells and CD31-EpCam- stromal cells were collected (c). Representative plots shown.
Supplementary Fig. 3
Cytokines in the airways after hyaluronidase treatment in influenza-infected mice. Mice were infected with influenza, then given a single dose of either PBS or hyaluronidase by intranasal inoculation on day 6. BAL fluid TNF (a), MCP-1 (b), IP-10 (c), IL-6 (d), IL-10 (e), KC (f), IFN-γ (g), MIP-1α (h), MIP-1β (i), MIG (j) or RANTES (k) content was determined in BAL samples by ELISA or CBA. Error bars represent mean ± SEM, n = 7–20 mice/group.
Supplementary Fig. 4
Cell numbers in the lung and airways after hyaluronidase treatment in influenza-infected mice. Mice were infected with influenza, then given a single dose of either PBS or hyaluronidase by intranasal inoculation on day 6. BAL cell number (a), lung cell number (b) and the number and proportion of CD8+ T cells (c), NKp46+ NK cells (d), F4/80-Ly6G+ neutrophils (e) and CD11c + SiglecF+ alveolar macrophages (f) was determined by flow cytometry. Error bars represent mean ± SEM, n = 7–20 mice/group. * = p < 0.05 by Mann-Whitney U test.

References

    1. Burgess J.K., Mauad T., Tjin G., Karlsson J.C., Westergren-Thorsson G. The extracellular matrix - the under-recognized element in lung disease? J. Pathol. 2016;240(4):397–409. - PMC - PubMed
    1. Allegra L., Della Patrona S., Petrigni G. Hyaluronic acid: perspectives in lung diseases. Handb. Exp. Pharmacol. 2012;207:385–401. - PubMed
    1. Lauer M.E., Dweik R.A., Garantziotis S., Aronica M.A. The rise and fall of Hyaluronan in respiratory diseases. Int. J. Cell Biol. 2015;2015:712507. - PMC - PubMed
    1. Schiller H.B., Fernandez I.E., Burgstaller G., Schaab C., Scheltema R.A., Schwarzmayr T., Strom T.M., Eickelberg O., Mann M. Time- and compartment-resolved proteome profiling of the extracellular niche in lung injury and repair. Mol. Syst. Biol. 2015;11(7):819. - PMC - PubMed
    1. Tighe R.M., Garantziotis S. Hyaluronan interactions with innate immunity in lung biology. Matrix Biol. 2019;78-79:84–99. - PMC - PubMed

Publication types

MeSH terms