

Alterations in the gut bacterial microbiome in fungal Keratitis patients
- PMID: 29933394
- PMCID: PMC6014669
- DOI: 10.1371/journal.pone.0199640
Alterations in the gut bacterial microbiome in fungal Keratitis patients
Erratum in
-
Correction: Alterations in the gut bacterial microbiome in fungal Keratitis patients.PLoS One. 2019 Jan 30;14(1):e0211757. doi: 10.1371/journal.pone.0211757. eCollection 2019. PLoS One. 2019. PMID: 30699192 Free PMC article.
Abstract
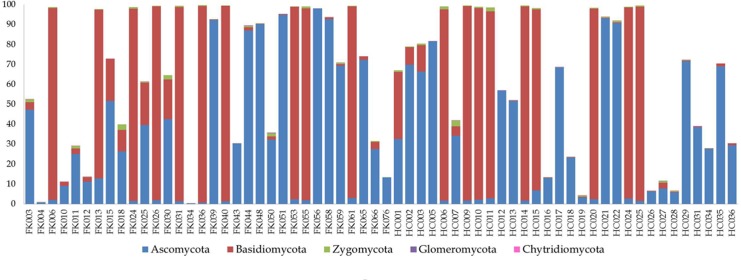
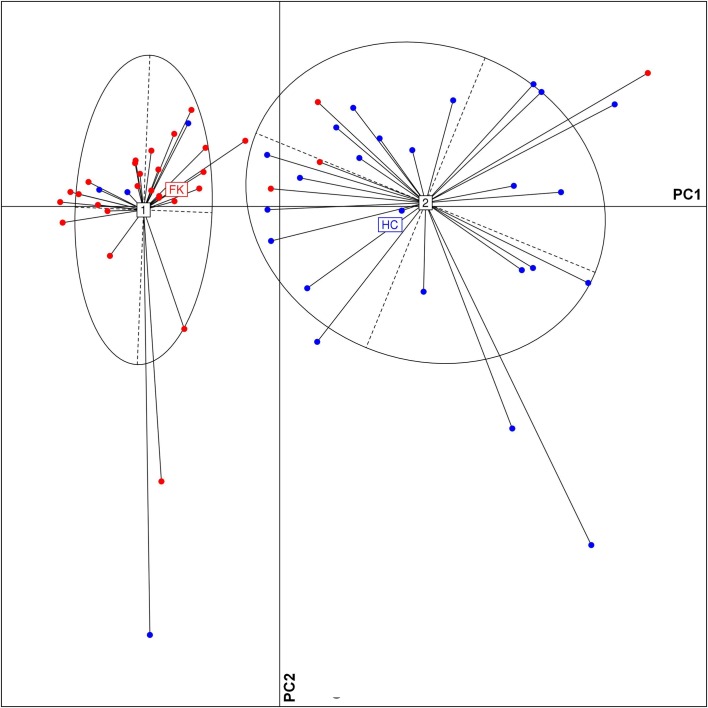
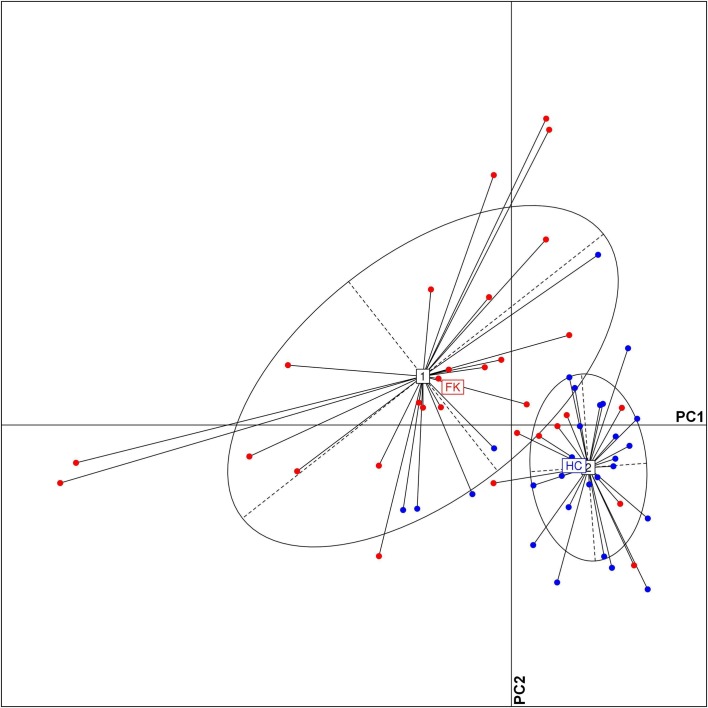
Dysbiosis in the gut microbiome has been implicated in several diseases including auto-immune diseases, inflammatory diseases, cancers and mental disorders. Keratitis is an inflammatory disease of the eye significantly contributing to corneal blindness in the developing world. It would be worthwhile to investigate the possibility of dysbiosis in the gut microbiome being associated with Keratitis. Here, we have analyzed fungal and bacterial populations in stool samples through high-throughput sequencing of the ITS2 region for fungi and V3-V4 region of 16S rRNA gene for bacteria in healthy controls (HC, n = 31) and patients with fungal keratitis (FK, n = 32). Candida albicans (2 OTUs), Aspergillus (1 OTU) and 3 other denovo-OTUs were enriched in FK samples and an unclassified denovo-OTU was enriched in HC samples. However, the overall abundances of these 'discriminatory' OTUs were very low (< 0.001%) and not indicative of significant dysbiosis in the fungal community inhabiting the gut of FK patients. In contrast, the gut bacterial richness and diversity in FK patients was significantly decreased when compared to HC. 52 OTUs were significantly enriched in HC samples whereas only 5 OTUs in FK. The OTUs prominently enriched in HC were identified as Faecalibacterium prausnitzii, Bifidobacterium adolescentis, Lachnospira, Mitsuokella multacida, Bacteroides plebeius, Megasphaera and Lachnospiraceae. In FK samples, 5 OTUs affiliated to Bacteroides fragilis, Dorea, Treponema, Fusobacteriaceae, and Acidimicrobiales were significantly higher in abundance. The functional implications are that Faecalibacterium prausnitzii, an anti-inflammatory bacterium and Megasphaera, Mitsuokella multacida and Lachnospira are butyrate producers, which were enriched in HC patients, whereas Treponema and Bacteroides fragilis, which are pathogenic were abundant in FK patients, playing a potential pro-inflammatory role. Heatmap, PCoA plots and functional profiles further confirm the distinct patterns of gut bacterial composition in FK and HC samples. Our study demonstrates dysbiosis in the gut bacterial microbiomes of FK patients compared to HC. Further, based on inferred functions, it appears that dysbiosis in the gut of FK subjects is strongly associated with the disease phenotype with decrease in abundance of beneficial bacteria and increase in abundance of pro-inflammatory and pathogenic bacteria.
Conflict of interest statement
Commercial affiliation with TCS Research, Tata Consultancy Services Ltd. does not alter our adherence to PLOS ONE policies on sharing data and materials.
Figures


References
-
- Lederberg J, McCray A. The Scientist: 'Ome Sweet 'Omics—A Genealogical Treasury of Words. The Scientist. 2001;17(7). doi: citeulike-article-id:1874228.
-
- Peterson J, Garges S, Giovanni M, McInnes P, Wang L, Schloss JA, et al. The NIH Human Microbiome Project. Genome Res. 2009;19(12):2317–23. Epub 2009/10/13. doi: 10.1101/gr.096651.109 ; PubMed Central PMCID: PMC2792171. - DOI - PMC - PubMed
-
- Qin J, Li R, Raes J, Arumugam M, Burgdorf KS, Manichanh C, et al. A human gut microbial gene catalog established by metagenomic sequencing. Nature. 2010;464(7285):59–65. PubMed PMID: PMC3779803. doi: 10.1038/nature08821 - DOI - PMC - PubMed
-
- Cho I, Blaser MJ. The Human Microbiome: at the interface of health and disease. Nat Rev Genet. 2012;13(4):260–70. PubMed PMID: PMC3418802. doi: 10.1038/nrg3182 - DOI - PMC - PubMed
-
- Turnbaugh PJ, Ridaura VK, Faith JJ, Rey FE, Knight R, Gordon JI. The effect of diet on the human gut microbiome: a metagenomic analysis in humanized gnotobiotic mice. Sci Transl Med. 2009;1(6):6ra14 Epub 2010/04/07. doi: 10.1126/scitranslmed.3000322 ; PubMed Central PMCID: PMC2894525. - DOI - PMC - PubMed
Publication types
MeSH terms
LinkOut - more resources
Full Text Sources
Other Literature Sources
Medical
