. 2018 Jun 22;15(1):189.
doi: 10.1186/s12974-018-1224-3.

Bone marrow-derived mesenchymal stem/stromal cells reverse the sensorial diabetic neuropathy via modulation of spinal neuroinflammatory cascades

Affiliations

Bone marrow-derived mesenchymal stem/stromal cells reverse the sensorial diabetic neuropathy via modulation of spinal neuroinflammatory cascades

Afrânio Ferreira Evangelista et al. J Neuroinflammation. .

Abstract

Background: Diabetic neuropathy (DN) is a frequent and debilitating manifestation of diabetes mellitus, to which there are no effective therapeutic approaches. Mesenchymal stem/stromal cells (MSC) have a great potential for the treatment of this syndrome, possibly through regenerative actions on peripheral nerves. Here, we evaluated the therapeutic effects of MSC on spinal neuroinflammation, as well as on ultrastructural aspects of the peripheral nerve in DN-associated sensorial dysfunction.

Methods: C57Bl/6 mice were treated with bone marrow-derived MSC (1 × 10⁶), conditioned medium from MSC cultures (CM-MSC) or vehicle by endovenous route following the onset of streptozotocin (STZ)-induced diabetes. Paw mechanical and thermal nociceptive thresholds were evaluated by using von Frey filaments and Hargreaves test, respectively. Morphological and morphometric analysis of the sciatic nerve was performed by light microscopy and transmission electron microscopy. Mediators and markers of neuroinflammation in the spinal cord were measured by radioimmunoassay, real-time PCR, and immunofluorescence analyses.

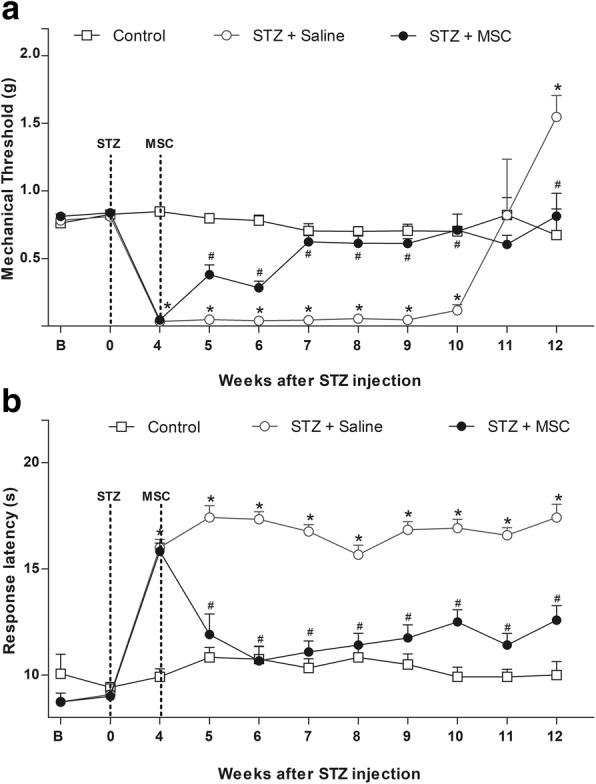
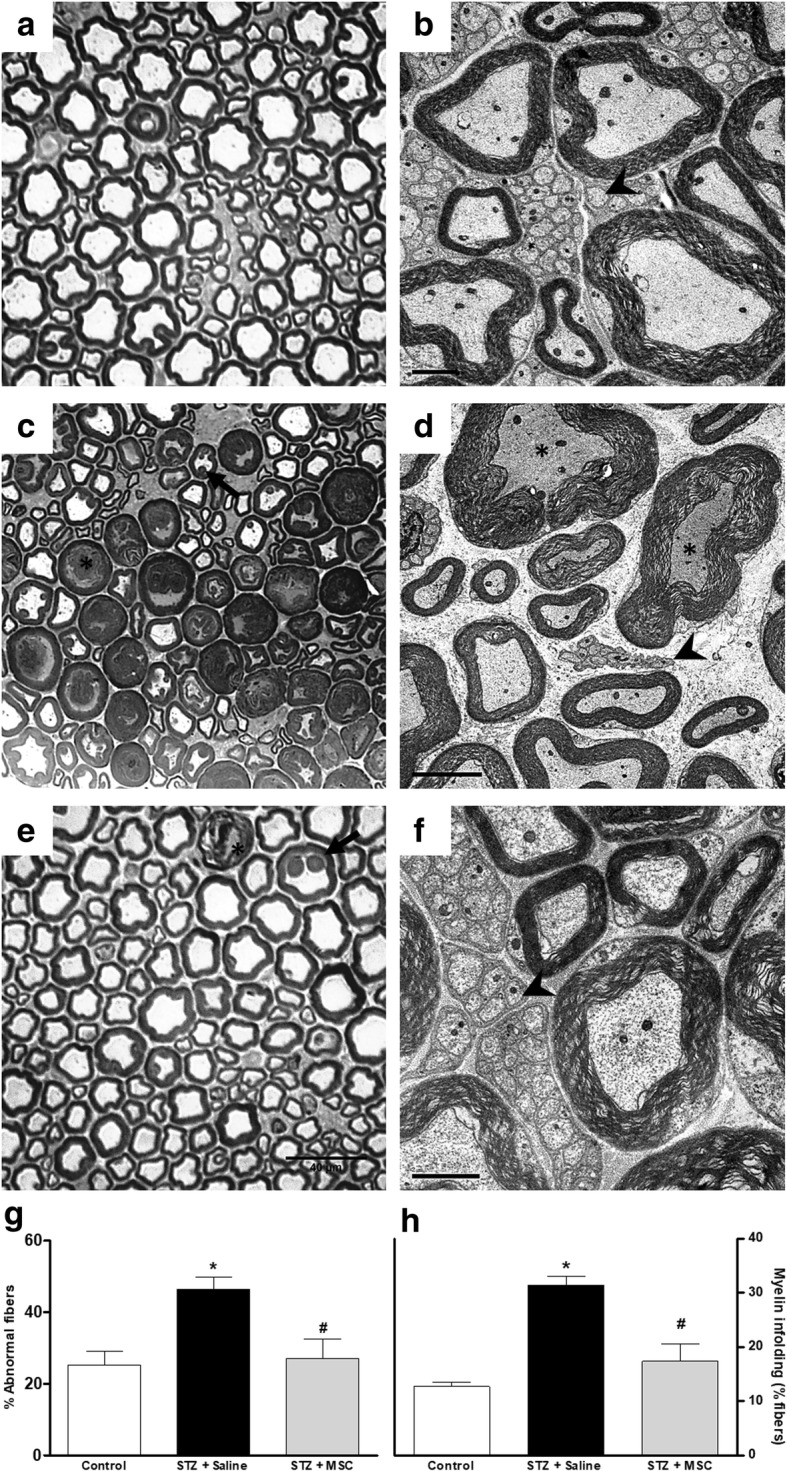
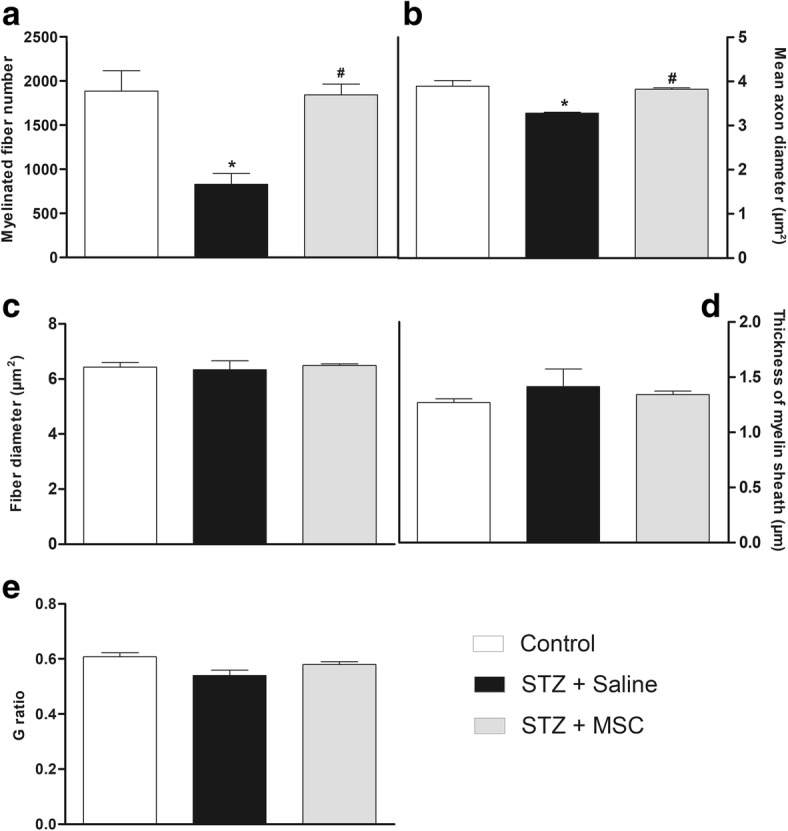
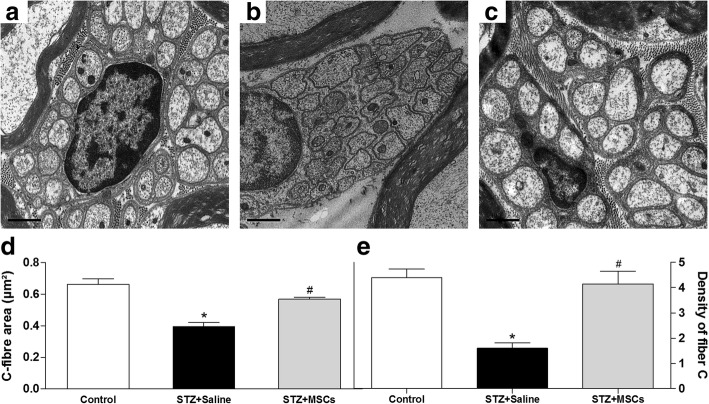
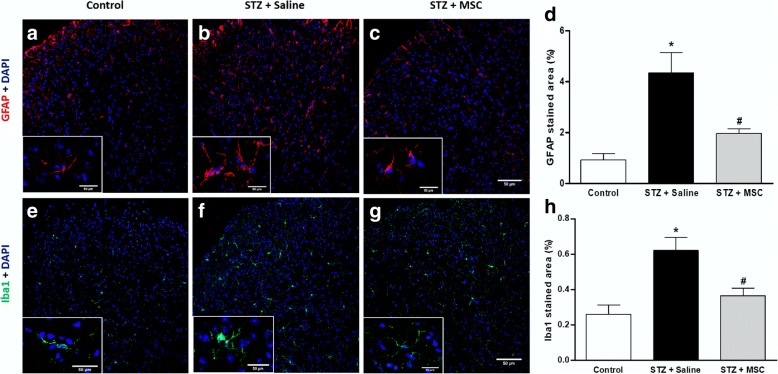
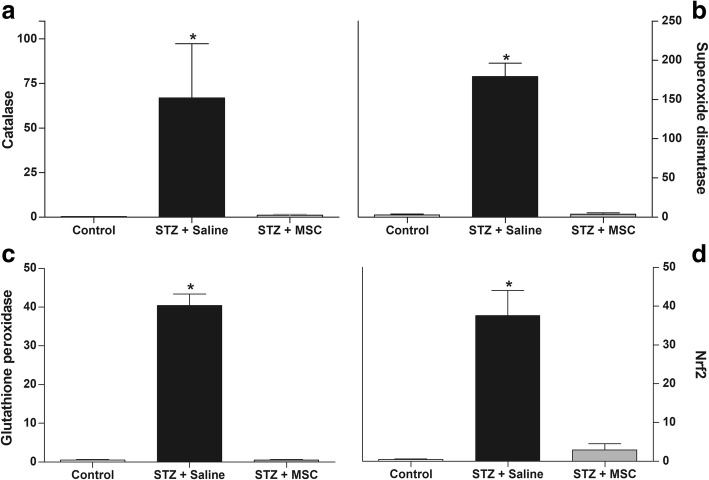
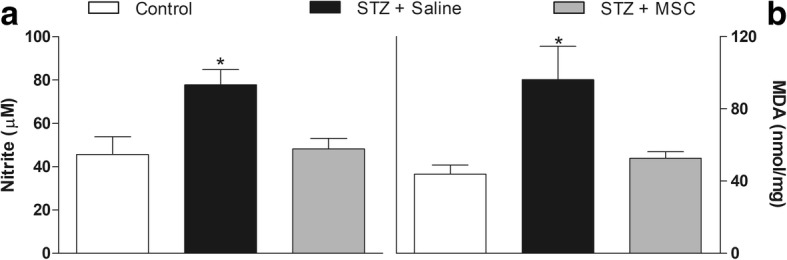
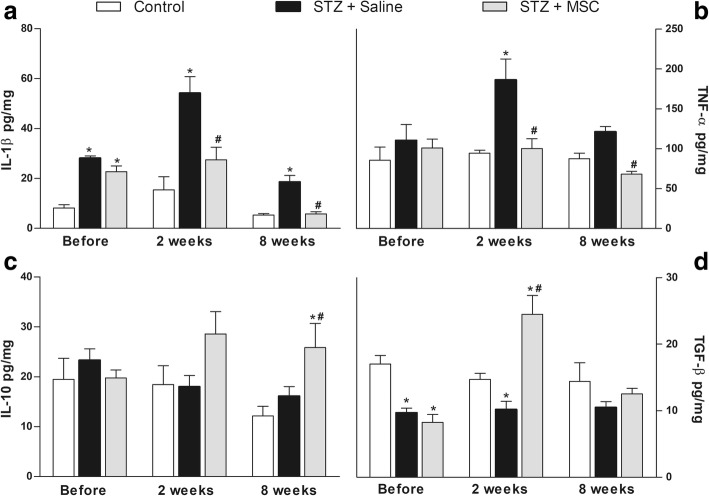
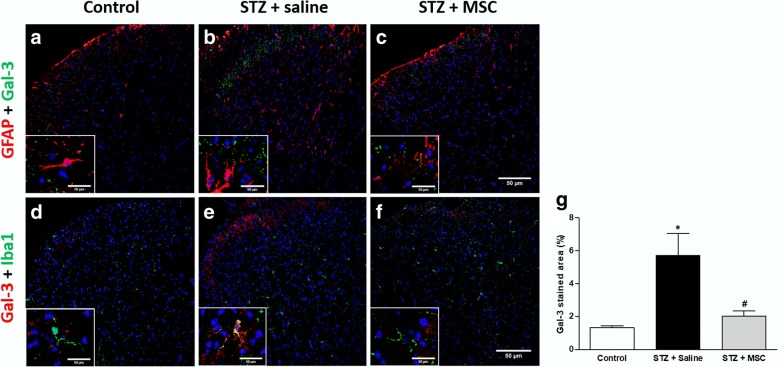
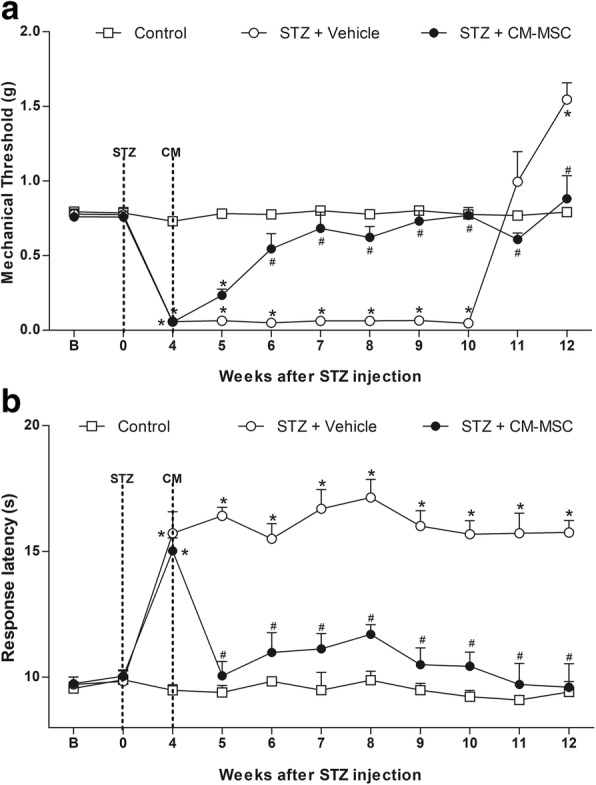
Results: Diabetic mice presented behavioral signs of sensory neuropathy, mechanical allodynia, and heat hypoalgesia, which were completely reversed by a single administration of MSC or CM-MSC. The ultrastructural analysis of the sciatic nerve showed that diabetic mice exhibited morphological and morphometric alterations, considered hallmarks of DN, such as degenerative changes in axons and myelin sheath, and reduced area and density of unmyelinated fibers. In MSC-treated mice, these structural alterations were markedly less commonly observed and/or less pronounced. Moreover, MSC transplantation inhibited multiple parameters of spinal neuroinflammation found in diabetic mice, causing the reduction of activated astrocytes and microglia, oxidative stress signals, galectin-3, IL-1β, and TNF-α production. Conversely, MSC increased the levels of anti-inflammatory cytokines, IL-10, and TGF-β.

Conclusions: The present study described the modulatory effects of MSC on spinal cord neuroinflammation in diabetic mice, suggesting new mechanisms by which MSC can improve DN.

Keywords: Diabetes; Galectin-3; Neuroinflammation; Sensory neuropathy; Spinal cord; Stem cells.


Conflict of interest statement

Ethics approval and consent to participate

Animal care and handling procedures were in accordance with the National Institutes of Health guide for the care and use of Laboratory animals (NIH, 8023) and the Institutional Animal Care and Use Committee FIOCRUZ (CPqGM 025/2011).

Consent for publication

Not applicable.

Competing interests

The authors declare that they have no competing interests.

Publisher’s Note

Springer Nature remains neutral with regard to jurisdictional claims in published maps and institutional affiliations.

Figures

Fig. 1
Fig. 1
Effect of MSC on pain-like behaviors of mice with diabetic neuropathy. a Mechanical nociceptive thresholds: ordinates represent the filament weight (g) in which the animal responds in 50% of presentations. b Thermal nociceptive threshold: the axis of ordinates represents the time (seconds) the animal takes to withdraw its paw. The nociceptive thresholds were assessed in the paw of each mouse before (b) and after the model induction with streptozotocin (STZ; week 0). Control group represents mice without diabetic neuropathy, in which saline was administered instead of streptozotocin. Four weeks after induction, mice were treated via endovenous route with bone marrow-derived mesenchymal cells (STZ + MSC; 1 × 106/100 μL) or vehicle (STZ + saline; 100 μL). Data are expressed as means ± SEM; n = 6 mice per group. *Statistical significance relative to the control group (p < 0.001); #Statistical significance relative to the STZ + saline group (p < 0.001), as determined by two-way ANOVA followed by Bonferroni post-test
Fig. 2
Fig. 2
Effect of MSC on the morphology of sciatic nerve from mice with diabetic neuropathy. Representative photomicrographs of sciatic nerve cross-sections from non-diabetic mice (panel a, control group), diabetic mice treated with saline (panel c), and diabetic mice treated with MSC (1 × 106, panel e), 12 weeks after the neuropathy induction. Light microscopy revealed that sciatic nerve from diabetic mice (c) had large myelin fibers with axonal atrophy, loose myelin sheath (*), and myelin with infoldings into to the axoplasm (arrow). Panel e shows that sciatic nerve from MSC-treated neuropathic mice presented myelin fibers of various calibers with normal morphology. Scale bar = 40 μm. Electron microscopy of sciatic nerve cross-sections from non-diabetic mice (panel b, control group), diabetic mice treated with saline (panel d), and diabetic mice treated with MSC (1 × 106, panel f). Analysis of ultrastructural aspects of the sciatic nerve shows in b myelin fibers with varying sizes and proportional myelin sheath, including numerous unmyelinated fibers; in d few unmyelinated fibers (arrowhead) and the presence of atrophic axons with loose myelin sheath (*); and in f myelinated fibers with myelin sheath of varying diameters and a large amount of unmyelinated fibers (arrowhead). Scale bar = 2 μm. Panels g and h show the percentage of abnormal myelinic fibers and fibers with myelin infoldings, respectively. Data are expressed as means ± SEM; n = 3 mice per group. *Statistically significant as compared to the control group (p < 0.05). #Statistically significant as compared to the STZ + saline group (p < 0.05). One-way ANOVA followed by Tukey’s multiple comparison test
Fig. 3
Fig. 3
Effects of MSC on the morphometry of sciatic nerve myelinic fibers from mice with diabetic neuropathy. Morphometric analyses of sciatic nerve from non-diabetic mice (control group), diabetic mice treated with saline (STZ + saline), and diabetic mice treated with MSC (1 × 106; STZ + MSC), performed 12 weeks after neuropathy induction. Graphs show a myelinated fibers number, b mean axon diameter, c fiber diameter, d thickness of myelin sheath, and e G-ratio (ratio axon/nerve fiber diameter). Data are expressed as means ± SEM; n = 3 mice per group. *Statistical significance compared to control group (p < 0.05). #Statistical significance compared to STZ + saline group (p < 0.05). One-way ANOVA followed by Tukey post-test
Fig. 4
Fig. 4
Effects of MSC on morphology and morphometry of C fibers of the sciatic nerve from mice with diabetic neuropathy. Electron microscopy of sciatic nerve cross-sections from non-diabetic mice (panel a, control), diabetic mice treated with saline (panel b, STZ + saline), and diabetic mice treated with MSC (1 × 106 panel c; STZ + MSC), performed 12 weeks after neuropathy induction. Scale bar = 0.5 μm. Ultrastructural analysis of the sciatic nerve showed the effects of MSC treatment on the area (panel d and density (panel e) of the fiber C of the sciatic nerve of mice with diabetic peripheral neuropathy. Data are expressed as means ± SEM; n = 3 mice per group. *Statistical significance compared to control group (p < 0.05). #Statistical significance compared to STZ + saline group (p < 0.05). One-way ANOVA followed by Tukey post-test
Fig. 5
Fig. 5
MSC transplantation reduce glial cell expression in the dorsal horn of the spinal cord of neuropathic mice. Eight weeks after the treatment with MSC (1 × 106; STZ + MSC) or saline (STZ + saline), glial cell expression in the spinal cord of neuropathic mice was evaluated. Control non-diabetic group received saline instead of streptozotocin. Representative photomicrographs of histological sections of the mouse spinal cord immunolabeled with GFAP (ac) or Iba1 (eg). Images are at 200×. Insets demonstrate representative photomicrographs of GFAP or Iba1 positive cells under magnification of 400×. Scale bar = 50 μm. Panels d and h show the quantitative analysis of the percentage area GFAP and Iba1 positive in the spinal dorsal horn, respectively. Data are expressed as means ± SEM; n = 3 mice per group. *Statistical significance compared to the remaining groups (p < 0.05). One-way ANOVA followed by Tukey post-test
Fig. 6
Fig. 6
Effect of MSC on the antioxidant profile in the spinal cord of mice with diabetic neuropathy. Four weeks after the neuropathy induction, mice were treated with MSC (1 × 106; STZ + MSC) or saline (STZ + saline) by endovenous route. Control non-diabetic group received saline instead of streptozotocin. The spinal levels of mRNA were measured by RT-qPCR 8 weeks after treatment. Panels show the spinal levels of catalase mRNA (a), superoxide dismutase mRNA (b), glutathione peroxidase mRNA (c), and Nrf2 mRNA (d). Data are expressed as means ± SEM; n = 6 mice per group. *Statistical significance compared to the remaining groups (p < 0.001). One-way ANOVA followed by Tukey’s multiple comparison test
Fig. 7
Fig. 7
MSC reduces nitrite and MDA levels in the spinal cord of mice with diabetic neuropathy. Four weeks after neuropathy induction, mice were treated with MSC (1 × 106; STZ + MSC) or saline (STZ + saline) by endovenous route. Control non-diabetic group received saline instead of streptozotocin. The spinal levels of nitrite (a) and MDA (b) were measured 8 weeks after treatments. Data are expressed as means ± SEM; n = 6 mice per group. *Statistical significance compared to the remaining groups (p < 0.05). One-way ANOVA followed by Tukey’s multiple comparison test
Fig. 8
Fig. 8
MSC transplantation modulates cytokine expression in the spinal cord of mice with diabetic neuropathy. Four weeks after the neuropathy induction, mice were treated with MSC (1 × 106; STZ + MSC) or saline (STZ + saline) via endovenous route. Control group received saline instead of streptozotocin. Spinal cytokine levels were evaluated before, 2 and 8 weeks after treatments. Panels show the spinal levels of a interleukin-1β (IL-1β), b tumor necrosis factor-α (TNF-α), c interleukin-10 (IL-10), and d transforming growth factor-β (TGF-β). The results are expressed as picograms of cytokine per milligram of protein. Data are expressed as means ± SEM; n = 6 mice per group. *Statistically significant as compared to the control group (p < 0.001). #Statistical significance in relation to the STZ + saline group (p < 0.05). One-way ANOVA followed by Tukey’s multiple comparison test
Fig. 9
Fig. 9
MSC transplantation reduces galectin-3 expression in the dorsal horn of the spinal cord of neuropathic mice. Eight weeks after the treatment with MSC (1 × 106; STZ + MSC) or saline (STZ + saline), the galectin-3 (Gal-3) expression in the spinal cord of neuropathic mice was evaluated. Control non-diabetic group received saline instead of streptozotocin. Representative photomicrographs of spinal cord sections co-stained with Gal-3 and GFAP (ac) or Gal-3 and Iba-1 (df) (200×). Insets (400×) evidenced the presence of co-staining for Gal-3 and Iba1 (e) in saline-treated diabetic mice and the absence of Gal-3 and GFAP co-stained cells (ac). Scale bar = 50 μm. Panel g shows the quantitative analysis of the percentage area Gal-3 positive in the spinal dorsal horn. Data are expressed as means ± SEM; n = 3 mice per group. *Statistically significant as compared to the control group (p < 0.05). #Statistically significant as compared to the STZ + saline group (p < 0.05). One-way ANOVA followed by Tukey’s multiple comparison test
Fig. 10
Fig. 10
Transplanted MSC tracking. The levels of GFP mRNA were measured by RT-qPCR 24 h, 1 and 3 weeks after MSC treatment. MSC were obtained from GFP transgenic C57Bl/6 mice. Bars show GFP mRNA expression on the dorsal root ganglion (DRG), sciatic nerve, spinal cord, spleen, and lung of transplanted neuropathic mice. Data are expressed as means ± SEM; n = 5 per group for each timepoint. *Statistical significance compared to the remaining groups at the same timepoint (p < 0.005). #Statistical significance compared to the DRG, sciatic nerve, and spinal cord groups at the same timepoint (p < 0.005). One-way ANOVA followed by Tukey’s multiple comparison test
Fig. 11
Fig. 11
Effect of CM-MSC on pain-like behaviors of mice with diabetic neuropathy. a Mechanical nociceptive thresholds: ordinates represent the filament weight (g) in which the animal responds in 50% of presentations. b Thermal nociceptive threshold: the axis of ordinates represents the time (seconds) the animal takes to withdraw its paw. The nociceptive thresholds were assessed in the paw of each mouse before (b) and after the model induction with streptozotocin (STZ; week 0). Control group represents mice without diabetic neuropathy, in which saline was administered instead of streptozotocin. Four weeks after induction, mice were treated via endovenous route with conditioned medium from MSC cultures (STZ + CM-MSC; 100 μL) or vehicle (STZ + vehicle; 100 μL). Data are expressed as means ± SEM; n = 6 mice per group. *Statistical significance relative to the control group (p < 0.001). #Statistical significance relative to the STZ + vehicle group (p < 0.001), as determined by two-way ANOVA followed by Bonferroni post-test

References

    1. Ogurtsova K, da Rocha Fernandes JD, Huang Y, Linnenkamp U, Guariguata L, Cho NH, et al. IDF diabetes atlas: global estimates for the prevalence of diabetes for 2015 and 2040. Diabetes Res Clin Pract. 2017;128:40–50. doi: 10.1016/j.diabres.2017.03.024. - DOI - PubMed
    1. Boulton AJ, Vinik AI, Arezzo JC, Bril V, Feldman EL, Freeman R, et al. Diabetic neuropathies: a statement by the American Diabetes Association. Diabetes Care. 2005;28:956–962. doi: 10.2337/diacare.28.4.956. - DOI - PubMed
    1. Edwards JL, Vincent AM, Cheng HT, Feldman EL. Diabetic neuropathy: mechanisms to management. Pharmacol Ther. 2008;120:1–34. doi: 10.1016/j.pharmthera.2008.05.005. - DOI - PMC - PubMed
    1. Tesfaye S, Boulton AJ, Dyck PJ, Freeman R, Horowitz M, Kempler P, et al. Diabetic neuropathies: update on definitions, diagnostic criteria, estimation of severity, and treatments. Diabetes Care. 2010;33:2285–2293. doi: 10.2337/dc10-1303. - DOI - PMC - PubMed
    1. Waldfogel JM, Nesbit SA, Dy SM, Sharma R, Zhang A, Wilson LM, et al. Pharmacotherapy for diabetic peripheral neuropathy pain and quality of life: a systematic review. Neurology. 2017;88:1958–1967. doi: 10.1212/WNL.0000000000003882. - DOI - PubMed

MeSH terms