

Dynamic Clustering of Dyneins on Axonal Endosomes: Evidence from High-Speed Darkfield Imaging
- PMID: 29933888
- PMCID: PMC6051308
- DOI: 10.1016/j.bpj.2018.05.026
Dynamic Clustering of Dyneins on Axonal Endosomes: Evidence from High-Speed Darkfield Imaging
Abstract
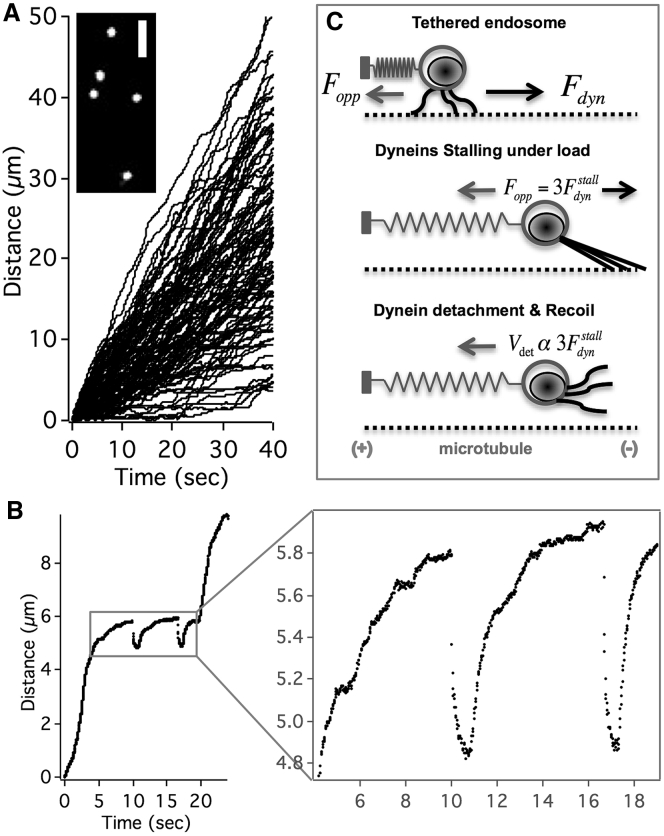
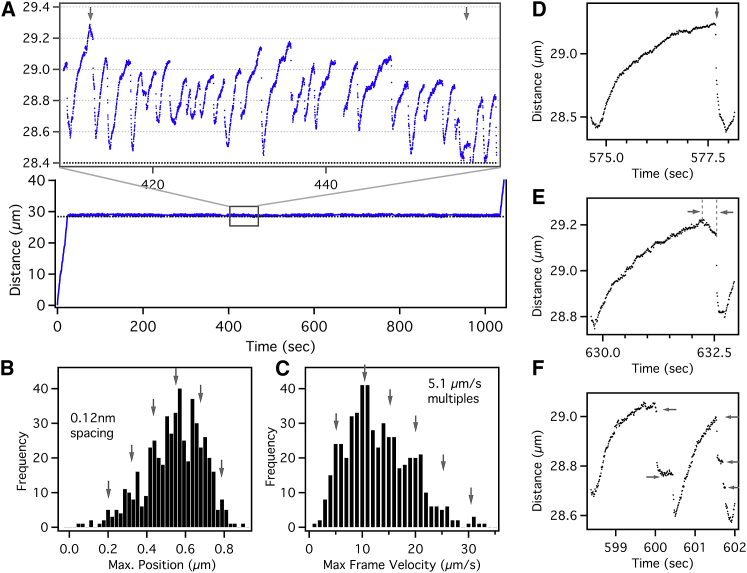
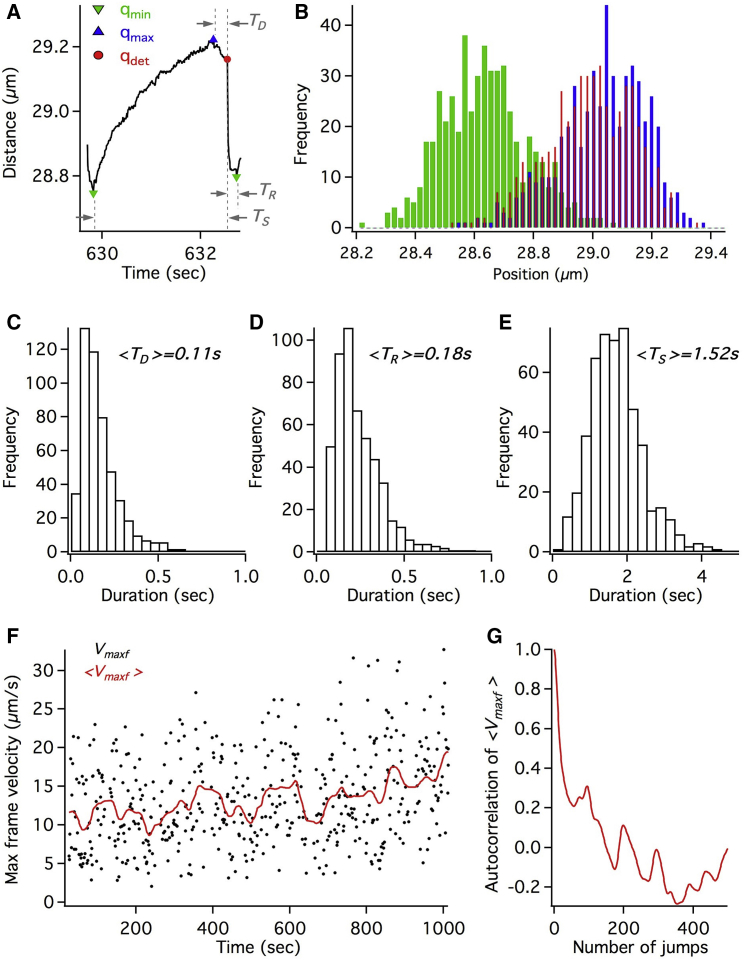
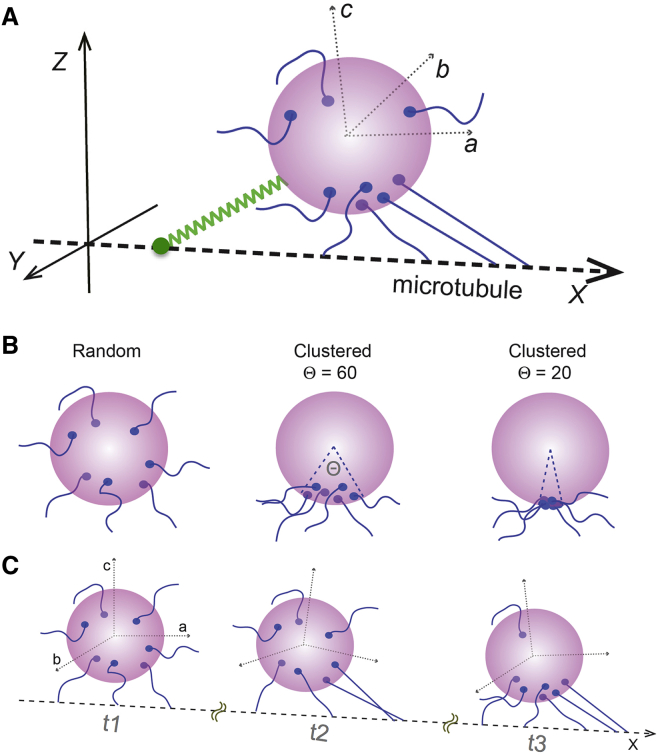
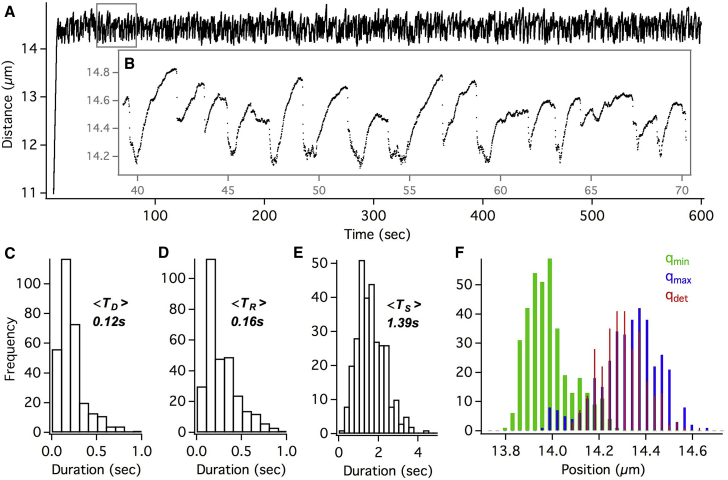
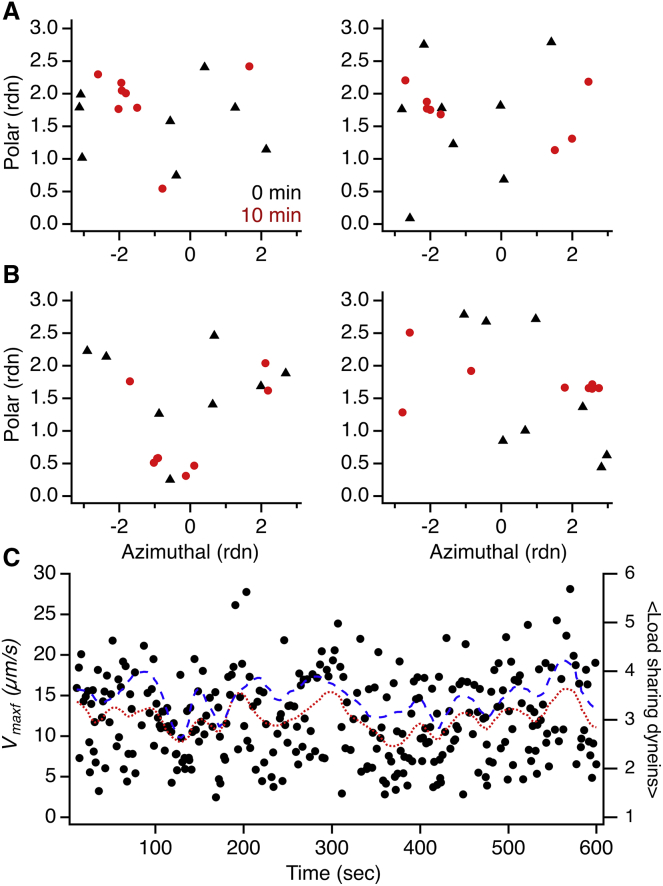
One of the fundamental features that govern the cooperativity of multiple dyneins during cargo trafficking in cells is the spatial distribution of these dyneins on the cargo. Geometric considerations and recent experiments indicate that clustered distributions of dyneins are required for effective cooperation on micron-sized cargos. However, very little is known about the spatial distribution of dyneins and their cooperativity on smaller cargos, such as vesicles or endosomes <200 nm in size, which are not amenable to conventional immunostaining and optical trapping methods. In this work, we present evidence that dyneins can dynamically be clustered on endosomes in response to load. Using a darkfield imaging assay, we measured the repeated stalls and detachments of retrograde axonal endosomes under load with <10 nm localization accuracy at imaging rates up to 1 kHz for over a timescale of minutes. A three-dimensional stochastic model was used to simulate the endosome motility under load to gain insights on the mechanochemical properties and spatial distribution of dyneins on axonal endosomes. Our results indicate that 1) the distribution of dyneins on endosomes is fluid enough to support dynamic clustering under load and 2) the detachment kinetics of dynein on endosomes differs significantly from the in vitro measurements possibly due to an increase in the unitary stall force of dynein on endosomes.
Copyright © 2018. Published by Elsevier Inc.
Figures
Similar articles
-
Nanoparticle-assisted optical tethering of endosomes reveals the cooperative function of dyneins in retrograde axonal transport.Sci Rep. 2015 Dec 10;5:18059. doi: 10.1038/srep18059. Sci Rep. 2015. PMID: 26656461 Free PMC article.
-
Effectiveness of a dynein team in a tug of war helped by reduced load sensitivity of detachment: evidence from the study of bidirectional endosome transport in D. discoideum.Phys Biol. 2012 Aug;9(4):046003. doi: 10.1088/1478-3975/9/4/046003. Epub 2012 Jun 25. Phys Biol. 2012. PMID: 22733140
-
Retrograde NGF axonal transport--motor coordination in the unidirectional motility regime.Biophys J. 2015 Jun 2;108(11):2691-703. doi: 10.1016/j.bpj.2015.04.036. Biophys J. 2015. PMID: 26039170 Free PMC article.
-
Axonal transport: beyond kinesin and cytoplasmic dynein.Curr Opin Neurobiol. 1991 Oct;1(3):393-8. doi: 10.1016/0959-4388(91)90059-g. Curr Opin Neurobiol. 1991. PMID: 1726552 Review.
-
Retrograde signaling via axonal transport through signaling endosomes.J Pharmacol Sci. 2019 Oct;141(2):91-96. doi: 10.1016/j.jphs.2019.10.001. Epub 2019 Oct 17. J Pharmacol Sci. 2019. PMID: 31679963 Review.
Cited by
-
Quantifying Protein Copy Number in Super Resolution Using an Imaging-Invariant Calibration.Biophys J. 2019 Jun 4;116(11):2195-2203. doi: 10.1016/j.bpj.2019.04.026. Epub 2019 May 3. Biophys J. 2019. PMID: 31103226 Free PMC article.
-
Intracellular cargo transport by single-headed kinesin motors.Proc Natl Acad Sci U S A. 2019 Mar 26;116(13):6152-6161. doi: 10.1073/pnas.1817924116. Epub 2019 Mar 8. Proc Natl Acad Sci U S A. 2019. PMID: 30850543 Free PMC article.
-
Diffusion of kinesin motors on cargo can enhance binding and run lengths during intracellular transport.Mol Biol Cell. 2021 Apr 19;32(9):984-994. doi: 10.1091/mbc.E20-10-0658. Epub 2021 Jan 13. Mol Biol Cell. 2021. PMID: 33439674 Free PMC article.
-
Cargo surface fluidity can reduce inter-motor mechanical interference, promote load-sharing and enhance processivity in teams of molecular motors.PLoS Comput Biol. 2022 Jun 8;18(6):e1010217. doi: 10.1371/journal.pcbi.1010217. eCollection 2022 Jun. PLoS Comput Biol. 2022. PMID: 35675381 Free PMC article.
-
The Generation of Dynein Networks by Multi-Layered Regulation and Their Implication in Cell Division.Front Cell Dev Biol. 2020 Jan 31;8:22. doi: 10.3389/fcell.2020.00022. eCollection 2020. Front Cell Dev Biol. 2020. PMID: 32083077 Free PMC article. Review.
References
-
- Holzbaur E.L., Vallee R.B. DYNEINS: molecular structure and cellular function. Annu. Rev. Cell Biol. 1994;10:339–372. - PubMed
-
- Goldstein L.S., Yang Z. Microtubule-based transport systems in neurons: the roles of kinesins and dyneins. Annu. Rev. Neurosci. 2000;23:39–71. - PubMed
-
- Chowdary P.D., Che D.L., Cui B. Neurotrophin signaling via long-distance axonal transport. Annu. Rev. Phys. Chem. 2012;63:571–594. - PubMed
Publication types
MeSH terms
Substances
Grants and funding
LinkOut - more resources
Full Text Sources
Other Literature Sources
