. 2018 Sep 3;217(9):3183-3201.
doi: 10.1083/jcb.201710058. Epub 2018 Jun 22.

p190 RhoGAP promotes contact inhibition in epithelial cells by repressing YAP activity

Affiliations

p190 RhoGAP promotes contact inhibition in epithelial cells by repressing YAP activity

Scott R Frank et al. J Cell Biol. .

Erratum in

Abstract

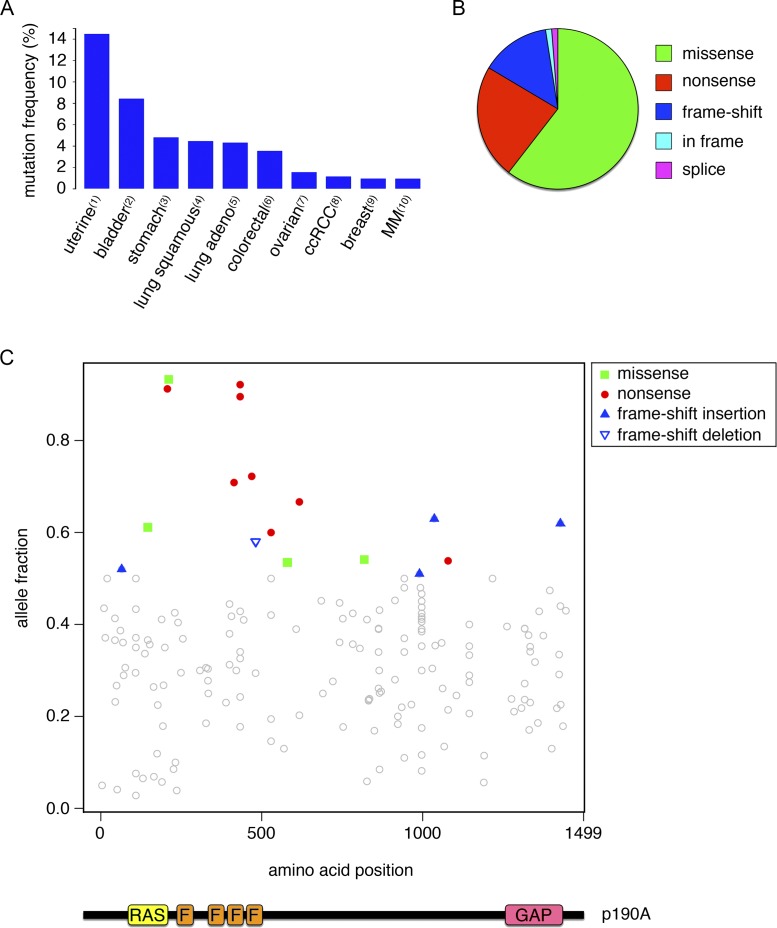
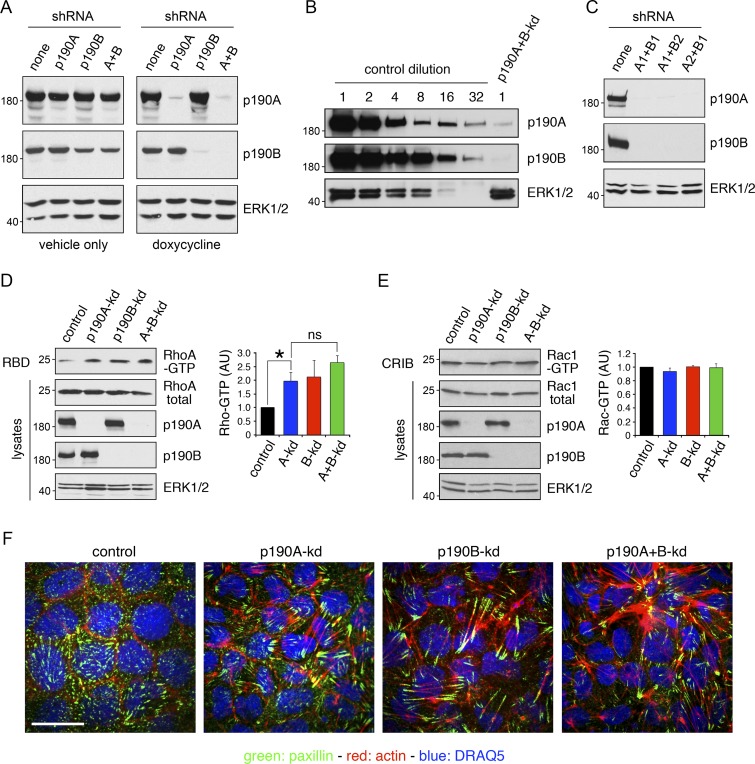
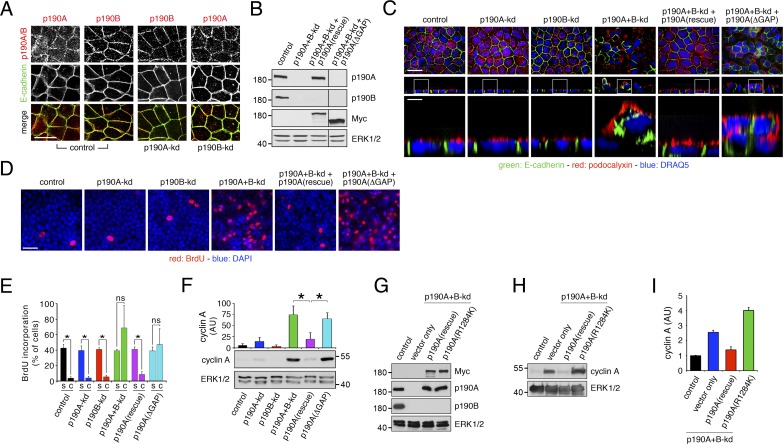
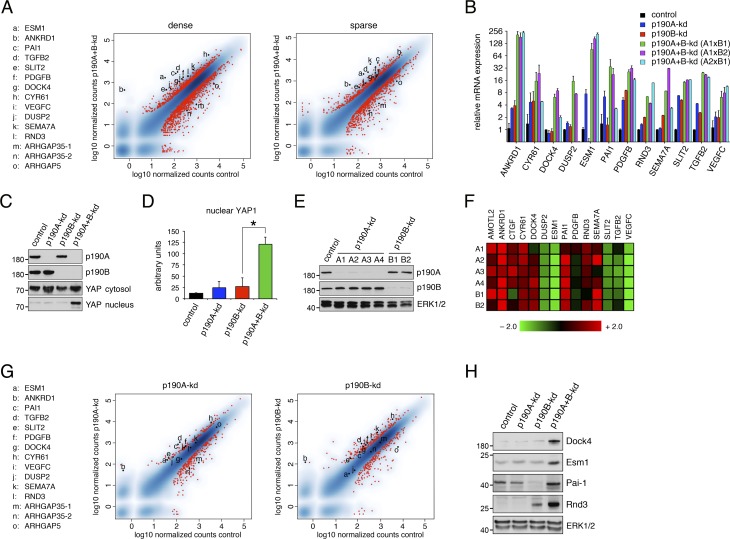
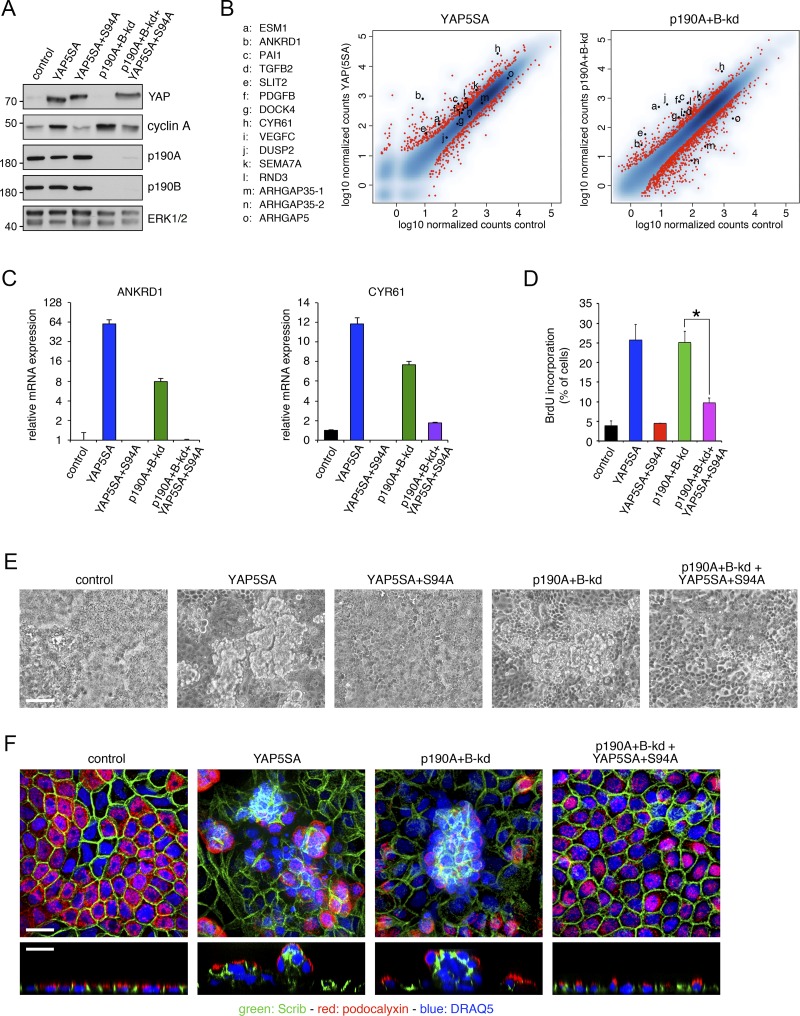
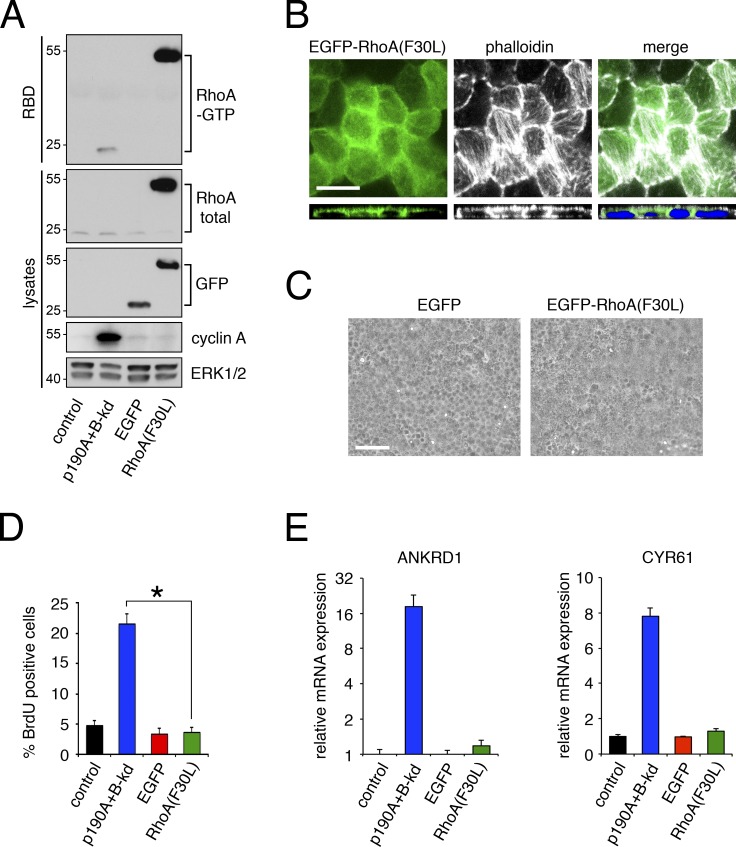
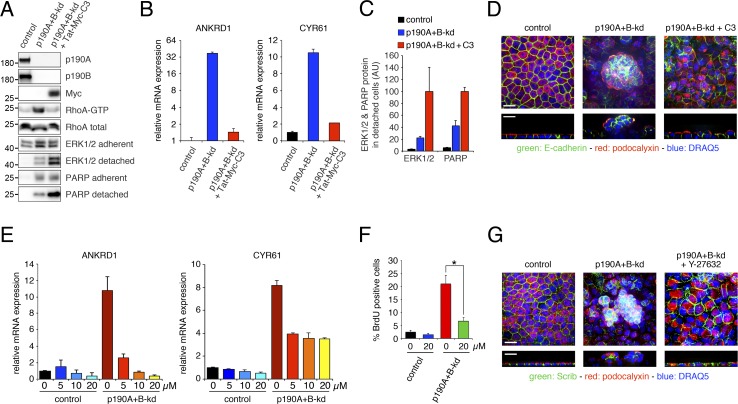
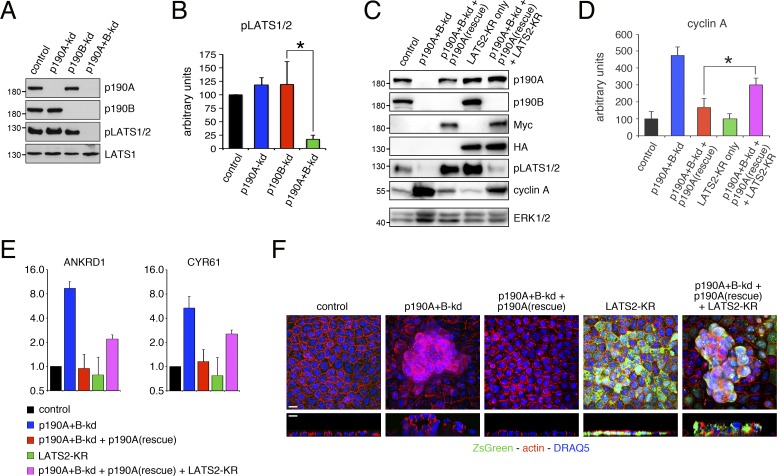
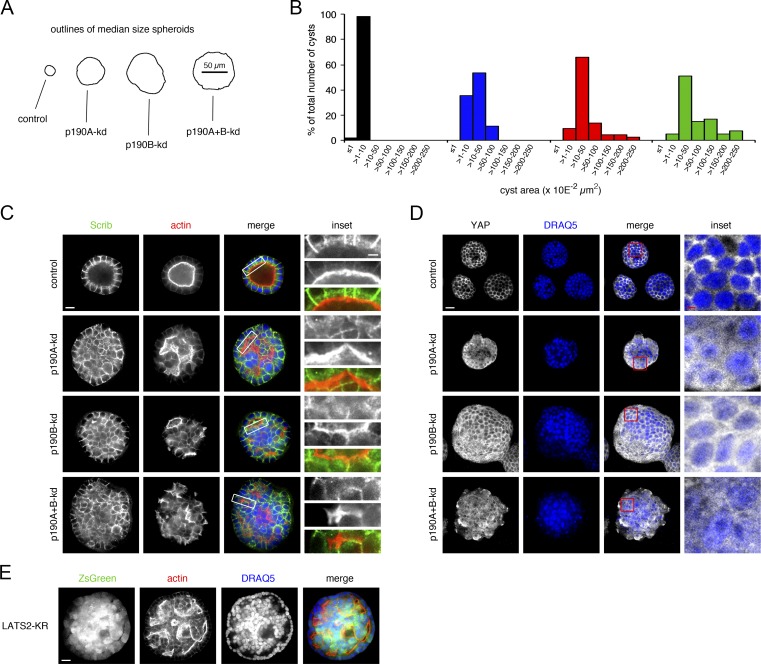
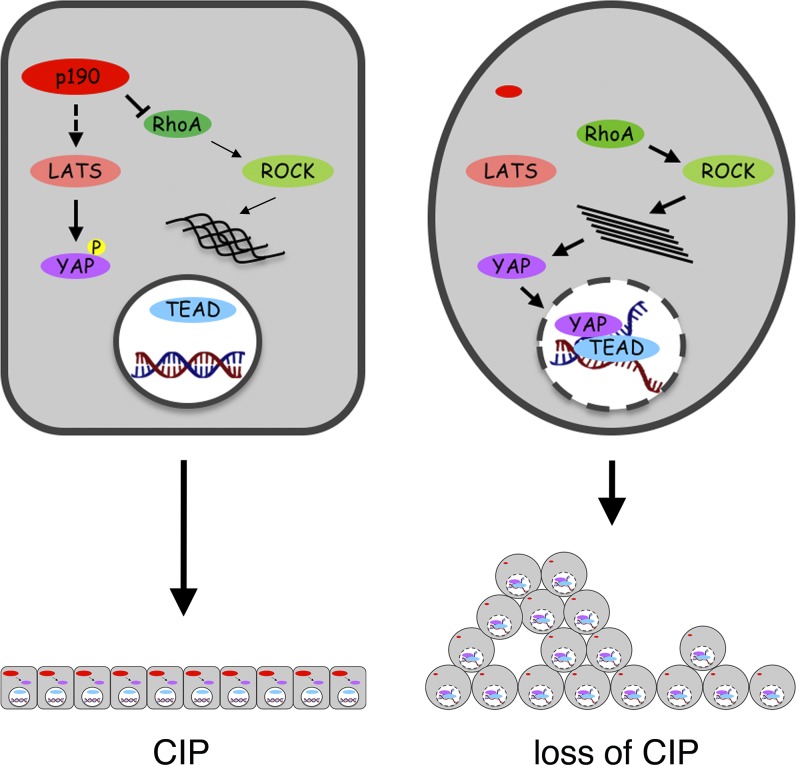
ARHGAP35 encoding p190A RhoGAP is a cancer-associated gene with a mutation spectrum suggestive of a tumor-suppressor function. In this study, we demonstrate that loss of heterozygosity for ARHGAP35 occurs in human tumors. We sought to identify tumor-suppressor capacities for p190A RhoGAP (p190A) and its paralog p190B in epithelial cells. We reveal an essential role for p190A and p190B to promote contact inhibition of cell proliferation (CIP), a function that relies on RhoGAP activity. Unbiased mRNA sequencing analyses establish that p190A and p190B modulate expression of genes associated with the Hippo pathway. Accordingly, we determine that p190A and p190B induce CIP by repressing YAP-TEAD-regulated gene transcription through activation of LATS kinases and inhibition of the Rho-ROCK pathway. Finally, we demonstrate that loss of a single p190 paralog is sufficient to elicit nuclear translocation of YAP and perturb CIP in epithelial cells cultured in Matrigel. Collectively, our data reveal a novel mechanism consistent with a tumor-suppressor function for ARHGAP35.


Figures

Figure 1.
Figure 1.
Mutations in ARHGAP35 encoding p190A in human cancer. (A) Frequency distribution of ARHGAP35 mutations in different types of human cancer. Numbers refer to the following published studies: (1) Kandoth et al. (2013); (2) Cancer Genome Atlas Research Network (2014); (3) Bass et al. (2014); (4) Collisson et al. (2014); (5) Cancer Genome Atlas Research Network (2012); (6) Cancer Genome Atlas Network (2012); (7) Bell et al. (2011); (8) Cancer Genome Atlas Research Network (2013); (9) Cancer Genome Atlas Network (2012); (10) Lohr et al. (2014). MM, multiple myeloma. (B) Pie chart illustrating relative frequencies of missense, nonsense, and frame-shift mutations as well as in-frame deletions and splice mutations in ARHGAP35 mutations in human cancer. (C) Diagram illustrating the location of p190A mutations and relative frequencies of corresponding mutant ARHGAP35 alleles in tumor samples. Each point in the figure indicates an individual somatic mutation from a dataset derived from ∼5,000 cancer patients. The allele fraction of a given mutation is estimated based on the ratio between read counts of the alternative alleles versus the total read counts including both alternative alleles and reference alleles. We highlight mutations with loss-of-function consequences (missense and nonsense/frameshift indel) with allelic fraction >0.5. RAS, GTPase domain; F, FF motifs; GAP, GAP domain.
Figure 2.
Figure 2.
p190A and/or p190B repress Rho signaling in epithelial cells. (A) MDCK TR-T10 cells expressing inducible shRNAs targeting p190A and/or p190B. Cells were incubated with either vehicle or doxycycline (dox) to induce knockdown of gene expression. Cells were cultured for 3 d at sparse density to achieve optimal knockdown followed by 5 d at high density. Whole-cell lysates were then subjected to Western blotting to detect p190A, p190B, or ERK1/2. All other figures show data from doxycycline-treated cells only. (B) Whole-cell lysates from control cells were subjected to serial twofold dilution. These samples, along with undiluted lysates from p190A+B-kd cells, were processed for Western blotting to detect p190A, p190B, and ERK1/2. (C) Knockdown of gene expression using different combinations of shRNAs targeting p190A or p190B. (D) Effects of p190A and/or p190B depletion on cellular RhoA-GTP levels were measured by a Rhotekin–RBD pulldown assay. Data are presented as mean ± SD (n = 3); *, P < 0.05 (n = 3). (E) Rac1-GTP levels in cells with p190A-kd and/or p190B-kd were determined by a PAK3-CRIB pulldown assay. Data are presented as mean ± SD (n = 3); *, P < 0.05 (n = 3). Molecular masses are given as kilodaltons. (F) Control, p190A-kd, p190B-kd, or p190A+B-kd cells were processed to localize the focal adhesion constituent paxillin (green), incubated with Alexa Fluor 594–phalloidin to detect polymerized actin (red), and stained with the DNA-intercalating dye DRAQ5 to show nuclei (blue). Bar, 10 µm.
Figure 3.
Figure 3.
p190A and p190B are essential for CIP in epithelial cells. (A) p190A and p190B localize in part to adherence junctions in MDCK cells grown on permeable supports. Knockdown of p190A and/or p190B was achieved as described in the legend to Fig. 1 A. Cells were then fixed and labeled to detect E-cadherin (green) and p190A or p190B (red). Bar, 10 µm. (B) Expression of knockdown-resistant Myc-tagged p190A or p190A(ΔGAP), which is missing the C-terminal GAP-domain, in p190A+B-kd cells. Whole-cell lysates were processed for Western blotting to detect p190A, p190B, Myc epitope, and ERK. The lines between lanes 3 and 4 indicate omission of two lanes from the original gel. The omitted lanes contained samples with additional clones expressing knockdown-resistant Myc-tagged p190A or p190A(ΔGAP). (C) Depletion of p190A and p190B together, but not individually, elicits cell multilayering. Exogenous expression of knockdown-resistant Myc-tagged p190A, but not a mutant from which the C-terminal GAP domain is deleted, restores normal epithelial architecture. Cells were labeled to localize E-cadherin (green) and podocalyxin (red); nuclei were stained with DRAQ5 (blue). Bars: (low magnification) 10 µm; (high magnification) 2 µm. (D) BrdU incorporation (red) in dense cultures of control, p190A-kd, p190B-kd, or p190A+B-kd cells as well as in p190A+B-kd cells expressing knockdown-resistant full-length p190A or GAP-deficient p190A(ΔGAP). Samples were counterstained with DAPI (blue) to detect cell nuclei. Bar, 20 µm. (E) Quantification of BrdU incorporation data are presented as mean ± SD (n = 3); *, P < 0.01. s, subconfluent culture; c, confluent culture. (F) Cyclin A expression in dense cultures of control, p190A-kd, p190B-kd, or p190A+B-kd cells with or without expression of knockdown-resistant p190A or p190A(ΔGAP). Whole-cell lysates were processed for Western blotting to detect cyclin A and ERK. Data are presented as mean ± SD (n = 4); *, P < 0.02. (G) Expression of Myc-tagged, knockdown-resistant, WT, or catalytically inactive p190A(R1284K) in MDCK cells depleted of p190A and p190B. Western blotting of whole-cell lysates was performed to detect Myc-epitope, p190A, p190B, and ERK1/2. (H) Cyclin A expression in whole-cell lysates from control and p190A+B-kd cells transduced with empty vector, Myc-tagged WT, or catalytically inactive p190A(R1284K). Molecular masses are given as kilodaltons. (I) Quantification by densitometry of cyclin A levels from the conditions described in H. The histograms show mean ± SD (n = 4).
Figure 4.
Figure 4.
p190A and p190B repress expression of genes associated with the Hippo pathway. (A) Genome-wide mRNA-seq analyses from MDCK cells depleted of p190A and p190B expression reveal strong induction of genes associated with Hippo signaling in both dense and sparse cultures. The data are represented as x–y plots with relative gene expression levels in control cells and p190A+B-kd cells on the abscissa and ordinate, respectively. Red dots correspond with individual genes with differential gene expression between p190A+B-kd and control cells using a threshold of log2(fold change) ≥1 and adjusted P value ≤0.05. Genes selected for further validation as well as ARHGAP35 (two splice forms) and ARHGAP5 genes encoding p190A and p190B, respectively, are listed as a–o and marked individually as black dots. (B) Validation of transcriptomes from dense cultures of control, p190A-kd, p190B-kd, and p190A+B-kd cells by qPCR analysis. p190A and p190B depletion was achieved by three distinct combinations of shRNAs targeting p190A and p190B. Data are presented as mean ± SD (n = 3). (C) Knockdown of p190A and p190B promotes nuclear accumulation of YAP as determined by Western blotting to detect YAP1 in the nuclear fractions as well as p190A, p190B, and total YAP1 in the cytosolic fraction. (D) Quantification of nuclear YAP1 levels in dense cultures of control, p190A-kd, p190B-kd, or p190A+B-kd cells. Data are presented as mean ± SD (n = 4); *, P < 0.02. (E) Depletion of p190A or p190B in HEC-1-A uterine carcinoma cells as determined by Western blotting to detect p190A, p190B, and ERK. (F) Heat map representing relative fold change (linear scale) in gene expression levels in HEC-1-A cells depleted of p190A or p190B. Four distinct shRNAs (A1–A4) targeting p190A and two distinct shRNAs (B1 and B2) targeting p190B were used in this experiment. (G) Transcriptomes from MDCK cells depleted of either p190A or p190B expression show modest induction of Hippo-associated genes relative to control cells. The data are presented as described in A. Knockdown of either p190A or p190B expression was induced for 3 d at sparse cell density followed by replating at high cell density and continued culture for another 3 d, after which gene expression analysis was performed. The red dots correspond with individual genes with differential gene expression between p190A-kd or p190B-kd and control cells using a threshold of |log2(fold change)| ≥1 and adjusted P value ≤0.05. Genes are listed as a–o and marked individually as described in A. (H) Validation of gene expression elicited by depletion of p190A and/or p190B by Western blotting using antibodies specific for Dock4, Esm1, Pai-1, and Rnd3 with ERK1/2 as control for equal protein loading. Molecular masses are given as kilodaltons.
Figure 5.
Figure 5.
p190A and p190B promote CIP by repressing YAP-mediated gene transcription. (A) Expression of constitutively active YAP5SA or dominant-negative YAP5SA+S94A in control and p190A+B-kd MDCK cells. Western blotting of whole-cell lysates was performed to detect YAP1, cyclin A, p190A, p190B, and ERK. Molecular masses are given as kilodaltons. (B) mRNA-seq transcriptomes from dense cultures of MDCK cells expressing constitutively active YAP5SA and from p190A+B-kd cells were derived from samples processed concomitantly to permit direct comparison. The data are represented as described in the legend to Fig. 5 A. (C) qPCR analysis of ANKRD1 and CYR61 expression in control and p190A+B-kd cells with or without expression of YAP5SA or YAP5SA+S94A. Data are presented as mean ± SD (n = 3). (D) BrdU incorporation in dense cultures of control and p190A+B-kd cells with or without expression of YAP5SA or YAP5SA+S94A. Data are presented as mean ± SD (n = 4); *, P < 0.01. (E) Phase-contrast imaging of control, YAP5SA, YAP5SA+S94A, and p190A+B-kd cells as well as p190A+B-kd cells expressing YAP5SA+S94A. Bar, 50 µm. (F) Confocal microscopy of control, YAP5SA, and p190A+B-kd cells as well as p190A+B-kd cells expressing YAP5SA+S94A. Cells were labeled to detect Scrib (green) and podocalyxin (red), and nuclei were stained with DRAQ5 (blue). Bars, 10 µm.
Figure 6.
Figure 6.
Active RhoA is not sufficient to perturb CIP or induce expression of YAP-regulated genes. (A) RhoA-GTP levels in MDCK cells expressing EGFP-tagged fast-cycling RhoA(F30L) or EGFP only relative to p190A+B-kd or control cells. GTP-bound RhoA was precipitated by a Rhotekin–RBD pulldown assay followed by immunoblotting to detect active and total RhoA as well as GFP, cyclin A, and ERK. Molecular masses are given as kilodaltons. (B) Effects of expressing EGFP-RhoA(F30L) (green) on actin stress fiber formation detected by staining with Alexa Fluor 594–phalloidin (white). Nuclei were labeled with DRAQ5 (blue). Bar, 10 µm. (C) Phase images of cells expressing EGFP-RhoA(F30L) or EGFP only. Bar, 50 µm. (D) BrdU incorporation in dense monolayers of cells expressing EGFP-RhoA(F30L) or EGFP only. p190A+B-kd and control cells were included for comparison. Data are presented as mean ± SD (n = 4); *, P < 0.02. (E) qPCR analysis of ANKRD1 and CYR61 expression in cells expressing EGFP-RhoA(F30L) or EGFP only relative to p190A+B-kd or control cells. Data are presented as mean ± SD (n = 3).
Figure 7.
Figure 7.
RhoROCK signaling promotes YAP-mediated gene transcription and loss of CIP in cells depleted of p190A and p190B. (A) Delivery of Tat-Myc-C3 transferase (Tat-Myc-C3) protein to p190A+B-kd cells. Control or p190A+B-kd cells were incubated with estimated equal amount of GST only or cleaved Tat-Myc-C3 for 18 h. Western blotting of whole-cell lysates was performed to detect Tat-Myc-C3 protein as well as p190A, p190B, RhoA, ERK1/2, and cleaved PARP fragment. Lysates of detached cells and cellular fragments were processed for Western blotting to detect ERK1/2 and cleaved PARP fragment. Moreover, RBD pulldown was performed to detect levels of Rho-GTP in parallel cultures. Molecular masses are given as kilodaltons. (B) qPCR analysis of ANKRD1 and CYR61 expression in control and p190A+B-kd cells with or without uptake of Tat-Myc-C3 protein. Data are presented as mean ± SD (n = 3). (C) Quantification by densitometry of relative amounts of ERK1/2 and cleaved PARP protein in medium harvested from control and p190A+B-kd cells incubated with GST only or cleaved Tat-Myc-C3. (D) Confocal microscopy of control and p190A+B-kd cells with or without incubation with Tat-Myc-C3 protein. Cells were labeled to detect E-cadherin (green) and podocalyxin (red), and nuclei were stained with DRAQ5 (blue). (E) qPCR analysis of mRNA levels in control and p190A+B-kd cells treated with 0–20 µM ROCK inhibitor Y-27632 for 24 h. (F) BrdU incorporation in control or p190A+B-kd cells incubated with 0 or 20 µM Y27632 for 3 d at low cell density followed by 5 d at high cell density. Data are presented as mean ± SD (n = 4); *, P < 0.02. (G) Confocal microscopy of control and p190A+B-kd cells as well as p190A+B-kd cells treated with 20 µM Y-27632 during 5 d of culturing on permeable supports. Bars, 10 µm.
Figure 8.
Figure 8.
p190A and p190B activate LATS, and p190A promotes CIP in a LATS-dependent manner. (A) Depletion of p190A and p190B inactivates LATS. pLATS1/2 refers to both LATS1(pS909) and LATS2(pS872) because the antibody does not distinguish between the two paralogs. (B) Quantification of phospho-LATS1/2 levels in dense cultures of control, p190A-kd, p190B-kd, or p190A+B-kd cells. (C) Expression of knockdown-resistant p190A in p190A+B-kd cells promotes CIP in a LATS-dependent manner. Molecular masses are given as kilodaltons. (D) Quantification of cyclin A levels in control and p190A+B-kd cells with or without expression of knockdown-resistant p190A and with and without expression of kinase-dead LATS2(K655R) (LATS2-KR). Data are presented as mean ± SD (n = 4); *, P < 0.02. (E) qPCR analysis of ANKRD1 and CYR61 expression in control and p190A+B-kd cells with or without expression of LATS2-KR. Data are presented as mean ± SD (n = 3). (F) Confocal microscopy of control and p190A+B-kd cells without or with expression of knockdown-resistant p190A as well as with and without expression of LATS2-KR. Cells were stained with Alexa Fluor 594–phalloidin and DRAQ5 to detect polymerized actin (red) and nuclei (blue). Cells expressing LATS2-KR coexpress ZsGreen from an IRES cassette (green). Bars, 10 µm.
Figure 9.
Figure 9.
Both p190 RhoGAP paralogs are required for normal epithelial architecture of MDCK cells propagated in Matrigel. (A) Outlines of median-size spheroids derived from MDCK cells with or without depletion of p190A and/or p190B cultured in Matrigel for 14 d. (B) Size (area) distribution of spheroids with or without p190A and/or p190B knockdown after 14 d of culture in Matrigel. The areas from ≥40 cysts from each condition were measured. (C) Immunolabeling for Scrib (green) and phalloidin staining to detect polymerized actin (red) in spheroids with or without p190A and/or p190B depletion after 10 d of culture in Matrigel. Nuclei were stained with DRAQ5 (blue). Bars: (low magnification) 10 µm; (inset) 2.5 µm. (D) Localization of YAP in MDCK cell spheroids with or without knockdown of p190A and/or p190B after 14 d of culture in Matrigel. The images for YAP (white) were superimposed on the DRAQ5 stain (blue) using the screen function in Photoshop. Optical sections close to the perimeter of spheroids are shown. Bars: (low magnification) 20 µm; (inset) 5 µm. (E) Staining of LATS2-KR–expressing MDCK cells cultured for 14 d in Matrigel with Alexa Fluor 594–phalloidin to detect polymerized actin (red) and DRAQ5 to label nuclei (red). LATS2 and ZsGreen are coexpressed from a bicistronic vector. Bar, 20 µm.
Figure 10.
Figure 10.
Model illustrating the role of p190 RhoGAPs to promote CIP by repressing YAP activity. This cartoon summarizes our findings for how p190A and p190B modulate CIP through effects on YAP-regulated gene transcription in MDCK cells cultured on permeable supports. Left: A cell with normal expression of p190A and p190B. The activities of p190 RhoGAPs in this context are dual. The catalytic function of p190 proteins represses Rho–ROCK signaling to attenuate mechanotransduction signals. Concomitantly, most likely through scaffolding activities, p190 proteins inhibit LATS activation. The net result is repression of YAP activation and YAP–TEAD-regulated gene transcription to promote CIP. Right: A cell depleted of p190A and p190B. In this cell, LATS is inactive, which combined with potent mechanotransduction signaling leads to YAP activation, transcription of YAP–TEAD-regulated genes, and escape from CIP, resulting in cell multilayering at high cell density. Importantly, inhibition of LATS signaling as well as Rho–ROCK activation is required to reach a threshold sufficient to trigger escape from CIP. The relative importance of the dual regulation may be context dependent.

Similar articles

Cited by

References

    1. Aragona M., Panciera T., Manfrin A., Giulitti S., Michielin F., Elvassore N., Dupont S., and Piccolo S.. 2013. A mechanical checkpoint controls multicellular growth through YAP/TAZ regulation by actin-processing factors. Cell. 154:1047–1059. 10.1016/j.cell.2013.07.042 - DOI - PubMed
    1. Arthur W.T., and Burridge K.. 2001. RhoA inactivation by p190RhoGAP regulates cell spreading and migration by promoting membrane protrusion and polarity. Mol. Biol. Cell. 12:2711–2720. 10.1091/mbc.12.9.2711 - DOI - PMC - PubMed
    1. Bass A.J., Thorsson V., Shmulevich I., Reynolds S.M., Miller M., Bernard B., Hinoue T., Laird P.W., Curtis C., Shen H., et al. Cancer Genome Atlas Research Network . 2014. Comprehensive molecular characterization of gastric adenocarcinoma. Nature. 513:202–209. 10.1038/nature13480 - DOI - PMC - PubMed
    1. Baum B., and Georgiou M.. 2011. Dynamics of adherens junctions in epithelial establishment, maintenance, and remodeling. J. Cell Biol. 192:907–917. 10.1083/jcb.201009141 - DOI - PMC - PubMed
    1. Bell D., Berchuck A., Birrer M., Chien J., Cramer D.W., Dao F., Dhir R., DiSaia P., Gabra H., Glenn P., et al. Cancer Genome Atlas Research Network . 2011. Integrated genomic analyses of ovarian carcinoma. Nature. 474:609–615. 10.1038/nature10166 - DOI - PMC - PubMed

Publication types

MeSH terms

Substances

LinkOut - more resources