. 2018 Jul 25;38(30):6700-6721.
doi: 10.1523/JNEUROSCI.0672-18.2018. Epub 2018 Jun 22.

PTPσ Drives Excitatory Presynaptic Assembly via Various Extracellular and Intracellular Mechanisms

Affiliations

PTPσ Drives Excitatory Presynaptic Assembly via Various Extracellular and Intracellular Mechanisms

Kyung Ah Han et al. J Neurosci. .

Abstract

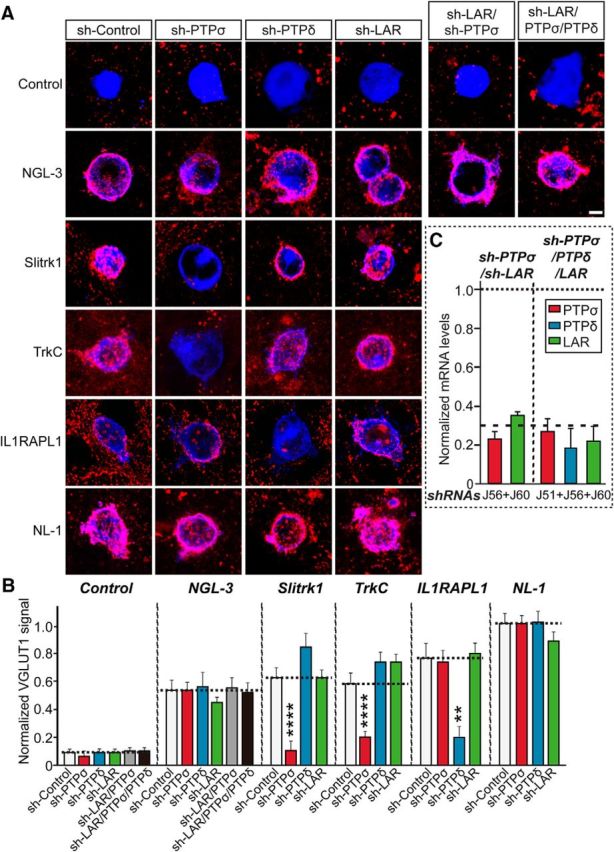
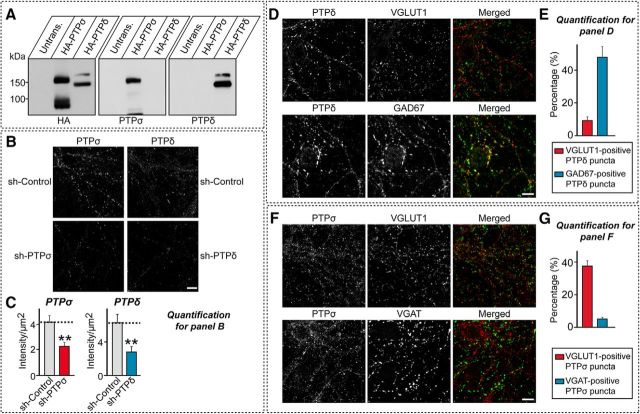
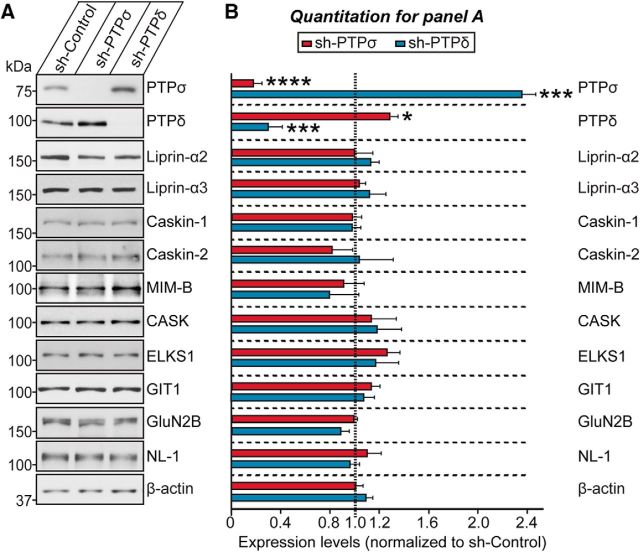
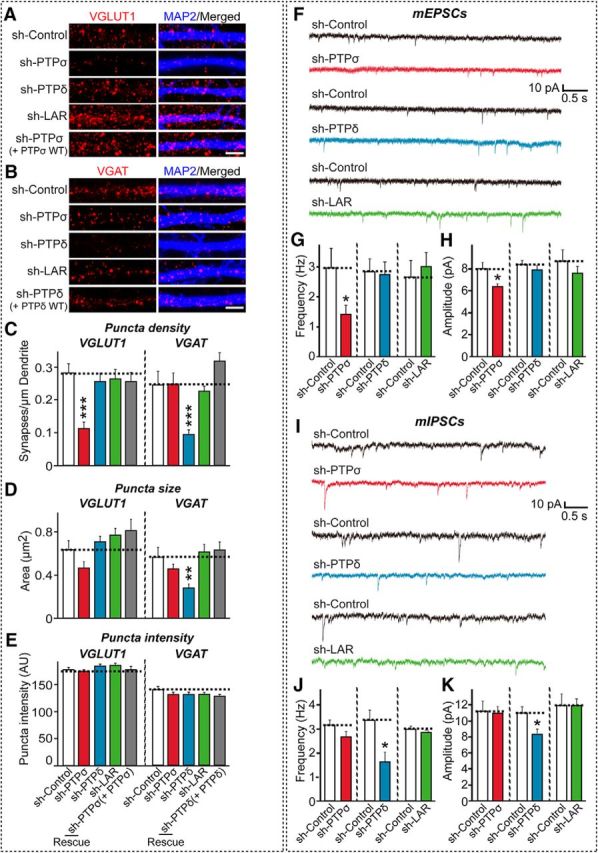
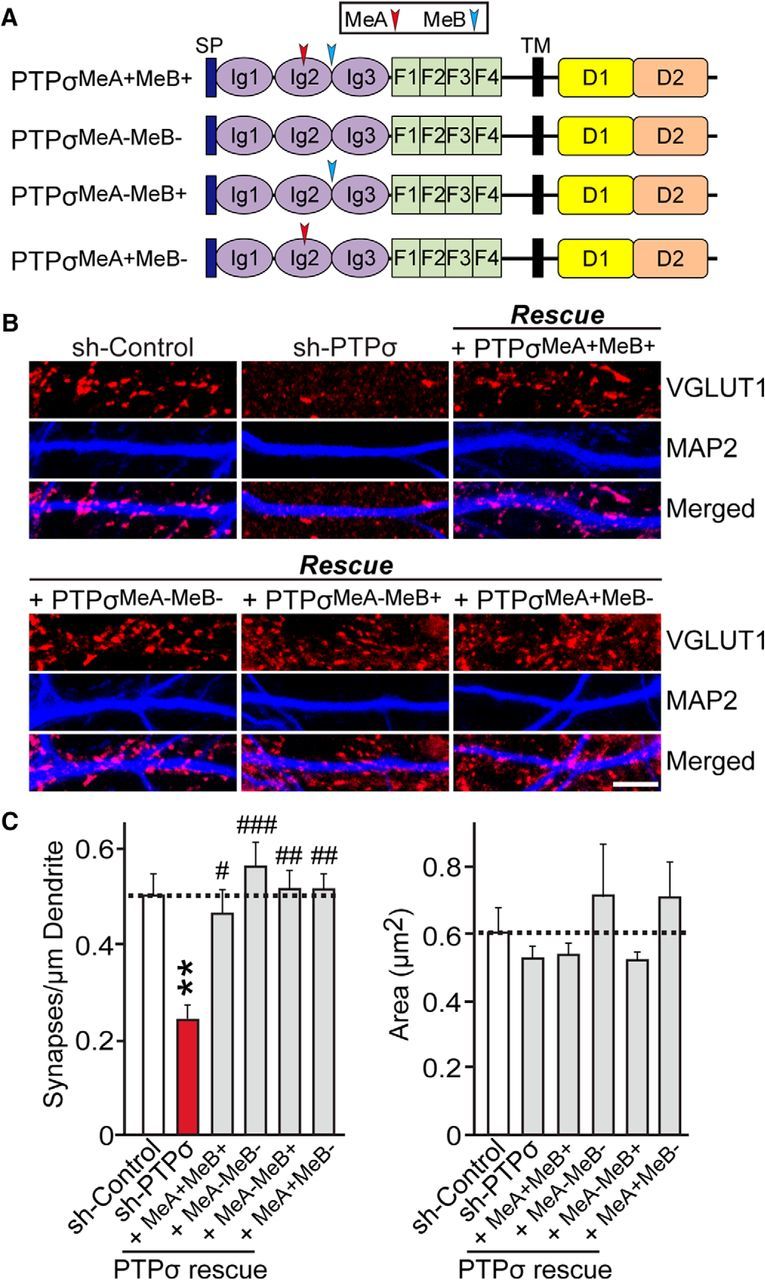
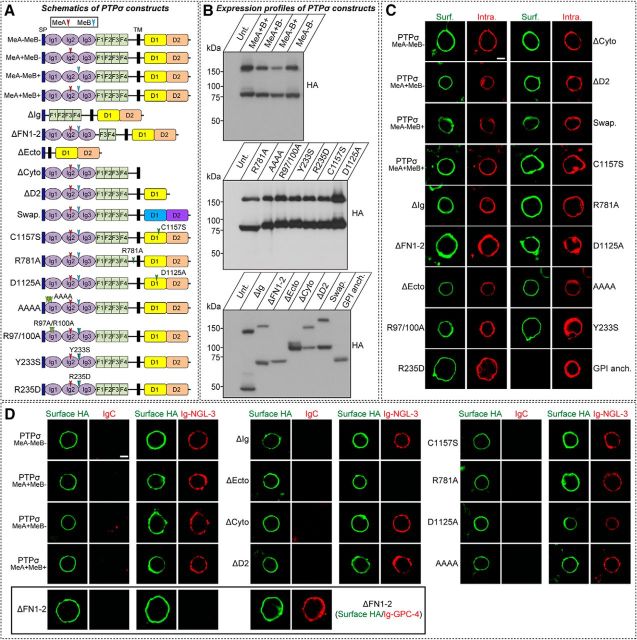
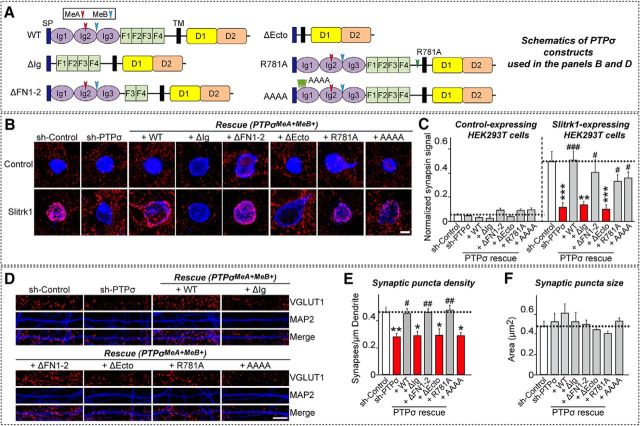
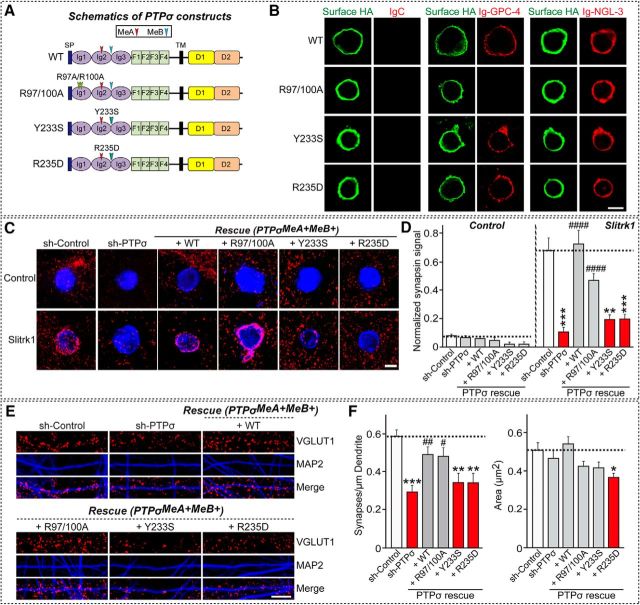
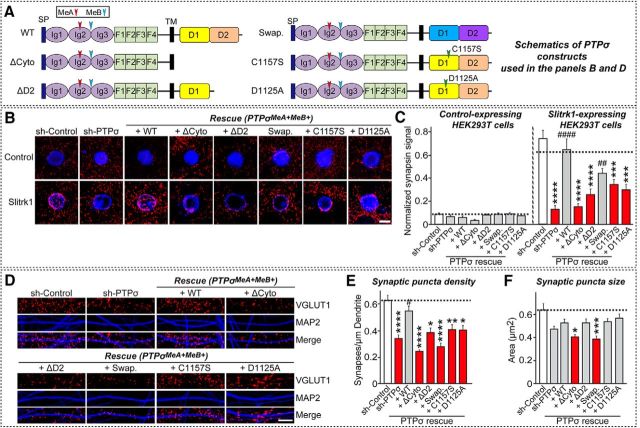
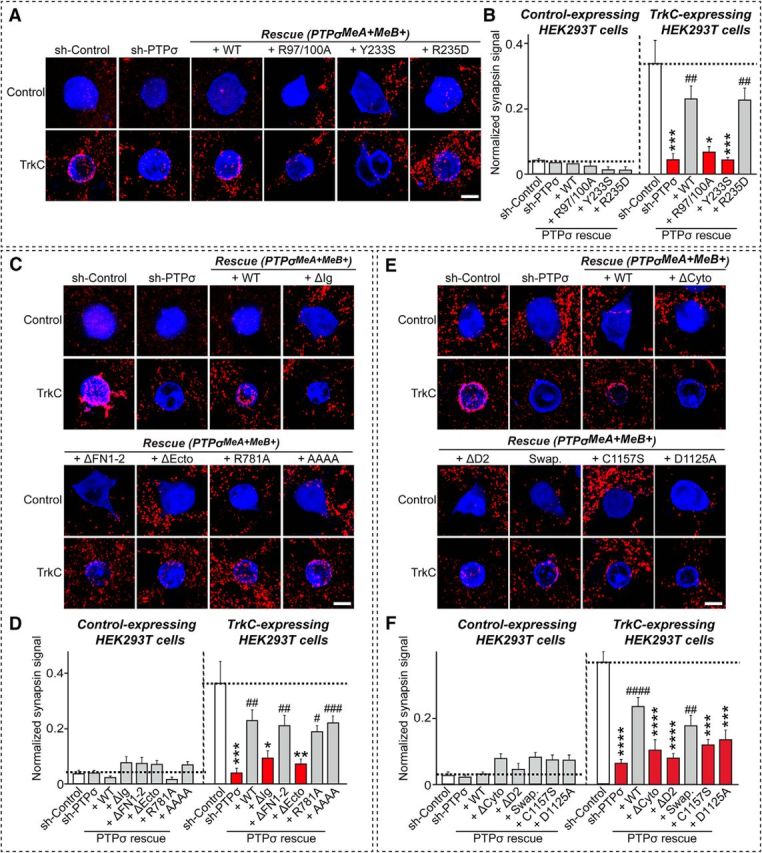
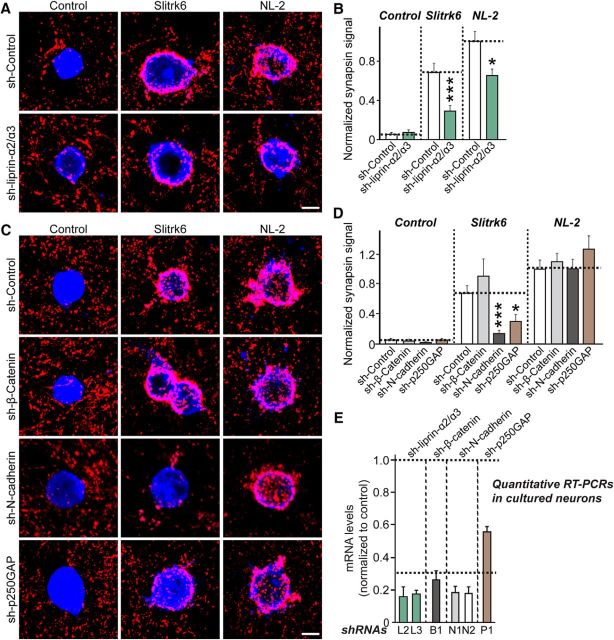
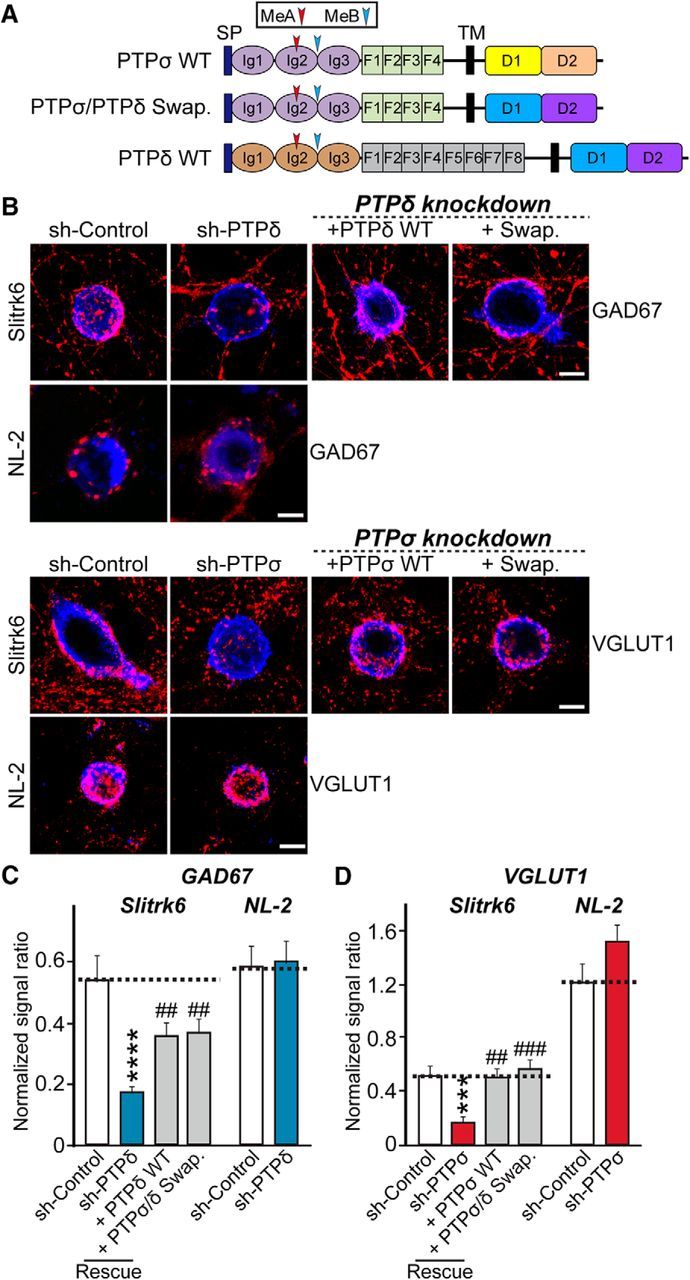
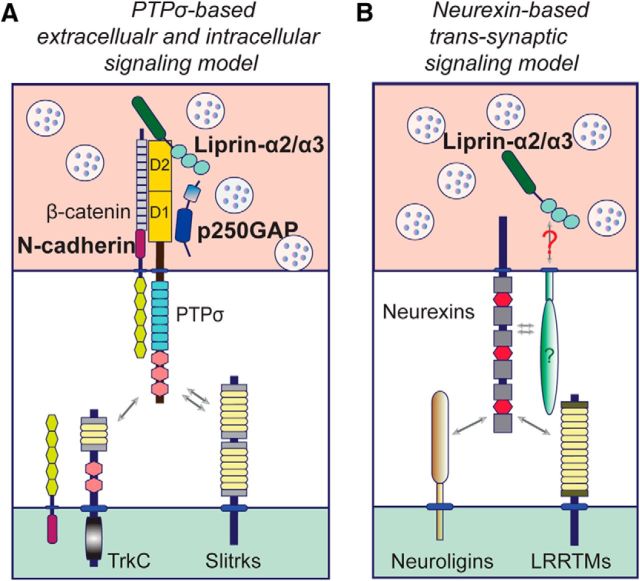
Leukocyte common antigen-receptor protein tyrosine phosphatases (LAR-RPTPs) are hub proteins that organize excitatory and inhibitory synapse development through binding to various extracellular ligands. Here, we report that knockdown (KD) of the LAR-RPTP family member PTPσ reduced excitatory synapse number and transmission in cultured rat hippocampal neurons, whereas KD of PTPδ produced comparable decreases at inhibitory synapses, in both cases without altering expression levels of interacting proteins. An extensive series of rescue experiments revealed that extracellular interactions of PTPσ with Slitrks are important for excitatory synapse development. These experiments further showed that the intracellular D2 domain of PTPσ is required for induction of heterologous synapse formation by Slitrk1 or TrkC, suggesting that interaction of LAR-RPTPs with distinct intracellular presynaptic proteins, drives presynaptic machinery assembly. Consistent with this, double-KD of liprin-α2 and -α3 or KD of PTPσ substrates (N-cadherin and p250RhoGAP) in neurons inhibited Slitrk6-induced, PTPσ-mediated heterologous synapse formation activity. We propose a synaptogenesis model in presynaptic neurons involving LAR-RPTP-organized retrograde signaling cascades, in which both extracellular and intracellular mechanisms are critical in orchestrating distinct synapse types.SIGNIFICANCE STATEMENT In this study, we sought to test the unproven hypothesis that PTPσ and PTPδ are required for excitatory and inhibitory synapse formation/transmission, respectively, in cultured hippocampal neurons, using knockdown-based loss-of-function analyses. We further performed extensive structure-function analyses, focusing on PTPσ-mediated actions, to address the mechanisms of presynaptic assembly at excitatory synaptic sites. Using interdisciplinary approaches, we systematically applied a varied set of PTPσ deletion variants, point mutants, and splice variants to demonstrate that both extracellular and intracellular mechanisms are involved in organizing presynaptic assembly. Strikingly, extracellular interactions of PTPσ with heparan sulfates and Slitrks, intracellular interactions of PTPσ with liprin-α and its associated proteins through the D2 domain, as well as distinct substrates are all critical.

Keywords: LAR-RPTPs; PTPσ; presynaptic assembly; protein–protein interaction; synaptic adhesion molecule.


Figures

Figure 1.
Figure 1.
PTPσ and PTPδ are selectively required for the heterologous synapse-formation activities of distinct postsynaptogenic adhesion molecules. A, Representative images of the heterologous synapse-formation activities of various LAR-RPTP ligands. Neurons were infected at DIV4 with lentiviruses expressing sh-Control, sh-PTPσ, sh-PTPδ, sh-LAR, sh-LAR/sh-PTPσ, or sh-PTPσ/PTPδ/LAR as indicated, and then cocultured from DIV9 to DIV11 with HEK293T cells expressing various postsynaptic ligands. Neurons were stained with antibodies against HA or EGFP (blue) and VGLUT1 (red). Scale bar (all images), 10 μm. B, The synapse-forming activity in A was quantified by measuring the ratio of VGLUT1 staining intensity (red) to HA or EGFP immunoreactivity intensity (blue). Data are mean ± SEM. Mann–Whitney U test: ****p < 0.0001. n = number of neurons as follows: sh-Control/Control, n = 13; sh-PTPσ/Control, n = 15; sh-PTPδ/Control, n = 17; sh-LAR/Control, n = 15; sh-LAR/sh-PTPσ/Control, n = 11; sh-LAR/PTPσ/PTPδ/Control, n = 12; sh-Control/NGL-3, n = 18; sh-PTPσ/NGL-3, n = 17; sh-PTPδ/NGL-3, n = 16; sh-LAR/NGL-3, n = 16; sh-LAR/sh-PTPσ/NGL-3, n = 16; sh-LAR/PTPσ/PTPδ/NGL-3, n = 16; sh-Control/Slitrk1, n = 13; sh-PTPσ/Slitrk1, n = 15; sh-PTPδ/Slitrk1, n = 13; sh-LAR/Slitrk1, n = 11; sh-Control/TrkC, n = 15; sh-PTPσ/TrkC, n = 11; sh-PTPδ/TrkC, n = 12; sh-LAR/ TrkC, n = 11; sh-Control/IL1RAPL1, n = 11; sh-PTPσ/IL1RAPL1, n = 13; sh-PTPδ/IL1RAPL1, n = 14; sh-LAR/IL1RAPL1, n = 12; sh-Control/NL-1, n = 11; sh-PTPσ/NL-1, n = 12; sh-PTPδ/NL-1, n = 10; and sh-LAR/NL-1, n = 11. p values for Control condition: sh-Control vs sh-PTPσ, p = 0.439; sh-Control vs sh-PTPδ, p = 0.5604; sh-Control vs sh-LAR, p = 0.1835; sh-Control vs sh-LAR/sh-PTPσ, p = 0.9534; and sh-Control vs sh-LAR/PTPσ/PTPδ, p = 0.5641. p values for NGL-3 condition: sh-Control vs sh-PTPσ, p = 0.4129; sh-Control vs sh-PTPδ, p = 0.7706; sh-Control vs sh-LAR, p = 0.5832; sh-Control vs sh-LAR/sh-PTPσ, p = 0.8166; and sh-Control vs sh-LAR/PTPσ/PTPδ, p = 0.9921. p values for Slitrk1 condition: sh-Control vs sh-PTPσ, p < 0.0001; sh-Control vs sh-PTPδ, p = 0.3394; and sh-Control vs sh-LAR, p = 0.684. p values for TrkC condition: sh-Control vs sh-PTPσ, p < 0.0001; sh-Control vs sh-PTPδ, p = 0.1433; and sh-Control vs sh-LAR, p = 0.2958. p values for IL1RAPL1 condition: sh-Control vs sh-PTPσ, p = 0.7832; sh-Control vs sh-PTPδ, p < 0.01; and sh-Control vs sh-LAR, p = 0.5212. p values for NL1 condition: sh-Control vs sh-PTPσ, p = 0.9537; sh-Control vs sh-PTPδ, p = 0.8919; and sh-Control vs sh-LAR, p = 0.6262. C, Levels of PTPσ, PTPδ, and LAR mRNAs were measured at DIV12-DV13 by qRT-PCR in cultured cortical neurons infected at DIV4 with lentiviruses expressing the indicated shRNAs. Dashed line indicates 70% knockdown cutoff level for tests of biological effects.
Figure 2.
Figure 2.
Specific localization of PTPσ and PTPδ at excitatory and inhibitory synaptic sites in cultured hippocampal neurons. A, Immunoblot analyses of PTPδ and PTPσ using lysates from HEK293T cells transfected with HA-tagged PTPδ (HA- PTPδ) or PTPσ (HA-PTPσ). The expression of HA-tagged PTP isoforms was confirmed by immunoblotting with anti-HA antibodies. Unt., Untransfected HEK293T cell lysates; Trans. (HA-PTPδ), lysates from HEK293T cells transfected with HA-PTPδ; Trans. (HA-PTPσ), lysates from HEK293T cells transfected with HA-PTPσ. B, Authenticity testing of anti-PTPδ and anti-PTPσ antibodies. Mature cultured hippocampal neurons (DIV14) infected with lentiviruses expressing sh-Control, sh-PTPδ (PTPδ KD), or sh-PTPσ (PTPσ KD) were labeled by single immunofluorescence staining for the indicated PTP antibodies (gray). Scale bar (all images), 10 μm. C, Summary graphs of B. Data are mean ± SEM. **p < 0.01 (Mann–Whitney U test). n = number of analyzed neurons as follows: sh-Control/PTPσ, n = 10; sh-PTPσ/PTPσ, n = 10; sh-Control/PTPδ, n = 10; and sh-PTPδ/PTPδ, n = 11. p value for PTPσ antibody: sh-Control vs sh-PTPσ, p = 0.0052. p value for PTPδ antibody: sh-Control vs sh-PTPδ, p = 0.0048. D, F, Immunolocalization of PTPδ (D) and PTPσ (F) in cultured hippocampal neurons, along with colocalization of GAD67, VGAT, or VGLUT1 as indicated. Scale bar (all images), 10 μm. E, G, Quantification of colocalization of endogenous PTPδ (E) and PTPσ (G) with synaptic markers.
Figure 3.
Figure 3.
Effects of PTPσ and PTPδ KD on the levels of selected synaptic proteins in cultured neurons. A, B, Representative semiquantitative immunoblot images (A) and quantitative summary (B) of the expression levels of the indicated synaptic proteins in cultured cortical neurons infected with sh-Control, sh-PTPσ, or sh-PTPδ lentiviruses. β-Actin was used as a loading control, and protein levels were expressed relative to those in the sh-Control group. Data are mean ± SEM. Parametric t test: *p < 0.05; ***p < 0.001; ****p < 0.0001; n = number of samples as follows: PTPσ, n = 4; PTPδ, n = 4; liprin-α2, n = 3; liprin-α3, n = 3; Caskin-1, n = 4; Caskin-2, n = 3; MIM-B, n = 3; CASK, n = 3; ELKS1, n = 3; GIT1, n = 3; GluN2B, n = 3; NL-1, n = 3; and β-actin, n = 6. p values for PTPσ blots: sh-Control vs sh-PTPσ, p < 0.0001; and sh-Control vs sh-PTPδ, p = 0.0003. p values for PTPδ blots: sh-Control vs sh-PTPσ, p = 0.0108; and sh-Control vs sh-PTPδ, p = 0.0005. p values for liprin-α2 blots: sh-Control vs sh-PTPσ, p = 0.6963; and sh-Control vs sh-PTPδ, p = 0.4269. p values for liprin-α3 blots: sh-Control vs sh-PTPσ, p = 0.524; and sh-Control vs sh-PTPδ, p = 0.437. p values for Caskin-1 blots: sh-Control vs sh-PTPσ, p = 0.643; and sh-Control vs sh-PTPδ, p = 0.6568. p values for Caskin-2 blots: sh-Control vs sh-PTPσ, p = 0.2875; and sh-Control vs sh-PTPδ, p = 0.8973. p values for MIM-B blots: sh-Control vs sh-PTPσ, p = 0.5808; and sh-Control vs sh-PTPδ, p = 0.4229. p values for CASK blots: sh-Control vs sh-PTPσ, p = 0.5549; and sh-Control vs sh-PTPδ, p = 0.4523. p values for ELKS1 blots: sh-Control vs sh-PTPσ, p = 0.0756; and sh-Control vs sh-PTPδ, p = 0.4072. p values for GIT1 blots: sh-Control vs sh-PTPσ, p = 0.0878; and sh-Control vs sh-PTPδ, p = 0.3826. p values for GluN2B blots: sh-Control vs sh-PTPσ, p = 0.4656; and sh-Control vs sh-PTPδ, p = 0.0672. p values for NL-1 blots: sh-Control vs sh-PTPσ, p = 0.4262; and sh-Control vs sh-PTPδ, p = 0.5466. p values for β-actin blots: sh-Control vs sh-PTPσ, p = 0.662; and sh-Control vs sh-PTPδ, p = 0.9238.
Figure 4.
Figure 4.
Effects of PTPσ and PTPδ KD on synapse density and synaptic transmission in cultured neurons. A, B, Cultured hippocampal neurons were infected with lentiviruses expressing sh-Control, sh-LAR, sh-PTPσ, or sh-PTPδ, or were coinfected with lentiviruses expressing sh-PTPσ or sh-PTPδ together with shRNA-resistant full-length PTPσ (+ PTPσ WT) or sh-PTPδ (+ PTPδ WT) at DIV4, and analyzed at DIV14 by double-immunofluorescence detection of MAP2 and VGLUT1 (A) or VGAT (B). Scale bar (all images), 10 μm. C–E, Summary graphs of A, B. Synaptic puncta density (C), synaptic puncta size (D), and synaptic puncta intensity (E) were measured using VGLUT1 and VGAT as excitatory and inhibitory synaptic markers, respectively. Two or three dendrites per infected neurons were analyzed and group-averaged. Data are mean ± SEM. Mann–Whitney U test: **p < 0.01; ***p < 0.001. n = number of neurons as follows: (E) sh-Control, n = 17; sh-PTPσ, n = 16; sh-PTPδ, n = 15; sh-LAR, n = 15; and sh-PTPσ+PTPσ WT, n = 13. F, sh-Control, n = 13; sh-PTPσ, n = 14; sh-PTPδ, n = 14; sh-LAR, n = 14; and sh-PTPδ+PTPδ WT, n = 14. p values for VGLUT1 puncta density: sh-Control vs sh-PTPσ, p < 0.001; sh-Control vs sh-PTPδ, p = 0.3322; sh-Control vs sh-LAR, p = 0.3765; and sh-Control vs sh-PTPσ (+PTPσ), p = 0.8210. p values for VGAT puncta density: sh-Control vs sh-PTPσ, p = 0.9781; sh-Control vs sh-PTPδ, p < 0.001; sh-Control vs sh-LAR, p = 0.1958; and sh-Control vs sh-PTPδ (+PTPδ), p = 0.8124. p values for VGLUT1 puncta size: sh-Control vs sh-PTPσ, p = 0.0820; sh-Control vs sh-PTPδ, p > 0.9999; sh-Control vs sh-LAR, p = 0.9999; and sh-Control vs sh-PTPσ (+PTPσ), p = 0.9212. p values for VGAT puncta size: sh-Control vs sh-PTPσ, p = 0.1248; sh-Control vs sh-PTPδ, p < 0.01; sh-Control vs sh-LAR, p > 0.9999; and sh-Control vs sh-PTPδ (+PTPδ), p = 0.8790. p values for VGLUT1 puncta intensity: sh-Control vs sh-PTPσ, p = 0.7176; sh-Control vs sh-PTPδ, p = 0.8392; sh-Control vs sh-LAR, p = 0.9115; and sh-Control vs sh-PTPσ (+PTPσ), p = 0.7938. p values for VGAT puncta intensity: sh-Control vs sh-PTPσ, p = 0.2190; sh-Control vs sh-PTPδ, p = 0.4771; sh-Control vs sh-LAR, p = 0.3198; and sh-Control vs sh-PTPδ (+PTPδ), p = 0.6787. F, I, Representative traces of mEPSCs (F) and mIPSCs (I) in neurons infected with control, shPTPσ, sh-PTPδ, or sh-LAR lentiviruses. Neurons were infected with lentiviruses at DIV4, and electrophysiological recordings were obtained at DIV14–16. G, H, Summary graphs of the frequencies (G) and amplitudes (H) of mEPSCs in neurons infected with control, shPTPσ, sh-PTPδ, or sh-LAR lentiviruses. Data are mean ± SEM. *p < 0.05 (Student's t test). n = number of neurons as follows: sh-Control 1, n = 16; sh-PTPσ, n = 21; sh-Control 2, n = 13; sh-PTPδ, n = 30; sh-Control 3, n = 11; and sh-LAR, n = 16. p values for mEPSC frequency: sh-Control 1 vs sh-PTPσ, p < 0.05; sh-Control 2 vs sh-PTPδ, p = 0.4237; and sh-Control 3 vs sh-LAR, p = 0.5211. p values for mEPSC amplitude: sh-Control 1 vs sh-PTPσ, p < 0.05; sh-Control 2 vs sh-PTPδ, p = 0.8921; and sh-Control 3 vs sh-LAR, p = 0.9783. J, K, Same as G, H, except that mIPSCs were measured. Data are mean ± SEM. *p < 0.05 (Student's t test). n = number of neurons as follows: sh-Control 1, n = 16; sh-PTPσ, n = 23; sh-Control 2, n = 11; sh-PTPδ, n = 20; sh-Control 3, n = 16; and sh-LAR, n = 23. p values for mIPSC frequency: sh-Control 1 vs sh-PTPσ, p = 0.3576; sh-Control 2 vs sh-PTPδ, p < 0.05; and sh-Control 3 vs sh-LAR, p = 0.6183. p values for mIPSC amplitude: sh-Control 1 vs sh-PTPσ, p = 0.7120; sh-Control 2 vs sh-PTPδ, p < 0.05; and sh-Control 3 vs sh-LAR, p = 0.8217.
Figure 5.
Figure 5.
Effect of PTPσ alternative splicing on excitatory synapse development in cultured neurons. A, Schematic diagrams of PTPσ alternative splice variants used in the current study. D1, first catalytic domain of LAR-RPTPs; D2, second catalytic domain of LAR-RPTPs; F, fibronectin Type III repeat; Ig, Ig domain; MeA, mini-exon A; MeB; mini-exon B; SP, IgκB signal peptide contained in the pDisplay vector (Invitrogen); TM, transmembrane region. B, Representative images from cultured hippocampal neurons infected at DIV4 with lentiviruses expressing sh-Control, sh-PTPσ, or coinfected with lentiviruses expressing sh-PTPσ and the human PTPσ alternatively spliced variant rescue viruses, PTPσMeA+MeB+, PTPσMeA−MeB−, PTPσMeA−MeB+, or PTPσMeA+MeB−, and analyzed at DIV14 by double-immunofluorescence detection of MAP2 (blue) and the excitatory synaptic marker VGLUT1 (red). Scale bar (all images), 10 μm. C, Summary graphs of the effects of PTPσ splice variants in neurons on puncta density (left) and puncta size (right), measured using VGLUT1 as an excitatory synaptic marker. Two or three dendrites per infected neuron were analyzed and group-averaged. Data are mean ± SEM. ANOVA with a nonparametric Kruskal–Wallis test: **p < 0.01; #p < 0.05; ##p < 0.01; ###p < 0.001. n = number of neurons as follows: sh-Control/ VGLUT1, n = 14; sh-PTPσ/ VGLUT1, n = 15; PTPσMeA+MeB+ rescue/VGLUT1, n = 15; PTPσMeA−MeB− rescue/VGLUT1, n = 13; PTPσMeA−MeB+ rescue/VGLUT1, n = 15; and PTPσMeA+MeB− rescue/VGLUT1, n = 15. p values for puncta density: sh-Control vs sh-PTPσ, p = 0.0065; sh-Control vs PTPσMeA+MeB+ rescue, p > 0.9999; sh-Control vs PTPσMeA−MeB− rescue, p > 0.9999; sh-Control vs PTPσMeA−MeB+ rescue, p > 0.9999; sh-Control vs PTPσMeA+MeB rescue, p > 0.9999; sh-PTPσ vs PTPσMeA+MeB+ rescue, p = 0.0304; sh-PTPσ vs PTPσMeA−MeB− rescue, p = 0.0002; sh-PTPσ vs PTPσMeA−MeB+ rescue, p = 0.0015; and sh-PTPσ vs PTPσMeA+MeB rescue, p = 0.002. p values for puncta size: sh-Control vs sh-PTPσ, p > 0.9999; sh-Control vs PTPσMeA+MeB+ rescue, p > 0.9999; sh-Control vs PTPσMeA−MeB− rescue, p > 0.9999; sh-Control vs PTPσMeA−MeB+ rescue, p > 0.9999; sh-Control vs PTPσMeA+MeB rescue, p > 0.9999; sh-PTPσ vs PTPσMeA+MeB+ rescue, p > 0.9999; sh-PTPσ vs PTPσMeA−MeB− rescue, p > 0.9999; sh-PTPσ vs PTPσMeA−MeB+ rescue, p > 0.9999; and sh-PTPσ vs PTPσMeA+MeB rescue, p > 0.9999.
Figure 6.
Figure 6.
Characterization of total expression, surface trafficking, and ligand-binding properties of various PTPσ variants used in the current study. A, Overview of the PTPσ WT and various PTPσ variants (alternative splicing variants, deletion mutants, and point mutants). Alternatively spliced variants: PTPσMeA+MeB+, PTPσ containing an insert in both MeA and MeB splice sites; PTPσMeA−MeB−, PTPσ lacking an insert in both MeA and MeB splice sites; PTPσMeA−MeB+, PTPσ lacking an insert in the MeA splice site and containing an insert in the MeB splice site; and PTPσMeA+MeB−, PTPσ containing an insert in the MeA splice site and lacking an insert in the MeB splice site. Deletion variants: PTPσ ΔIg, PTPσ with a deletion of the three Ig domains; PTPσ ΔFN1–2, PTPσ with a deletion of the first two FNIII domains; PTPσ ΔEcto, PTPσ with a deletion of the entire extracellular region; PTPσ ΔCyto, PTPσ with a deletion of the entire intracellular region; and PTPσ ΔD2, PTPσ with a deletion of the intracellular D2 domain. Point mutants: PTPσ C1157S or D1125A, tyrosine phosphatase activity-defective mutants of PTPσ; PTPσ R781A, a proteolytic cleavage-defective mutant of PTPσ; PTPσ AAAA, a PTPσ mutant in which HS binding was abrogated by replacing four lysines of the first Ig domain (K68, K69, K71, and K72) with alanines; PTPσ R97/100A, a PTPσ mutant in which TrkC binding was abolished by replacing two arginine residues (R97 and R100) with alanines; PTPσ Y233S, a PTPσ mutant in which binding to both Slitrks and TrkC was eliminated by replacing a tyrosine residue (Y233) with serine; and PTPσ R235D, a PTPσ mutant in which binding to Slitrks was disrupted by replacing an arginine residue (R235) with aspartic acid. PTPσ Swap denotes a hybrid of the PTPσ extracellular region with a transmembrane segment and the PTPδ intracellular region. B, Representative immunoblot images from HEK293T cells transfected with HA-tagged PTPσ WT or the indicated PTPσ variants. Samples containing equal amounts of protein were resolved by SDS-PAGE and immunoblotted using anti-HA antibodies. PTPσ GPI denotes a full-length PTPσ in which a transmembrane segment was replaced with a GPI anchor sequence. C, Surface expression analysis of HEK293T cells expressing HA-PTPσ WT or the indicated HA-tagged PTPσ mutant variants. Transfected cells were immunostained with mouse anti-HA antibodies (green) and detected with FITC-conjugated anti-mouse secondary antibodies under nonpermeabilized conditions. Cells were then permeabilized and stained first with rabbit anti-HA antibodies (red) and subsequently with Cy3-conjugated anti-rabbit secondary antibodies. Scale bar (all images), 10 μm. D, Representative images of cell-surface binding assays. HEK293T cells expressing HA-tagged PTPσ WT or the indicated PTPσ variants were incubated with 10 μg/ml of control IgC (Fc), Ig-NGL-3 (NGL-3-Fc), or Ig-GPC4 (GPC4-Fc) and then analyzed by immunofluorescence imaging of Ig-fusion proteins (red) and HA antibodies (green). Scale bar (all images), 10 μm.
Figure 7.
Figure 7.
Analysis of PTPσ extracellular mechanisms involved in heterologous synapse formation and excitatory synapse development in cultured neurons. A, Schematic diagrams of a series of PTPσ constructs for deletion variants of extracellular domains or point mutants at extracellular residues. AAAA, Quadruple alanine mutant; D1, first catalytic domain of LAR-RPTPs; D2, second catalytic domain of LAR-RPTPs; F, fibronectin Type III repeat; Ig, Ig domain; MeA, mini-exon A; MeB; mini-exon B; SP, IgκB signal peptide; TM, transmembrane region. B, Representative images of heterologous synapse-formation activities of PTPσ WT and the indicated extracellular domain variants and point mutants. Neurons were infected at DIV4 with lentiviruses expressing sh-Control or sh-PTPσ, or coexpressing sh-PTPσ and the various PTPσ mutant constructs (WT, deletion, or point mutants presented in A), and then cocultured from DIV9 to DIV11 with HEK293T cells expressing EGFP alone (Control) or HA-Slitrk1 (Slitrk1). Neurons were stained with antibodies against EGFP or HA (blue) and synapsin (red). Scale bar (all images), 10 μm. C, Synapse-formation activity in B was quantified by measuring the ratio of synapsin staining intensity (red) to HA/EGFP intensity (blue). Data are mean ± SEM. ANOVA with a nonparametric Kruskal–Wallis test: **p < 0.01; ***p < 0.001; #p < 0.05; ###p < 0.001. n = number of neurons as follows: sh-Control/Control, n = 9; sh-PTPσ/Control, n = 9; +WT/Control, n = 9; +ΔIg/Control, n = 9; +ΔFN1–2/Control, n = 15; +ΔEcto/Control, n = 10; +R781A/Control, n = 11; +AAAA/Control, n = 10; sh-Control/Slitrk1, n = 16; sh-PTPσ/Slitrk1, n = 18; +WT/Slitrk1, n = 16; +ΔIg/Slitrk1, n = 12; +ΔFN1–2/Slitrk1, n = 15; +ΔEcto/Slitrk1, n = 12; +R781A/Slitrk1, n = 15; and +AAAA/Slitrk1, n = 14. p values for Control condition: sh-Control vs sh-PTPσ, p > 0.9999; sh-Control vs +WT, p > 0.9999; sh-Control vs +ΔIg, p > 0.9999; sh-Control vs +ΔFN1–2, p > 0.9999; sh-Control vs +ΔEcto, p > 0.9999; sh-Control vs +R781A, p = 0.3835; sh-Control vs +AAAA, p = 0.7746; sh-PTPσ vs +WT, p > 0.9999; sh-PTPσ vs +ΔIg, p > 0.9999; sh-PTPσ vs +ΔFN1–2, p > 0.9999; sh-PTPσ vs +ΔEcto, p > 0.9999; sh-PTPσ vs +R781A, p = 0.9262; and sh-PTPσ vs +AAAA, p > 0.9999. p values for Slitrk1 condition: sh-Control vs sh-PTPσ, p < 0.0001; sh-Control vs +WT, p > 0.9999; sh-Control vs +ΔIg, p = 0.008; sh-Control vs +ΔFN1–2, p > 0.9999; sh-Control vs +ΔEcto, p = 0.0002; sh-Control vs +R781A, p > 0.9999; sh-Control vs +AAAA, p > 0.9999; sh-PTPσ vs +WT, p < 0.0001; sh-PTPσ vs +ΔIg, p > 0.9999; sh-PTPσ vs +ΔFN1–2, p = 0.0348; sh-PTPσ vs +ΔEcto, p > 0.9999; sh-PTPσ vs +R781A, p = 0.0341; and sh-PTPσ vs +AAAA, p = 0.0132. D, Representative images from cultured hippocampal neurons infected at DIV4 with lentiviruses expressing sh-Control or sh-PTPσ, or coinfected with lentiviruses expressing sh-PTPσ and the indicated rescue viruses for PTPσ WT and extracellular domain mutants and analyzed at DIV14 by double-immunofluorescence detection of MAP2 (blue) and the excitatory synaptic marker VGLUT1 (red). Scale bar (all images), 10 μm. E, F, Summary graphs of the effects of PTPσ molecular replacement in neurons on puncta density (E) and puncta size (F), measured using VGLUT1 as an excitatory synaptic marker. Two or three dendrites per transfected neuron were analyzed and group-averaged. Data are mean ± SEM. ANOVA with a nonparametric Kruskal–Wallis test: *p < 0.05; **p < 0.01; #p < 0.05; ##p < 0.01. n = number of neurons as follows: sh-Control, n = 28; sh-PTPσ, n = 20; +WT, n = 20; +ΔIg, n = 20; +ΔFN1–2, n = 21; +ΔEcto, n = 20; +R781A, n = 14; and +AAAA, n = 20. p values for puncta density: sh-Control vs sh-PTPσ, p = 0.0063; sh-Control vs +WT, p > 0.9999; sh-Control vs +ΔIg, p = 0.0178; sh-Control vs +ΔFN1–2, p > 0.9999; sh-Control vs +ΔEcto, p = 0.0493; sh-Control vs +R781A, p > 0.9999; sh-Control vs +AAAA, p = 0.0132; sh-PTPσ vs +WT, p = 0.0281; sh-PTPσ vs +ΔIg, p > 0.9999; sh-PTPσ vs +ΔFN1–2, p = 0.0073; sh-PTPσ vs +ΔEcto, p > 0.9999; sh-PTPσ vs +R781A, p = 0.0086; and sh-PTPσ vs +AAAA, p > 0.9999. p values for puncta sizes: sh-Control vs sh-PTPσ, p > 0.9999; sh-Control vs +WT, p > 0.9999; sh-Control vs +ΔIg, p > 0.9999; sh-Control vs +ΔFN1–2, p > 0.9999; sh-Control vs +ΔEcto, p > 0.9999; sh-Control vs +R781A, p > 0.9999; sh-Control vs +AAAA, p > 0.9999; sh-PTPσ vs +WT, p > 0.9999; sh-PTPσ vs +ΔIg, p > 0.9999; sh-PTPσ vs +ΔFN1–2, p > 0.9999; sh-PTPσ vs +ΔEcto, p > 0.9999; sh-PTPσ vs +R781A, p > 0.9999; and sh-PTPσ vs +AAAA, p > 0.9999.
Figure 8.
Figure 8.
Analysis of the effects of PTPσ extracellular point mutants that selectively abolish interactions with TrkC or Slitrks on heterologous synapse formation. A, Schematic illustration of PTPσ WT and point mutants that exhibit defective binding to the specific postsynaptic ligands, TrkC or Slitrks. D1, First catalytic domain of LAR-RPTPs; D2, second catalytic domain of LAR-RPTPs; F, fibronectin Type III repeat; Ig, Ig domain; MeA, mini-exon A; MeB; mini-exon B; SP, IgκB signal peptide; TM, transmembrane region. B, Representative images of cell surface-binding assays. HEK293T cells expressing HA-tagged PTPσ WT or its various point mutants were incubated with 10 μg/ml control IgC (Control), Ig-GPC-4, or Ig-NGL-3, and then analyzed by immunofluorescence imaging of Ig-fusion proteins (red) and HA antibodies (green). Scale bar (all images), 10 μm. C, Representative images of the heterologous synapse-formation activities of PTPσ WT and specific ligand-binding-defective mutants. Neurons were infected at DIV4 with lentiviruses expressing sh-Control or sh-PTPσ, or coexpressing various PTPσ mutant constructs (WT and ligand-binding-defective mutants presented in A), and then cocultured from DIV9 to DIV11 with HEK293T cells expressing EGFP alone (Control) or HA-Slitrk1 (Slitrk1). Neurons were stained with antibodies against EGFP or HA (blue) and synapsin (red). Scale bar (all images), 10 μm. D, The synapse-formation activity in C was quantified by measuring the ratio of synapsin staining intensity (red) to HA/EGFP intensity (blue). Data are mean ± SEM. ANOVA with a nonparametric Kruskal–Wallis test: **p < 0.01; ***p < 0.001; ####p < 0.0001. n = number of neurons as follows: sh-Control/Slitrk1, n = 19; sh-PTPσ/Control, n = 15; +WT/Control, n = 16; +R97/100A/Control, n = 10; +Y233S/Control, n = 9; and +R235D/Control, n = 10; sh-Control/Slitrk1, n = 20; sh-PTPσ/Slitrk1, n = 25; +WT/Slitrk1, n = 25; +R97/100A/Slitrk1, n = 22; +Y233S/Slitrk1, n = 16; and +R235D/Slitrk1, n = 24. p values for Control condition: sh-Control vs sh-PTPσ, p > 0.9999; sh-Control vs +WT, p > 0.9999; sh-Control vs +R97/100A, p > 0.9999; sh-Control vs +Y233S, p = 0.3522; sh-Control vs +R235D, p = 0.1213; sh-PTPσ vs +WT, p > 0.9999; sh-PTPσ vs +R97/100A, p > 0.9999; sh-PTPσ vs +Y233S, p = 0.1596; and sh-PTPσ vs +R235D, p = 0.0504. p values for Slitrk1 condition: sh-Control vs sh-PTPσ, p < 0.0001; sh-Control vs +WT, p > 0.9999; sh-Control vs +R97/100A, p > 0.9999; sh-Control vs +Y233S, p = 0.0015; sh-Control vs +R235D, p = 0.0004; sh-PTPσ vs +WT, p < 0.0001; sh-PTPσ vs +R97/100A, p < 0.0001; sh-PTPσ vs +Y233S, p > 0.9999; and sh-PTPσ vs +R235D, p > 0.9999. E, Representative images of cultured hippocampal neurons infected at DIV4 with lentiviruses expressing sh-Control or sh-PTPσ, or coinfected with lentiviruses expressing sh-PTPσ and the indicated rescue viruses for human PTPσ alternative splicing variants. These images were taken on DIV14 following double-immunofluorescence labeling of MAP2 (blue) and the excitatory synaptic marker VGLUT1 (red). Scale bar (all images), 10 μm. F, Summary graphs of the effects of PTPσ molecular replacement in neurons on puncta density (left) and puncta size (right), measured using VGLUT1 as an excitatory synaptic marker. Two or three dendrites per transfected neuron were analyzed and group-averaged. Data are mean ± SEM. ANOVA with a nonparametric Kruskal–Wallis test: **p < 0.01; ***p < 0.001; #p < 0.05; ##p < 0.01. n = number of neurons as follows: sh-Control, n = 21; sh-PTPσ, n = 20; +WT, n = 16; +R97/100A, n = 21; +Y233S, n = 15; and +R235D, n = 15. p values for puncta density: sh-Control vs sh-PTPσ, p < 0.0001; sh-Control vs +WT, p > 0.9999; sh-control vs +R97/100A, p > 0.9999; sh-Control vs +Y233S, p = 0.0036; sh-Control vs +R235D, p = 0.0059; sh-PTPσ vs +WT, p = 0.0074; sh-PTPσ vs +R97/100A, p = 0.0179; sh-PTPσ vs +Y233S, p > 0.9999; and sh-PTPσ vs +R235D, p > 0.9999. p values for puncta size: sh-Control vs sh-PTPσ, p > 0.9999; sh-Control vs +WT, p > 0.9999; sh-Control vs +R97/100A, p > 0.9999; sh-Control vs +Y233S, p > 0.9999; sh-Control vs +R235D, p = 0.0177; sh-PTPσ vs +WT, p > 0.9999; sh-PTPσ vs +R97/100A, p > 0.9999; sh-PTPσ vs +Y233S, p > 0.9999; and sh-PTPσ vs +R235D, p = 0.2712.
Figure 9.
Figure 9.
Analysis of PTPσ intracellular mechanisms involved in heterologous synapse formation and excitatory synapse development in cultured neurons. A, Schematic diagrams of a series of PTPσ constructs for deletion variants of intracellular domains or point mutants at intracellular residues. Cyto, Cytoplasmic; D1, first catalytic domain of LAR-RPTPs; D2, second catalytic domain of LAR-RPTPs; F, fibronectin Type III repeat; Ig, Ig domain; MeA, mini-exon A; MeB; mini-exon B; SP, IgκB signal peptide; TM, transmembrane region. B, Representative images of the heterologous synapse-formation activities of PTPσ WT and intracellular domain mutants. Neurons were infected at DIV4 with lentiviruses expressing sh-Control or sh-PTPσ, or coexpressing sh-PTPσ and the various PTPσ variants (WT, deletion variants, and point mutants presented in A), and then cocultured from DIV9 to DIV11 with HEK293T cells expressing EGFP alone (Control) or HA-Slitrk1 (Slitrk1). Neurons were stained with antibodies against EGFP or HA (blue) and synapsin (red). Scale bar (all images), 10 μm. C, The synapse-formation activity in B was quantified by measuring the ratio of synapsin staining intensity (red) to HA/EGFP intensity (blue). Data are mean ± SEM. ANOVA with a nonparametric Kruskal–Wallis test: ***p < 0.001; ****p < 0.0001; ##p < 0.01; ####p < 0.0001. n = number of neurons as follows: sh-Control/Control, n = 19; sh-PTPσ/Control, n = 15; +WT/Control, n = 16; +ΔCyto/Control, n = 9; +ΔD2/Control, n = 10; +Swap/Control, n = 11; +C1157S/Control, n = 10; and +D1125A/Control, n = 10; sh-Control/Slitrk1, n = 15; sh-PTPσ/Slitrk1, n = 15; +WT/Slitrk1, n = 15; +ΔCyto/Slitrk1, n = 16; +ΔD2/Slitrk1, n = 14; +Swap/Slitrk1, n = 21; +C1157S/Slitrk1, n = 21; and +D1125A/Slitrk1, n = 22. p values for Control condition: sh-Control vs sh-PTPσ, p > 0.9999; sh-Control vs +WT, p > 0.9999; sh-Control vs +ΔCyto, p = 0.2621; sh-Control vs +ΔD2, p = 0.0915; sh-Control vs +Swap, p > 0.9999; sh-Control vs +C1157S, p > 0.9999; sh-Control vs +D1125A, p > 0.9999; sh-PTPσ vs +WT, p > 0.9999; sh-PTPσ vs +ΔCyto, p > 0.9999; sh-PTPσ vs +ΔD2, p > 0.9999; sh-PTPσ vs +Swap, p > 0.9999; sh-PTPσ vs +C1157S, p > 0.9999; and sh-PTPσ vs +D1125A, p > 0.9999. p values for Slitrk1 condition: sh-Control vs sh-PTPσ, p < 0.0001; sh-Control vs +WT, p > 0.9999; sh-Control vs +ΔCyto, p < 0.0001; sh-Control vs +ΔD2, p = 0.002; sh-Control vs +Swap, p > 0.9999; sh-Control vs +C1157S, p = 0.0445; sh-Control vs +D1125A, p = 0.0045; sh-PTPσ vs +WT, p < 0.0001; sh-PTPσ vs +ΔCyto, p > 0.9999; sh-PTPσ vs +ΔD2, p > 0.9999; sh-PTPσ vs +Swap, p = 0.0023; sh-PTPσ vs +C1157S, p = 0.2585; and sh-PTPσ vs +D1125A, p = 0.6586. D, Representative images of cultured hippocampal neurons infected at DIV4 with lentiviruses expressing sh-Control or sh-PTPσ, or coinfected with lentiviruses expressing sh-PTPσ and the indicated rescue viruses for PTPσ WT and intracellular domain mutants. Images were obtained on DIV14 following double-immunofluorescence labeling of MAP2 (blue) and the excitatory synaptic marker VGLUT1 (red). Scale bar (all images), 10 μm. E, F, Summary graphs of the effects of PTPσ molecular replacement in neurons on puncta density (E) and puncta size (F), measured using VGLUT1 as an excitatory synaptic marker. Two or three dendrites per transfected neuron were analyzed and group-averaged. Data are mean ± SEM. ANOVA with a nonparametric Kruskal–Wallis test: *p < 0.05; **p < 0.01; ***p < 0.001; ****p < 0.0001; #p < 0.05. n = number of neurons as follows: sh-Control, n = 17; sh-PTPσ, n = 21; +WT, n = 15; +ΔCyto, n = 15; +ΔD2, n = 14; +SWAP, n = 20; +C1157S, n = 25; and +D1125A, n = 26. p values for puncta density: sh-Control vs sh-PTPσ, p < 0.0001; sh-Control vs +WT, p > 0.9999; sh-Control vs +ΔCyto, p < 0.0001; sh-Control vs +ΔD2, p = 0.0184; sh-Control vs +Swap, p < 0.0001; sh-Control vs +C1157S, p = 0.0083; sh-Control vs +D1125A, p = 0.0147; sh-PTPσ vs +WT, p = 0.0105; sh-PTPσ vs +ΔCyto, p > 0.9999; sh-PTPσ vs +ΔD2, p > 0.9999; sh-PTPσ vs +Swap, p > 0.9999; sh-PTPσ vs +C1157S, p > 0.9999; and sh-PTPσ vs +D1125A, p > 0.9999. p values for puncta size: sh-Control vs sh-PTPσ, p > 0.9999; sh-Control vs +WT, p > 0.9999; sh-Control vs +ΔCyto, p < 0.0161; sh-Control vs +ΔD2, p > 0.9999; sh-Control vs +Swap, p = 0.0003; sh-Control vs +C1157S, p > 0.9999; sh-Control vs +D1125A, p > 0.9999; sh-PTPσ vs +WT, p > 0.9999; sh-PTPσ vs +ΔCyto, p > 0.9999; sh-PTPσ vs +ΔD2, p > 0.9999; sh-PTPσ vs +Swap, p = 0.266; sh-PTPσ vs +C1157S, p > 0.9999; and sh-PTPσ vs +D1125A, p > 0.9999.
Figure 10.
Figure 10.
Analysis of PTPσ extracellular and intracellular mechanisms involved in heterologous synapse formation induced by TrkC. A, Representative images of the heterologous synapse-formation activities of PTPσ WT and the indicated specific ligand binding-defective point mutants. Neurons were infected at DIV4 with lentiviruses expressing sh-Control or sh-PTPσ, or coexpressing sh-PTPσ and various PTPσ mutant constructs presented in Figure 6, and then cocultured from DIV9 to DIV11 with HEK293T cells expressing EGFP alone (Control) or HA-TrkC (TrkC). Neurons were stained with antibodies against EGFP or HA (blue) and synapsin (red). Scale bar (all images), 10 μm. B, The synapse-formation activity in A was quantified by measuring the ratio of synapsin staining intensity (red) to HA/EGFP intensity (blue). Data are mean ± SEM. ANOVA with a nonparametric Kruskal–Wallis test: *p < 0.05; ***p < 0.001; ##p < 0.01. n = number of neurons as follows: sh-Control/Control, n = 8; sh-PTPσ/Control, n = 11; +WT/Control, n = 11; +R97/100A/Control, n = 9; +Y233S/Control, n = 9; and +R235D/Control, n = 12; sh-Control/TrkC, n = 13; sh-PTPσ/TrkC, n = 11; +WT/TrkC, n = 13; +R97/100A/TrkC, n = 11; +Y233S/TrkC, n = 16; and +R235D/TrkC, n = 13. p values for Control condition: sh-Control vs sh-PTPσ, p > 0.9999; sh-Control vs +WT, p > 0.9999; sh-Control vs +R97/100A, p = 0.2309; sh-Control vs +Y233S, p = 0.3307; sh-Control vs +R235D, p > 0.9999; sh-PTPσ vs +WT, p > 0.9999; sh-PTPσ vs +R97/100A, p = 0.0577; sh-PTPσ vs +Y233S, p = 0.0814; and sh-PTPσ vs +R235D, p = 0.0504. p values for TrkC condition: sh-Control vs sh-PTPσ, p = 0.0004; sh-Control vs +WT, p > 0.9999; sh-Control vs +R97/100A, p = 0.0153; sh-Control vs +Y233S, p = 0.0003; sh-Control vs +R235D, p > 0.9999; sh-PTPσ vs +WT, p = 0.002; sh-PTPσ vs +R97/100A, p > 0.9999; sh-PTPσ vs +Y233S, p > 0.9999; and sh-PTPσ vs +R235D, p = 0.001. C, Representative images of the heterologous synapse-formation activities of PTPσ WT and the indicated extracellular domain variants and point mutants. Neurons were infected at DIV4 with lentiviruses expressing sh-Control or sh-PTPσ, or coexpressing sh-PTPσ and various PTPσ mutant constructs (WT, deletion, or point mutants presented in Fig. 6), and then cocultured from DIV9 to DIV11 with HEK293T cells expressing EGFP alone (Control) or HA-TrkC (TrkC). Neurons were stained with antibodies against EGFP or HA (blue) and synapsin (red). Scale bar (all images), 10 μm. D, The synapse-formation activity in C was quantified by measuring the ratio of synapsin staining intensity (red) to HA/EGFP intensity (blue). Data are mean ± SEM. ANOVA with a nonparametric Kruskal–Wallis test: *p < 0.05; **p < 0.01; ***p < 0.001; #p < 0.05; ##p < 0.01; ###p < 0.001. n = number of neurons as follows: sh-Control/Control, n = 8; sh-PTPσ/Control, n = 11; +WT/Control, n = 11; +ΔIg/Control, n = 11; +ΔFN1–2/Control, n = 10; +ΔEcto/Control, n = 10; +R781A/Control, n = 10; and +AAAA/Control, n = 12; sh-Control/TrkC, n = 12; sh-PTPσ/TrkC, n = 11; +WT/TrkC, n = 13; +ΔIg/TrkC, n = 13; +ΔFN1–2/TrkC, n = 13; +ΔEcto/TrkC, n = 11; +R781A/TrkC, n = 14; and +AAAA/TrkC, n = 14. p values for Control condition: sh-Control vs sh-PTPσ, p > 0.9999; sh-Control vs +WT, p > 0.9999; sh-control vs +ΔIg, p > 0.9999; sh-Control vs +ΔFN1–2, p > 0.9999; sh-Control vs +ΔEcto, p > 0.9999; sh-Control vs +R781A, p > 0.9999; sh-Control vs +AAAA, p > 0.9999; sh-PTPσ vs +WT, p > 0.9999; sh-PTPσ vs +ΔIg, p > 0.9999; sh-PTPσ vs +ΔFN1–2, p > 0.9999; sh-PTPσ vs +ΔEcto, p > 0.9999; sh-PTPσ vs +R781A, p > 0.9999; and sh-PTPσ vs +AAAA, p > 0.9999. p values for TrkC condition: sh-Control vs sh-PTPσ, p = 0.0003; sh-Control vs +WT, p > 0.9999; sh-Control vs +ΔIg, p = 0.0374; sh-Control vs +ΔFN1–2, p > 0.9999; sh-Control vs +ΔEcto, p = 0.0085; sh-Control vs +R781A, p > 0.9999; sh-Control vs +AAAA, p > 0.9999; sh-PTPσ vs +WT, p = 0.0027; sh-PTPσ vs +ΔIg, p > 0.9999; sh-PTPσ vs +ΔFN1–2, p = 0.0082; sh-PTPσ vs +ΔEcto, p > 0.9999; sh-PTPσ vs +R781A, p = 0.0112; and sh-PTPσ vs +AAAA, p = 0.0006. E, Representative images of the heterologous synapse-formation activities of PTPσ WT and the indicated intracellular domain variants and point mutants. Neurons were infected at DIV4 with lentiviruses expressing sh-Control or sh-PTPσ, or coexpressing sh-PTPσ and the indicated PTPσ mutant constructs presented in Figures 9 and 11, and then cocultured from DIV9 to DIV11 with HEK293T cells expressing EGFP alone (Control) or HA-TrkC (TrkC). Neurons were stained with antibodies against EGFP or HA (blue) and synapsin (red). Scale bar (all images), 10 μm. F, The synapse-formation activity in E was quantified by measuring the ratio of synapsin staining intensity (red) to HA/EGFP intensity (blue). Data are mean ± SEM. ANOVA with a nonparametric Kruskal–Wallis test: ***p < 0.001; ****p < 0.0001; ##p < 0.01; ####p < 0.0001. n = number of neurons as follows: sh-Control/Control, n = 8; sh-PTPσ/Control, n = 11; +WT/Control, n = 11; +ΔCyto/Control, n = 11; +ΔD2/Control, n = 9; +Swap/Control, n = 8; +C1157S/Control, n = 9; and +D1125A/Control, n = 12; sh-Control/TrkC, n = 21; sh-PTPσ/TrkC, n = 28; +WT/TrkC, n = 21; +ΔCyto/TrkC, n = 12; +ΔD2/TrkC, n = 13; +Swap/TrkC, n = 17; +C1157S/TrkC, n = 20; and +D1125A, n = 15. p values for Control condition: sh-Control vs sh-PTPσ, p > 0.9999; sh-Control vs +WT, p > 0.9999; sh-Control vs +ΔCyto, p > 0.9999; sh-Control vs +ΔD2, p > 0.9999; sh-Control vs +Swap, p = 0.4602; sh-Control vs +C1157S, p = 0.6221; sh-Control vs +D1125A, p > 0.9999; sh-PTPσ vs +WT, p > 0.9999; sh-PTPσ vs +ΔCyto, p = 0.4431; sh-PTPσ vs +ΔD2, p = 0.6263; sh-PTPσ vs +Swap, p = 0.1718; sh-PTPσ vs +C1157S, p = 0.2347; and sh-PTPσ vs +D1125A, p > 0.9999. p values for TrkC condition: sh-Control vs sh-PTPσ, p < 0.0001; sh-Control vs +WT, p > 0.9999; sh-Control vs +ΔCyto, p < 0.0001; sh-Control vs +ΔD2, p < 0.0001; sh-Control vs +Swap, p = 0.0539; sh-Control vs +C1157S, p = 0.0002; sh-Control vs +D1125A, p = 0.0003; sh-PTPσ vs +WT, p < 0.0001; sh-PTPσ vs +ΔCyto, p > 0.9999; sh-PTPσ vs +ΔD2, p > 0.9999; sh-PTPσ vs +Swap, p = 0.0061; sh-PTPσ vs +C1157S, p = 0.3426; and sh-PTPσ vs +D1125A, p > 0.9999.
Figure 11.
Figure 11.
Effects of PTPσ intracellular binding proteins on PTPσ-mediated heterologous synapse formation. A, Representative images of the heterologous synapse-formation activities of liprin-α2 and liprin-α3. Neurons were infected at DIV4 with lentiviruses expressing sh-Control or sh-liprin-α2/α3, and then cocultured from DIV9 to DIV11 with HEK293T cells expressing EGFP alone (Control), HA-Slitrk6 (Slitrk6), or HA-neuroligin-2 (NL-2). Neurons were stained with antibodies against EGFP or HA (blue) and synapsin (red). Scale bar (all images), 10 μm. Liprin-α3 and a subset of its associated proteins were isolated by mass spectroscopy (see Figure 11-1). B, The synapse-formation activity in A was quantified by measuring the ratio of synapsin staining intensity (red) to HA/EGFP intensity (blue). Data are mean ± SEM. Mann–Whitney U test: *p < 0.05; ***p < 0.001. n = number of neurons as follows: sh-Control/Control, n = 14; sh-liprin-α2/α3/Control, n = 10; sh-Control/Slitrk6, n = 16; sh-liprin-α2/α3/Slitrk6, n = 15; sh-Control/NL-2, n = 22; and sh-liprin-α2/α3/NL-2, n = 21. p values for Control condition: sh-Control vs sh-liprin-α2/α3, p = 0.2591. p values for Slitrk6 condition: sh-Control vs sh-liprin-α2/α3, p = 0.0003. p values for NL-2 condition: sh-Control vs sh-liprin-α2/α3, p = 0.0101. C, Representative images of the heterologous synapse-formation activities of three selected PTPσ substrates (β-catenin, N-cadherin, and p250GAP). Neurons were infected at DIV4 with lentiviruses expressing sh-Control, sh-β-catenin, sh-N-cadherin, or sh-p250GAP, and then cocultured from DIV9 to DIV11 with HEK293T cells expressing EGFP alone (Control), HA-Slitrk6 (Slitrk6), or neuroligin-2-mVenus (NL-2). Neurons were stained with antibodies against EGFP or HA (blue) and synapsin (red). Scale bar (all images), 10 μm. D, The synapse-formation activity in C was quantified by measuring the ratio of synapsin staining intensity (red) to HA/EGFP intensity (blue). Data are mean ± SEM. Mann–Whitney U test: *p < 0.05; ***p < 0.001. n = number of neurons as follows: sh-Control/Control, n = 14; sh-β-catenin/Control, n = 12; sh-N-cadherin/Control, n = 10; sh-p250GAP/Control, n = 13; sh-Control/Slitrk6, n = 16; sh-β-catenin/Slitrk6, n = 14; sh-N-cadherin/Slitrk6, n = 15; sh-p250GAP/Slitrk6, n = 16; sh-Control/NL-2, n = 22; sh-β-catenin/NL-2, n = 27; sh-N-cadherin/NL-2, n = 21; and sh-p250GAP/NL-2, n = 24. p values for Control condition: sh-Control vs sh-β-catenin, p > 0.9999; sh-Control vs sh-N-cadherin, p = 0.3904; and sh-Control vs sh-p250GAP, p > 0.9999. p values for Slitrk6 condition: sh-Control vs sh-β-catenin, p > 0.9999; sh-Control vs sh-N-cadherin, p < 0.0001; and sh-Control vs sh-p250GAP, p = 0.0121. p values for NL-2 condition: sh-Control vs sh-β-catenin, p > 0.9999; sh-Control vs sh-N-cadherin, p > 0.9999; and sh-Control vs sh-p250GAP, p > 0.9999. E, KD efficacies of shRNAs. Levels of target mRNAs were measured by qRT-PCR in cultured cortical neurons infected at DIV3 with lentiviruses expressing the indicated shRNAs. mRNAs were prepared at DIV12-DV13. Dotted line indicates the 70% knockdown cutoff level for tests of biological effects.
Figure 12.
Figure 12.
Effects of PTPσ extracellular domain and PTPδ intracellular domain on PTPσ-mediated heterologous synapse formation. A, Schematic illustration of PTPσ WT and mutants used in the experiments presented in B–D. B, Representative images of the heterologous excitatory or inhibitory synapse-formation activities of PTPσ WT and PTPσ/PTPδ Swap mutants. Neurons were infected at DIV4 with lentiviruses expressing sh-Control, sh-PTPσ, or sh-PTPδ, or coexpressing sh-PTPσ or sh-PTPδ with the indicated PTPσ or PTPδ expression vectors, and then cocultured from DIV9 to DIV11 with HEK293T cells expressing HA-Slitrk6 (Slitrk6) or neuroligin-2 fused to mVenus (NL-2). Neurons were stained with antibodies against HA (blue) and GAD67 or VGLUT1 (red). Scale bar (all images), 10 μm. C, D, The synapse-formation activity in B was quantified by measuring the ratio of GAD67 (C) or VGLUT1 (D) staining intensity (red) to HA/EGFP intensity (blue). Data are mean ± SEM. ANOVA with a nonparametric Kruskal–Wallis test: ***p < 0.001; ****p < 0.0001; ##p < 0.01; ###p < 0.001. n = number of neurons as follows: sh-Control/GAD67/Slitrk6, n = 16; sh-PTPδ/GAD67/Slitrk6, n = 15; + PTPδ/GAD67/Slitrk6, n = 16; + PTPσ Swap/GAD67/Slitrk6, n = 17; sh-Control/VGLUT1/Slitrk6, n = 15; sh-PTPσ/VGLUT1/Slitrk6, n = 15; + PTPσ WT/VGLUT1/Slitrk6, n = 12; + PTPσ Swap/VGLUT1/Slitrk6, n = 13; sh-Control/GAD67/NL-2, n = 21; sh-PTPδ/GAD67/NL-2, n = 23; sh-Control/VGLUT1/NL-2, n = 12; and sh-PTPσ/VGLUT1/NL-2, n = 11. p values for Slitrk6/GAD67 condition: sh-Control vs sh-PTPδ, p < 0.0001; sh-Control vs + PTPδ, p = 0.4456; sh-Control vs + PTPσ Swap, p = 0.4583; sh-PTPδ vs + PTPδ, p = 0.0064; and sh-PTPδ vs + PTPσ Swap, p = 0.0047. p values for Slitrk6/VGLUT1 condition: sh-Control vs sh-PTPσ, p = 0.0004; sh-Control vs + PTPσ, p > 0.9999; sh-control vs + PTPσ Swap, p > 0.9999; sh-PTPσ vs + PTPσ, p = 0.0019; and sh-PTPσ vs + PTPσ Swap, p = 0.0002. p values for NL-2/GAD67 condition: sh-Control vs sh-PTPδ, p > 0.9999. p values for NL-2/VGLUT1 condition: sh-Control vs sh-PTPσ, p > 0.9999.
Figure 13.
Figure 13.
Molecular model of PTPσ signaling pathways in heterologous synapse formation. A, PTPσ triggers excitatory heterologous synapse formation through a combination of extracellular and intracellular signaling components. The PTPσ D2 domain binds intracellular adaptor proteins (e.g., liprin-α) and substrates (e.g., p250GAP and N-cadherin) to recruit the vesicular machinery for excitatory synapse development. This signal transduction model differs from that of neurexin (see below). B, Neurexins serve as anchor proteins that transduce postsynaptic signals from various ligands (e.g., neuroligins and LRRTM proteins) and transfer them to adjacent, but as yet unidentified, coreceptor protein(s) to mediate the signal transduction cascades necessary for full heterologous synapse formation activity (Gokce and Südhof, 2013).

Similar articles

Cited by

References

    1. Aricescu AR, McKinnell IW, Halfter W, Stoker AW (2002) Heparan sulfate proteoglycans are ligands for receptor protein tyrosine phosphatase sigma. Mol Cell Biol 22:1881–1892. 10.1128/MCB.22.6.1881-1892.2002 - DOI - PMC - PubMed
    1. Bateman J, Reddy RS, Saito H, Van Vactor D (2001) The receptor tyrosine phosphatase dlar and integrins organize actin filaments in the Drosophila follicular epithelium. Curr Biol 11:1317–1327. 10.1016/S0960-9822(01)00420-1 - DOI - PubMed
    1. Boucard AA, Ko J, Südhof TC (2012) High affinity neurexin binding to cell adhesion G-protein-coupled receptor CIRL1/latrophilin-1 produces an intercellular adhesion complex. J Biol Chem 287:9399–9413. 10.1074/jbc.M111.318659 - DOI - PMC - PubMed
    1. Bresler T, Shapira M, Boeckers T, Dresbach T, Futter M, Garner CC, Rosenblum K, Gundelfinger ED, Ziv NE (2004) Postsynaptic density assembly is fundamentally different from presynaptic active zone assembly. J Neurosci 24:1507–1520. 10.1523/JNEUROSCI.3819-03.2004 - DOI - PMC - PubMed
    1. Bury LA, Sabo SL (2014) Dynamic mechanisms of neuroligin-dependent presynaptic terminal assembly in living cortical neurons. Neural Dev 9:13. 10.1186/1749-8104-9-13 - DOI - PMC - PubMed

Publication types

Substances