Review
. 2018 Jul 6;13(7):1085-1095.
doi: 10.2215/CJN.00340118. Epub 2018 Jun 22.

Clinical Pharmacokinetics in Kidney Disease: Fundamental Principles

Affiliations
Review

Clinical Pharmacokinetics in Kidney Disease: Fundamental Principles

Tom N Lea-Henry et al. Clin J Am Soc Nephrol. .

Abstract

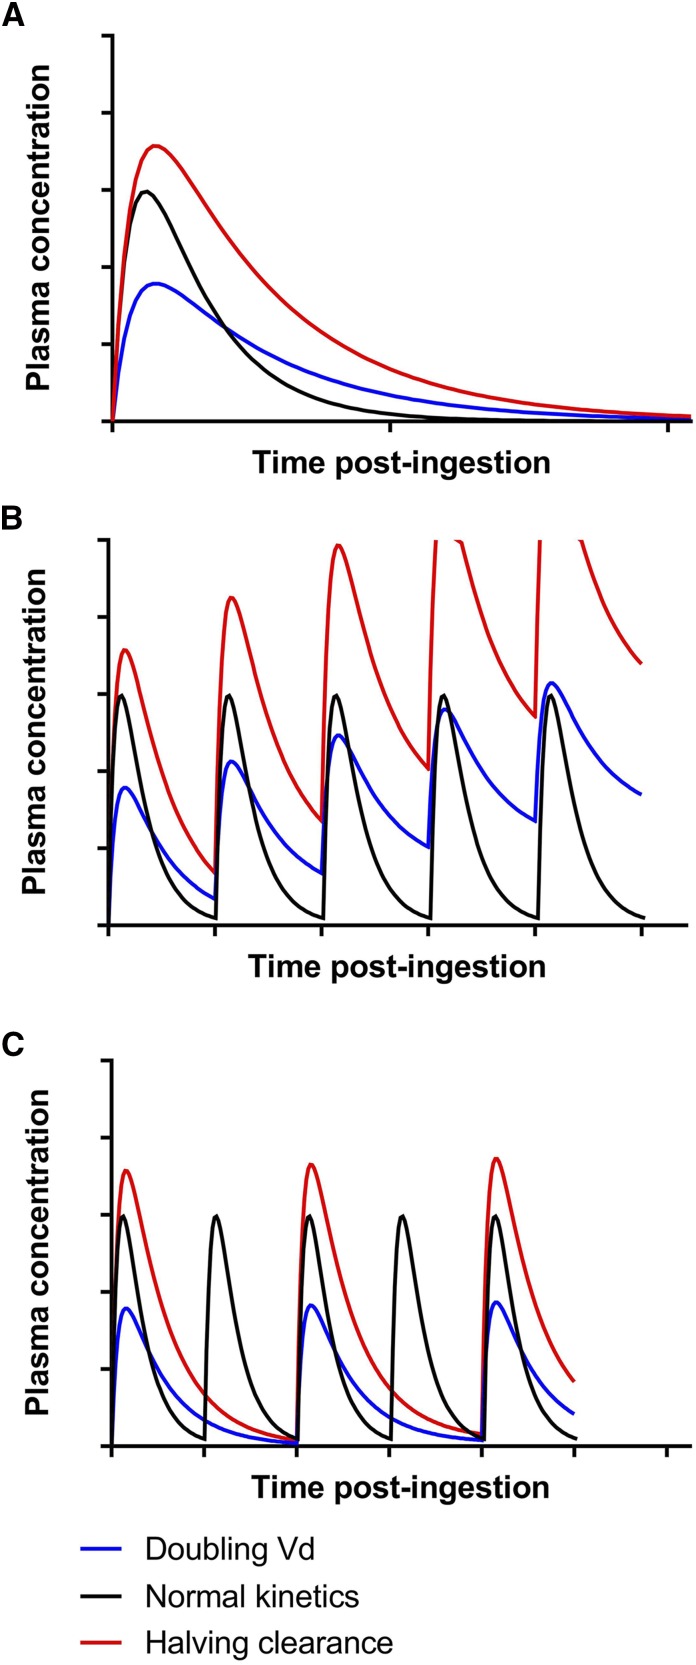
Kidney disease is an increasingly common comorbidity that alters the pharmacokinetics of many drugs. Prescribing to patients with kidney disease requires knowledge about the drug, the extent of the patient's altered physiology, and pharmacokinetic principles that influence the design of dosing regimens. There are multiple physiologic effects of impaired kidney function, and the extent to which they occur in an individual at any given time can be difficult to define. Although some guidelines are available for dosing in kidney disease, they may be on the basis of limited data or not widely applicable, and therefore, an understanding of pharmacokinetic principles and how to apply them is important to the practicing clinician. Whether kidney disease is acute or chronic, drug clearance decreases, and the volume of distribution may remain the same or increase. Although in CKD, these changes progress relatively slowly, they are dynamic in AKI, and recovery is possible depending on the etiology and treatments. This, and the use of kidney replacement therapies further complicate attempts to quantify drug clearance at the time of prescribing and dosing in AKI. The required change in the dosing regimen can be estimated or even quantitated in certain instances through the application of pharmacokinetic principles to guide rational drug dosing. This offers an opportunity to provide personalized medical care and minimizes adverse drug events from either under- or overdosing. We discuss the principles of pharmacokinetics that are fundamental for the design of an appropriate dosing regimen in this review.

Keywords: acute kidney injury; chronic kidney disease; clearance; dialysis; kidney disease; pharmacokinetics; volume of distribution.


Figures

Figure 1.
Figure 1.
Plasma concentration-time profile after oral administration of a single dose. The components relevant to the pharmacokinetics of a drug’s concentration-time profile are the peak or maximum plasma concentration (Cmax) and the time when it occurs (Tmax), the area under the concentration-time curve (represented as shaded area), and the elimination t1/2 (determined using the blue lines).
Figure 2.
Figure 2.
Changes in total drug clearance with declining kidney function relates to the extent of drug clearance by the kidney. Representation on the basis of Equation 3 for drugs with three different pharmacokinetic profiles. Here, Drug A is 100% cleared by the kidney, and therefore, it is predicted that a 50% decrease in GFR will correlate with a 50% decrease in total clearance, prompting a 50% decrease in dose or doubling of the dosing interval to maintain the same mean plasma concentration. Drugs from many classes can be represented: for example, antibiotics (A: β-lactams or aminoglycosides, B: macrolides, and C: fluoroquinolones), anticoagulants (A: dabigatran, B: warfarin, and C: rivaroxaban), and β-blockers (A: atenolol, B: metoprolol, and C: bisoprolol). Unfortunately, this representation is an oversimplification, because it does not consider changes to nonrenal clearance in kidney disease that occur with some drugs as discussed in the text.
Figure 3.
Figure 3.
Drug clearance by metabolism can also decrease with declining kidney function. Drawn from data presented by Rowland Yeo et al. (45), the analyses are of clearance data in clinical studies after correcting for differences in protein binding and blood to plasma partitioning. The drugs were chosen as a probe of different CYP450s (theophylline for 1A2, rosiglitazone for 2C8, bosentan for 2C9, omeprazole for 2C19, bufuralol for 2D6, and midazolam for 3A4). Although these data are illustrative, the effect on expression and activity of some cytochrome P450 isoenzymes is controversial. For example, some studies have identified progressive reductions in clearance by CYP2D6 (46), whereas others have found no difference in enzyme activity in advanced CKD for CYP3A4/5 (16,46) and CYP2C9 (47). Instead, the changes in metabolic clearances noted in CKD may also relate to changes in expression or function of drug transporters (for example, those on the hepatocyte cell membrane). Additional studies in human subjects are required to further clarify the extent of any effect.
Figure 4.
Figure 4.
Total kidney clearance is dependent on the contributions of each of glomerular filtration, secretion in the proximal tubule, and reabsorption in the distal tubule. OATP, organic anion transporting polypeptide; OCT, organic cation transporter.
Figure 5.
Figure 5.
A change in either volume of distribution or clearance has differing effects on the concentration-time profile. Graphs are drawn to scale for ready comparison. (A) A doubling in volume of distribution (Vd) and a halving of clearance have the same effect on the elimination t1/2, but they incur substantially different concentration-time profiles. Halving clearance leads to a doubling of the area under the concentration-time curve (Equation 6). The doubling in Vd leads to a reduction in maximum plasma concentration (Equation 2) but no change in the area under the concentration-time curve, despite the change in the concentration-time profile. (B) In patients with altered kinetics, continuous dosing will lead to drug accumulation if the regimen is not adjusted. Onset of toxicity will occur earlier from a decrease in clearance. (C) In patients with altered kinetics, increasing the dosing interval will prevent drug accumulation. Here, because the t1/2 was doubled in both cases, the dosing interval was also doubled. Although the trough concentrations are similar after the decrease in dosing frequency, the maximum plasma concentration and average concentration are lower when Vd is doubled, which may decrease the effectiveness of this regimen compared with in a patient with normal kinetics.

References

    1. Zhang Y, Zhang L, Abraham S, Apparaju S, Wu TC, Strong JM, Xiao S, Atkinson AJ Jr, Thummel KE, Leeder JS, Lee C, Burckart GJ, Lesko LJ, Huang SM: Assessment of the impact of renal impairment on systemic exposure of new molecular entities: Evaluation of recent new drug applications. Clin Pharmacol Ther 85: 305–311, 2009 - PubMed
    1. FDA: Pharmacokinetics in Patients with Impaired Renal Function—Study Design, Data Analysis, and Impact on Dosing and Labeling, 2010. Available at: https://www.fda.gov/downloads/drugs/guidancecomplianceregulatoryinformat.... Accessed December 24, 2017
    1. Khanal A, Castelino RL, Peterson GM, Jose MD: Dose adjustment guidelines for medications in patients with renal impairment: How consistent are drug information sources? Intern Med J 44: 77–85, 2014 - PubMed
    1. Duong JK, Roberts DM, Furlong TJ, Kumar SS, Greenfield JR, Kirkpatrick CM, Graham GG, Williams KM, Day RO: Metformin therapy in patients with chronic kidney disease. Diabetes Obes Metab 14: 963–965, 2012 - PubMed
    1. Leil TA, Feng Y, Zhang L, Paccaly A, Mohan P, Pfister M: Quantification of apixaban’s therapeutic utility in prevention of venous thromboembolism: Selection of phase III trial dose. Clin Pharmacol Ther 88: 375–382, 2010 - PubMed

Publication types

Substances