. 2018 Jun 22;9(1):2448.
doi: 10.1038/s41467-018-04913-2.

Pulmonary pericytes regulate lung morphogenesis

Affiliations

Pulmonary pericytes regulate lung morphogenesis

Katsuhiro Kato et al. Nat Commun. .

Abstract

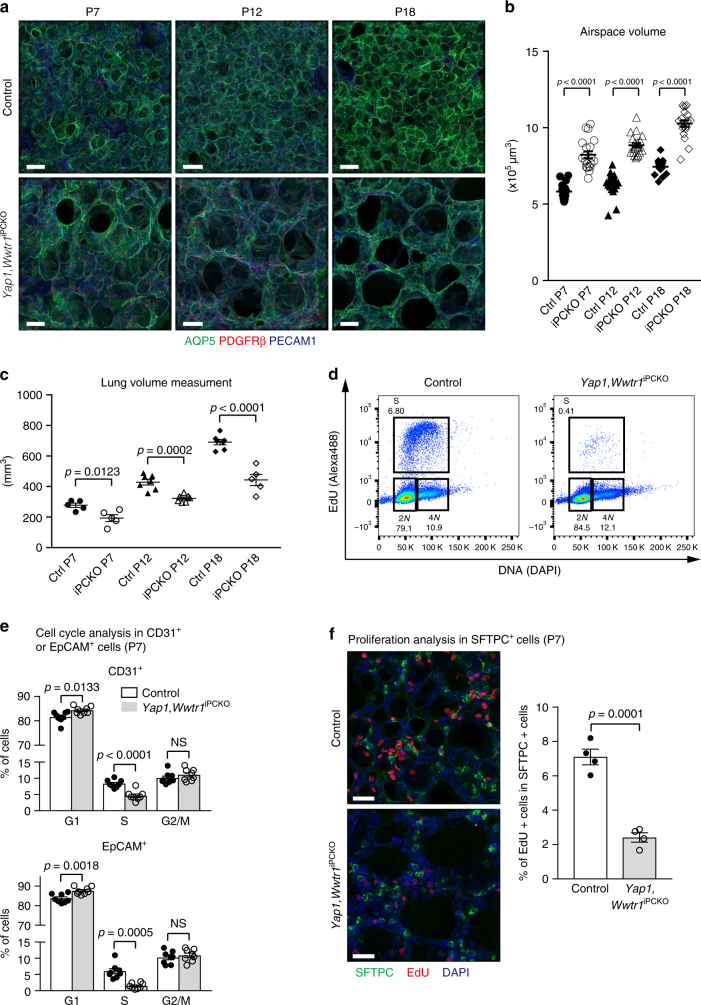
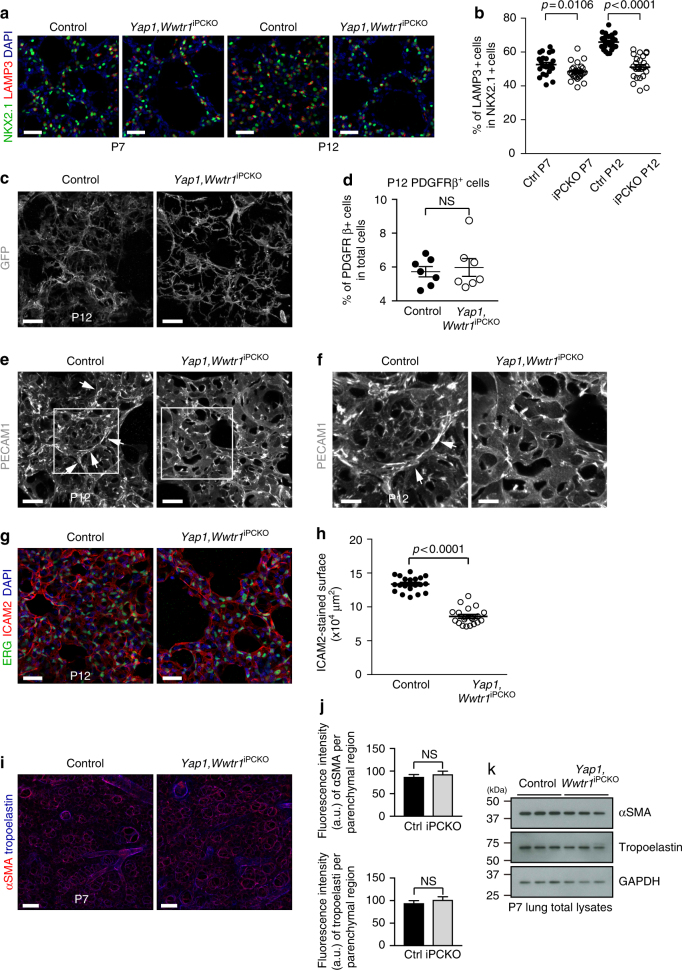
Blood vessels are essential for blood circulation but also control organ growth, homeostasis, and regeneration, which has been attributed to the release of paracrine signals by endothelial cells. Endothelial tubules are associated with specialised mesenchymal cells, termed pericytes, which help to maintain vessel wall integrity. Here we identify pericytes as regulators of epithelial and endothelial morphogenesis in postnatal lung. Mice lacking expression of the Hippo pathway components YAP and TAZ in pericytes show defective alveologenesis. Mutant pericytes are present in normal numbers but display strongly reduced expression of hepatocyte growth factor leading to impaired activation of the c-Met receptor, which is expressed by alveolar epithelial cells. YAP and TAZ are also required for expression of angiopoietin-1 by pulmonary pericytes, which also controls hepatocyte growth factor expression and thereby alveologenesis in an autocrine fashion. These findings establish that pericytes have important, organ-specific signalling properties and coordinate the behavior of epithelial and vascular cells during lung morphogenesis.


Conflict of interest statement

The authors declare no competing interests.

Figures

Fig. 1
Fig. 1
Characterisation of pulmonary pericytes during alveologenesis. a, b Three-dimensional reconstruction (a) and high magnification thin optical section (b) of confocal images with Airyscan detection showing AQP5-stained type 1 alveolar epithelial cells (green), PDGFRβ-stained pulmonary pericytes (PCs) (red) and PECAM1-stained endothelial cells (ECs) (blue) in lung at 4 weeks. Panels on the right show higher magnification of corresponding insets (a) or single channels (b). Scale bar, 30 µm (a, left), 15 µm (a, right), 10 µm (b, left) and 5 µm (b, right panels). c, d Three-dimensional reconstruction (c) and thin optical section (d) of confocal images showing SFTPC-stained, cuboidal AT2 cells (green), PDGFRβ-stained PCs (red) and RAGE-stained AT1 cells (blue) in lung at 4 weeks. Panels on the right show higher magnification of corresponding insets. Scale bar, 20 µm (left), 10 µm (right). e Quantitation of EC to PC ratio as measured in peripheral lung sections at different developmental stages. Data represents mean ± s.e.m. (n = 5 for P7, n = 6 for P21 and Adult mice). f Scheme showing the time points of tamoxifen administration (P1–3) and analysis for the Pdgfrb(BAC)-CreERT2 R26-mT/mG mice. gk High magnification images of Pdgfrb(BAC)-CreERT2 R26-mT/mG lung sections at indicated stages showing pulmonary GFP+ PCs (green), PECAM1+ ECs, PDGFRβ+ PCs, PDGFRα+ fibroblasts or αSMA+ bronchial smooth muscle cells/myofibroblasts (red, as indicated). Arrows in g indicate PC cell bodies, in gk GFP-positive PDGFRβ+ cells (g, h), GFP-negative PDGFRα+ cells (i) or αSMA+ cells (j, k) are marked. Scale bar, 20 µm (g, h), 15 µm (i, k) and 30 µm (j). l RT-qPCR analysis of Pdgfrb (pericytes), Pecam1 (endothelium), and Sftpc (epithelium) expression in freshly sorted GFP+, CD31+ or EpCAM+ cells from P7 Pdgfrb(BAC)-CreERT2 R26-mT/mG lung. Data represents mean ± s.e.m. (n = 4 mice)
Fig. 2
Fig. 2
Altered alveologenesis in PC-specific Yap1 and Wwtr1 mutant mice. a Three-dimensional reconstruction confocal images of Yap1,Wwtr1iPCKO and littermate control lungs stained for AQP5 (green), PDGFRβ (red), and PECAM1 (blue) at the indicated stages. Scale bar, 50 µm. b Quantitation of airspace volume in Yap1,Wwtr1iPCKO and control lung sections with three-dimensional reconstruction surface images. Data represents mean ± s.e.m. (n = 4 mice; unpaired two tailed student t-test or Welch’s t-test) c Lung volume measurement of Yap1,Wwtr1iPCKO and littermate control lungs at the indicated stages. Data represents mean ± s.e.m. (n = 5 for P7, n = 7 for P12, n = 7 for P18 controls, n = 5 for P18 mutant mice, two-tailed unpaired t-test). d Representative flow cytometry plots of EdU incorporation in EpCAM + cells from P7 Yap1,Wwtr1iPCKO and littermate control mice. e Diagrams showing flow cytometry cell cycle analysis of CD31+ or EpCAM+ cells in P7 Yap1,Wwtr1iPCKO and littermate control lungs. Data represents mean ± s.e.m. (n = 8 mice, NS: not significant, Unpaired two tailed student t-test or Welch’s t-test). f Three-dimensional reconstruction confocal images of P7 Yap1,Wwtr1iPCKO and littermate control lungs stained for SFTPC (green), EdU (red), and DAPI (blue). Quantitation of EdU positive and SFTPC positive cells is shown on the right. Data represents mean ± s.e.m. (n = 4; unpaired two tailed student t-test). Scale bar, 30 µm
Fig. 3
Fig. 3
Lung phenotype of PC-specific Yap1,Wwtr1 mutants. a Maximum intensity projections of P7 and P12 Yap1,Wwtr1iPCKO and littermate control lungs showing NKX2.1-stained (green) AT1 and AT2 cell nuclei, LAMP3-stained AT2 cells (red), and DAPI (blue). Scale bar, 30 µm. b Quantitation of NKX2.1 positive and LAMP3 positive cells shown in a. Data represents mean ± s.e.m. (n = 4 mice; two-tailed unpaired t-test or Welch’s t-test). c Three dimensional high magnification reconstruction images of Yap1,Wwtr1iPCKO R26-mT/mG and littermate control lungs stained for GFP (white). Scale bar, 20 µm. d Flow cytometric analysis of PDGFRβ+ pericytes in P12 Yap1,Wwtr1iPCKO and control lungs. Data represents mean ± s.e.m. (n = 7 mice; NS not significant, two-tailed unpaired t-test). e, f Confocal images of P12 Yap1,Wwtr1iPCKO and littermate control lungs stained for PECAM1 (white). Note formation of capillaries at the secondary septa in controls (arrowheads) but not in mutants. Panels in f show higher magnification of insets in e. Scale bar, 20 µm (e) and 10 µm (f). g Three-dimensional high magnification reconstruction images of P12 Yap1,Wwtr1iPCKO and littermate control lungs stained for ERG (green), ICAM2 (red), and DAPI (blue). Scale bar, 30 µm. h Quantitation of ICAM2-stained vascular density based on 3D reconstruction surface images, as shown in g. Data represents mean ± s.e.m. (n = 4 mice; unpaired two tailed student t-test) i Maximum intensity projections of P7 Yap1,Wwtr1iPCKO and littermate control lungs stained for αSMA (red) and tropoelastin (blue). Scale bar, 100 µm. j Quantitation of staining intensity for αSMA or tropoelastin shown in i. Signal intensity was normalized to the size of the parenchymal region. Data represents mean ± s.e.m. (n = 4 mice; NS not significant, two-tailed unpaired t-test). k Western blot analysis of αSMA and tropoelastin in P7 Yap1,Wwtr1iPCKO and littermate control total lung lysates (n = 3 mice). Molecular weight marker (kDa) is indicated
Fig. 4
Fig. 4
Gene expression changes in Yap1,Wwtr1iPCKO pericytes. a MA-plots of differentially regulated genes between P8 Yap1,Wwtr1iPCKO and control pericytes. The x-axis represents the mean normalized counts and the y-axis shows the log2 fold change. Differentially regulated genes are represented by red colored points (FDR-adjusted P-value < 0.01 and absolute log2 fold change > 0.5). b Gene ontology analysis for significantly differentially regulated genes (RNA-seq analysis) in Yap1,Wwtr1iPCKO and control pericytes. c RiboTag and RNA-seq-based expression levels of the indicated transcripts relative to P8 control. RPKM (reads per kilobase of exon per million mapped reads) values obtained from RNA-seq are shown. Data represents mean ± s.e.m. (n = 3). d RT-qPCR analysis of indicated transcripts in immunoprecipitated (IP) RNA from P7 Pdgfrb(BAC)-CreERT2 Rpl22HA lung, brain, heart, retina, and inguinal white adipose tissues (WAT). Data represents mean ± s.e.m. (n = 4 mice). e RT-qPCR analysis of Hgf and Met expression in freshly sorted GFP+, CD31+ or EpCAM+ cells from P7 Pdgfrb-CreERT2 R26-mT/mG lungs. Data represents mean ± s.e.m. (n = 4 mice). f High magnification images of P12 lungs stained for SFTPC (green), c-Met (red), and RAGE (blue). Arrows indicate SFTPC+ c-Met+ cells. Scale bar, 15 µm. g Hgf expression in freshly sorted PDGFRβ+ or CD31+ cells from P7 Yap1,Wwtr1iPCKO and littermate control lungs. Data represents mean ± s.e.m. (n = 5 mice; NS not significant, Welch’s t-test or two-tailed unpaired t-test). h Western blot analysis of total and phosphorylated c-Met (pMet) in P12 Yap1,Wwtr1iPCKO and control total lung lysates (n = 2 for controls and 4 for mutant mice). Molecular weight marker (kDa) is indicated. i RT-qPCR analysis of Hgf mRNA expression (left) and HGF levels in supernatants (right) from 1 µM Verteporfin (VP) treated cultured pericytes and controls at 48 h. Data represents mean ± s.e.m. (n = 4 and 6, Welch’s t-test). n.d. not detectable
Fig. 5
Fig. 5
Pericyte-derived Angpt1 controls alveologenesis. a RT-qPCR analysis of Angpt1 and Tie2/Tek expression in freshly sorted lung GFP+, CD31+ or EpCAM+ cells from P7 Pdgfrb(BAC)-CreERT2 R26-mT/mG mice. Data represents mean ± s.e.m. (n = 4 mice). b High magnification images of P10 Angpt1GFP lungs stained for GFP (green), PDGFRβ (red), and PDGFRα (blue). Arrows indicate GFP and PDGFRβ double positive pericytes. Scale bar, 15 µm. c RT-qPCR analysis of Angpt1 expression in freshly sorted PDGFRβ+ cells from P7 Yap1,Wwtr1iPCKO and control lungs. Data represents mean ± s.e.m. (n = 4 mice, two-tailed unpaired t-test). d Angpt1 expression in cultured Verteporfin (VP)-treated (48 h) and control pericytes. Data represents mean ± s.e.m. (n = 4, Welch’s t-test). e Expression of the indicated transcripts in freshly sorted CD31+ cells from P7 Yap1,Wwtr1iPCKO and control lungs. Data represents mean ± s.e.m. (n = 4 mice, NS not significant, two-tailed unpaired t-test). fh Western blot analysis of Angpt1 protein (f; n = 2 controls and 4 mutant mice) and of total and phospho-Tie2 (pTie2) in P12 Yap1,Wwtr1iPCKO and control total lung lysates (g, n = 3 controls and 5 mutants). Molecular weight marker (kDa) is indicated. Relative quantification of signals is shown in h. Two-tailed unpaired t-test. i Scheme showing the time points of tamoxifen administration and analysis for Angpt1 iPCKO mice. j, k 3D reconstruction confocal images of P12 Angpt1iPCKO and littermate control lungs stained for AQP5 (green), PDGFRβ (red), and PECAM1 (blue). Panels in k show higher magnification of PECAM1 staining. Scale bar, 50 µm (j) and 30 µm (k). l Quantitation of airspace volume in P12 Angpt1iPCKO and littermate control lung sections with 3D reconstruction surface images. Data represents mean ± s.e.m. (n = 4 mice; p < 0.0001, two-tailed unpaired t-test). m 3D reconstruction confocal images of P12 Angpt1iPCKO and littermate control lungs stained for αSMA (red) and tropoelastin (blue). Scale bar, 50 µm. n Quantitation of staining intensity for αSMA or tropoelastin shown in m. Intensity was normalized to the size of the parenchymal region. Data represents mean ± s.e.m. (n = 4 mice; NS not significant, two-tailed unpaired t-test). o Schematic summary of findings. Pulmonary pericytes regulate ECs and alveolar epithelial cells via angiocrine factors such as angiopoietin-1 and HGF

References

    1. Armulik A, Genove G, Betsholtz C. Pericytes: developmental, physiological, and pathological perspectives, problems, and promises. Dev. Cell. 2011;21:193–215. doi: 10.1016/j.devcel.2011.07.001. - DOI - PubMed
    1. Ding BS, et al. Endothelial-derived angiocrine signals induce and sustain regenerative lung alveolarization. Cell. 2011;147:539–553. doi: 10.1016/j.cell.2011.10.003. - DOI - PMC - PubMed
    1. Lammert E, Cleaver O, Melton D. Induction of pancreatic differentiation by signals from blood vessels. Science. 2001;294:564–567. doi: 10.1126/science.1064344. - DOI - PubMed
    1. Hu J, et al. Endothelial cell-derived angiopoietin-2 controls liver regeneration as a spatiotemporal rheostat. Science. 2014;343:416–419. doi: 10.1126/science.1244880. - DOI - PubMed
    1. Morrisey EE, Hogan BL. Preparing for the first breath: genetic and cellular mechanisms in lung development. Dev. Cell. 2010;18:8–23. doi: 10.1016/j.devcel.2009.12.010. - DOI - PMC - PubMed

Publication types

MeSH terms