Review
. 2019 Jan;24(1):88-107.
doi: 10.1038/s41380-018-0056-y. Epub 2018 Jun 22.

The ASD Living Biology: from cell proliferation to clinical phenotype

Affiliations
Review

The ASD Living Biology: from cell proliferation to clinical phenotype

Eric Courchesne et al. Mol Psychiatry. 2019 Jan.

Abstract

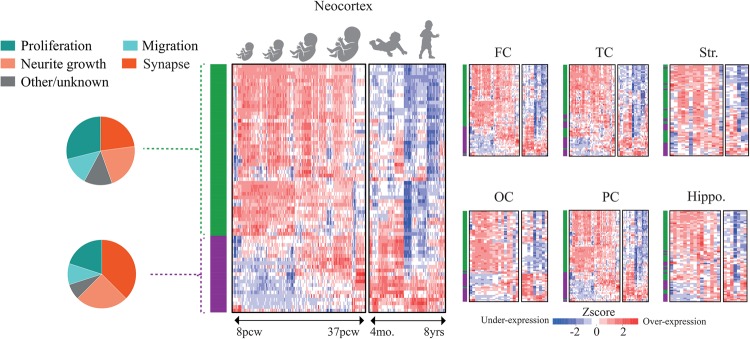
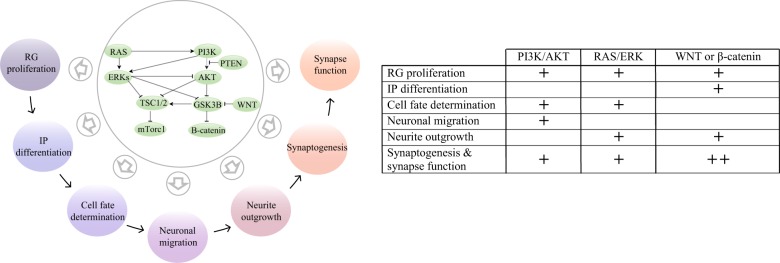
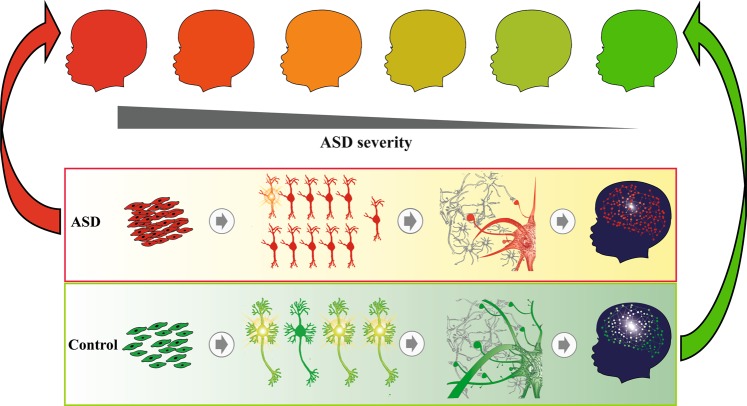
Autism spectrum disorder (ASD) has captured the attention of scientists, clinicians and the lay public because of its uncertain origins and striking and unexplained clinical heterogeneity. Here we review genetic, genomic, cellular, postmortem, animal model, and cell model evidence that shows ASD begins in the womb. This evidence leads to a new theory that ASD is a multistage, progressive disorder of brain development, spanning nearly all of prenatal life. ASD can begin as early as the 1st and 2nd trimester with disruption of cell proliferation and differentiation. It continues with disruption of neural migration, laminar disorganization, altered neuron maturation and neurite outgrowth, disruption of synaptogenesis and reduced neural network functioning. Among the most commonly reported high-confidence ASD (hcASD) genes, 94% express during prenatal life and affect these fetal processes in neocortex, amygdala, hippocampus, striatum and cerebellum. A majority of hcASD genes are pleiotropic, and affect proliferation/differentiation and/or synapse development. Proliferation and subsequent fetal stages can also be disrupted by maternal immune activation in the 1st trimester. Commonly implicated pathways, PI3K/AKT and RAS/ERK, are also pleiotropic and affect multiple fetal processes from proliferation through synapse and neural functional development. In different ASD individuals, variation in how and when these pleiotropic pathways are dysregulated, will lead to different, even opposing effects, producing prenatal as well as later neural and clinical heterogeneity. Thus, the pathogenesis of ASD is not set at one point in time and does not reside in one process, but rather is a cascade of prenatal pathogenic processes in the vast majority of ASD toddlers. Despite this new knowledge and theory that ASD biology begins in the womb, current research methods have not provided individualized information: What are the fetal processes and early-age molecular and cellular differences that underlie ASD in each individual child? Without such individualized knowledge, rapid advances in biological-based diagnostic, prognostic, and precision medicine treatments cannot occur. Missing, therefore, is what we call ASD Living Biology. This is a conceptual and paradigm shift towards a focus on the abnormal prenatal processes underlying ASD within each living individual. The concept emphasizes the specific need for foundational knowledge of a living child's development from abnormal prenatal beginnings to early clinical stages. The ASD Living Biology paradigm seeks this knowledge by linking genetic and in vitro prenatal molecular, cellular and neural measurements with in vivo post-natal molecular, neural and clinical presentation and progression in each ASD child. We review the first such study, which confirms the multistage fetal nature of ASD and provides the first in vitro fetal-stage explanation for in vivo early brain overgrowth. Within-child ASD Living Biology is a novel research concept we coin here that advocates the integration of in vitro prenatal and in vivo early post-natal information to generate individualized and group-level explanations, clinically useful prognoses, and precision medicine approaches that are truly beneficial for the individual infant and toddler with ASD.


Conflict of interest statement

The authors declare that they have no conflict of interest.

Figures

Fig. 1
Fig. 1
Illustration of early brain overgrowth in ASD. Brain overgrowth in the first years of life occurs in many ASD toddlers and is due to prenatal cell cycle dysregulation that causes an overabundance of cortical neurons. This is theorized to lead to disrupted neural network development and function, and ASD symptoms [–, , –34]. Unbiased, blinded stereological analyses find that young ASD male children have an average 67% more prefrontal neurons than controls [24]. Since cortical neuron generation occurs only in prenatal life in humans, this is direct evidence that ASD begins in the womb. As discussed in this review and previously [56], abnormal early brain undergrowth in toddlers with ASD may also be due to cell cycle dysregulation. Adapted from Courchesne et al. [7]
Fig. 2
Fig. 2
Developmental timeline relevant to ASD. Schematic of prominent processes occurring during different periods of human fetal and post-natal brain development. Adapted from Lombardo et al. [127]
Fig. 3
Fig. 3
Excess cell proliferation, abnormal synaptic development and reduced neural activity are associated with iPS cells of ASD toddlers with enlarged brains. a  ASD iPS cells proliferate more rapidly than control. The iPS cells from ASD and control were differentiated to NPCs. From passages 2 to 6, cells were plated at the same density and population doubling time at each passage was calculated. Results of all lines (2 clones per line) are presented as mean ± s.e.m. (*repeated measurements P = 0.02, post hoc P < 0.04). b ASD cell cycle has abnormally short G1 phase. Adherent monolayer NPCs from control and ASD iPS cells were dissociated, counted for calculation of population doubling time and prepared for cell cycle analysis. Results are presented as the time spent in each cell cycle stage (n ⩾ 4, mean ± s.e.m., analysis of variance (ANOVA) P < 0.04, post hoc P < 0.04 for comparing the time spent in G1 phase in the ASD NPCs with those of the control NPCs, respectively). c Control and ASD NPCs were immunostained with 4′,6-diamidino-2- phenylindole (DAPI; blue), anti-pHH3 (green) and anti-ki67 (red) (scale bar: 200 μm). Representative images of the staining are shown. d Quantification of the percentage of Ki67+ − and Ki67+ pHH3+ −labeled cells are presented as mean ± s.e.m. (n ⩾ 5; *P < 0.03 for comparing the results of the ASD with those of the control NPCs). e Greater proliferation rates in ASD were correlated with greater early brain overgrowth. Pairwise correlation between individual brain size (volume) and respective NPC cell line proliferation rates (% of Ki67-positive cells). ASD displays reduced and deviant synaptic development as shown in panels f and g.  f Representative images of synaptic processes from cells after neuronal differentiation (Map2, blue). The iPSC-derived neurons express markers for excitatory neurons, such as postsynaptic density protein 95 (PSD95, red) and vesicular glutamate transporter 1 (VGlut1, green) (scale bar: 5 μm). g Bar graphs show synaptic puncta size in ASD vs control neurons (P < 0.05 for comparing the results of the ASD with those of the control neurons), and GABA-positive neurons in all ASD-derived neurons compared with all controls (*P < 0.001). h ASD neural activity is sharply reduced. Representative image of number of spikes recorded over 10 min at 50 days of culture maturation (n = 3 wells per cell type). i  ASD neural activity is sharply reduced. Top, total number of spikes from data obtained from controls (n = 6) and ASD (n = 10) clonal lines differentiating over 30 days and controls (n = 4) and ASD (n = 9) clonal lines at 50 days after differentiation over 10 min of recording. Results are presented as mean ± s.e.m. (*P = 0.0046 for comparing the results of the ASD with control networks). Bottom, number of network bursts from wells that were able to generate bursts (10 spikes over 100 ms). Results are presented as mean ± s.e.m. (*P < 0.0001 for comparing the results of the ASD with control networks). Images adapted from Marchetto et al. [54]
Fig. 4
Fig. 4
The majority of hcASD genes show peak expression during prenatal life in different brain regions. Heatmaps demonstrate the developmental expression patterns (x-axis) of 69 hcASD genes (y-axis) in different brain regions in prenatal and post-natal development. In the large neocortex heatmap, hierarchical clustering of neocortex developmental transcriptome reveals two main clusters of genes, one cluster displayed in green and the other in purple (see y-axis of heatmap). Proliferation and neurogenesis hcASD genes make the largest contribution to the green cluster, and synapse development and function hcASD genes make the largest contribution to the purple cluster; see the two pie charts on the far left. This clustering pattern is present across different neocortex regions and, to a lesser degree, in hippocampus and striatum (see green and purple hcASD gene cluster patterns on y-axis of the other six heatmaps). FC: frontal cortex, Hippo: Hippocampus, OC: occipital cortex, PC: parietal cortex, Str: striatum, TC: temporal cortex.
Fig. 5
Fig. 5
Distribution of 58 hcASD genes in four main categories of neural development. Functional annotation could be found for 58 hcASD genes based on a manual literature search. Most highly penetrant ASD genes are pleiotropic, being involved in multiple stages of brain development. The small pie-charts in each region indicate the percentage of genes in green and purple clusters from Fig. 4. The gray color in pie-charts represents percentage of genes with no strong expression level in fetal and early post-natal periods. A gene is marked by an asterisk  (*) if its function was inferred from evidence in adult neural stem cells, embryonic or hematopoietic stem cells, central nervous system other than brain, or, for one gene, cancer (see Table S2 for details and references).
Fig. 6
Fig. 6
The RAS/ERK, PI3K/AKT, WNT and β-catenin signaling pathways are involved in different stages of brain development and are commonly disrupted in ASD. The schematic on the left indicates that these signaling pathways are highly interconnected and modulate different aspects of brain development. For this illustration, the pathways are simplified and some intermediate genes are not shown. In the table on the right, a plus sign  (+) for each pathway indicates that its dysregulation has been reported in the corresponding fetal developmental stages based on studies on either hcASD genes, ASD-derived neurons, or both (double plus signs).
Fig. 7
Fig. 7
In a single litter, a single prenatal poly(I:C) injection may cause different cortical layering defects across pups that resemble some types of focal cortical dysplasias seen in different individuals with ASD.  a Expression of multiple layer-specific markers (II–IV and V, VI) in mouse cortex from Choi and colleagues [81, 132]. Typical mouse cortex layer development is shown in upper left corner (PBS), while heterogeneous types of focal cortical dysplasia are caused by prenatal maternal immune activation (MIA) by synthetic dsRNA, poly(I:C) as shown in the other three panels. b In a single litter, a single prenatal poly(I:C) injection may cause different layering defects across pups including protrusions, intrusions and laminar disorganization and other types of focal cortical dysplasia as well as pups with typical cortex. The cortical and ASD-like behavioral MIA-caused phenotypes are dependent on maternal IL-17a. c A 9 year old ASD postmortem case with ADNP gene mutation has focal macroscopic frontal cortical surface malformation (white arrow) and interruption of underlying cortical layering as visualized by expression of multiple layer-specific and cell type specific markers (see region marked by the two light blue arrows; see Fig. 1 in Stoner et al [34]). Different marker genes represented by different colors. This focal region also has clusters of mis-migrated cells (not shown in this section). Inset shows the same cortex location visualized by nissl staining to further reveal surface undulation and protrusion (see black arrow). A 2 year old ASD postmortem case shown in d with surface intrusions visualized by nissl staining and in e with surface intrusion visualized by multiple layer-specific and cell type specific markers [34]. Adapted from Choi et al. [132] and Stoner et al. [34]
Fig. 8
Fig. 8
ASD is a multistage, progressive disorder of prenatal brain development. ASD children show a continuum of disorder severity because a wide range of heterogeneous insults can affect brain development in a not fully deterministic way. We propose the general theory that ASD arises from disruption of gene regulatory circuits with multiscale, hierarchical consequences on brain development starting from very early fetal stages. One possible prenatal trajectory of ASD is illustrated here. As compared with four fetal stages illustrated in typical development (lower panel; increasing fetal age from left to right), this ASD trajectory begins in the 1st and 2nd trimesters with abnormally high rates of proliferation; this results in excess neural precursor cells (ASD first panel). Disorder continues with disruption of migration, laminar disorganization, reduced cell growth, and reduced neurite outgrowth, resulting in neurons with a 10-fold decrease in spontaneous neural activity (ASD second panel). At still later stages, ASD neurons show defects in synaptogenesis, receptor and neurotransmitter development (ASD third panel). This deviant development of neurons leads to abnormal neural circuitry with a 6-fold decrease in synchronized bursts of neural network activity (ASD fourth panel). This also illustrates that ASD pathogenesis is not set at one point in time and does not reside in one process, but rather is a cascade of pathogenic processes. Different causes and prenatal times of insult combined with individual-dependent background genetics may alter details of developmental trajectories, resulting in differences in number, size and type of neurons in different cortical layers as well as number and functionality of synapses. This fetal heterogeneity leads to post-natal heterogeneity in neural circuits, behavior and clinical outcomes. Discovery of prenatal causes, processes and trajectories as they occur in children with ASD requires a paradigm shift: the ASD Living Biology approach. Courtesy of Eric Courchesne and Vahid H. Gazestani

References

    1. Kanner L. Autistic disturbances of affective contact. Nerv Child. 1943;2:217–50. - PubMed
    1. Constantino JN, Marrus N. The early origins of autism. Child Adolesc Psychiatr Clin N Am. 2017;26:555–70. - PubMed
    1. Dawson G, Meltzoff AN, Osterling J, Rinaldi J, Brown E. Children with autism fail to orient to naturally occurring social stimuli. J Autism Dev Disord. 1998;28:479–85. - PubMed
    1. Lord C, Bishop S, Anderson D. Developmental trajectories as autism phenotypes. Am J Med Genet C Semin Med Genet. 2015;169:198–208. - PMC - PubMed
    1. Courchesne E, Karns C, Davis HR, Ziccardi R, Carper R, Tigue Z, et al. Unusual brain growth patterns in early life in patients with autistic disorder: An MRI study. Neurology. 2001;57:245–54. - PubMed

Publication types