. 2018 Jun 22;8(1):9517.
doi: 10.1038/s41598-018-27912-1.

Expression ratio of the TGFβ-inducible gene MYO10 is prognostic for overall survival of squamous cell lung cancer patients and predicts chemotherapy response

Affiliations

Expression ratio of the TGFβ-inducible gene MYO10 is prognostic for overall survival of squamous cell lung cancer patients and predicts chemotherapy response

D Dvornikov et al. Sci Rep. .

Abstract

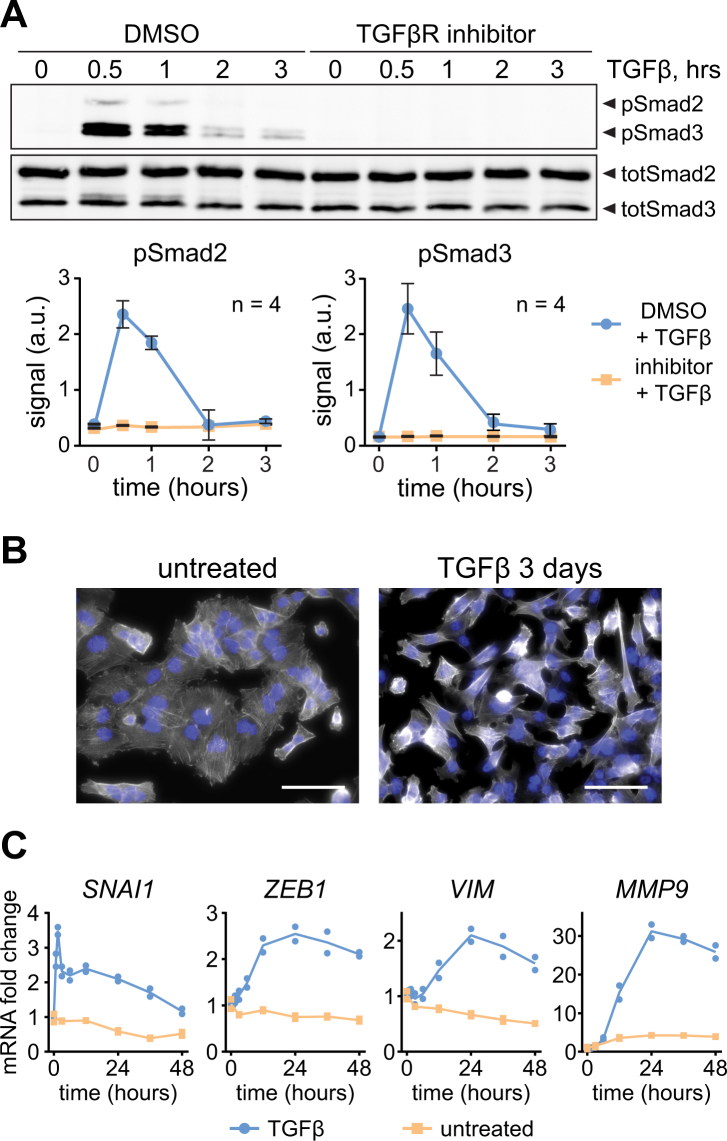
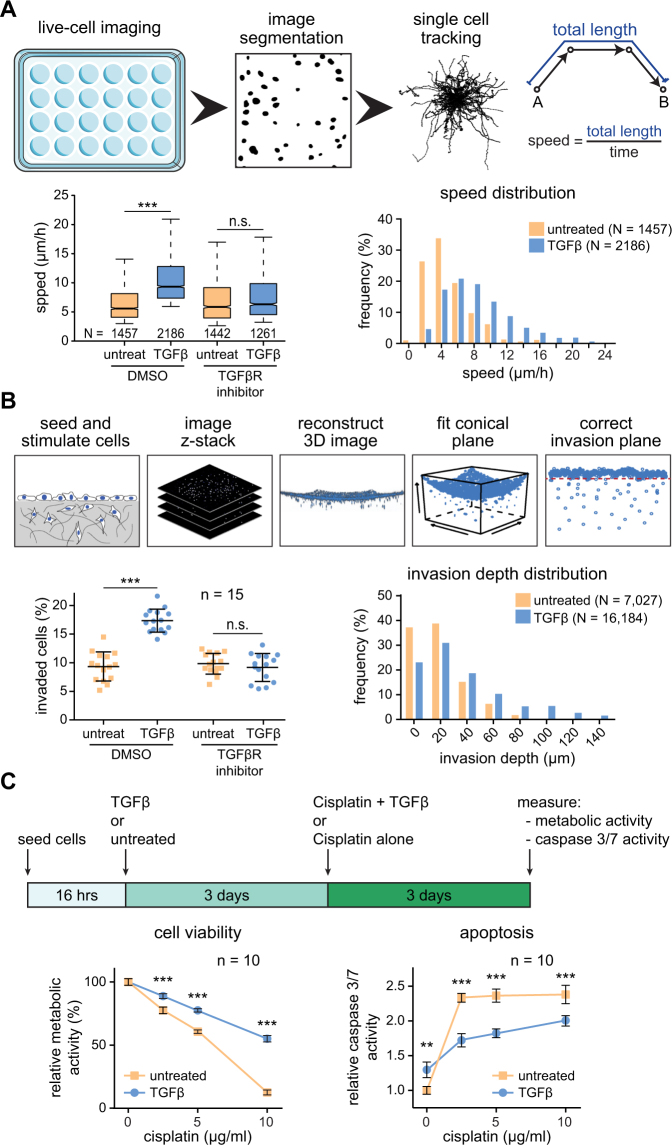
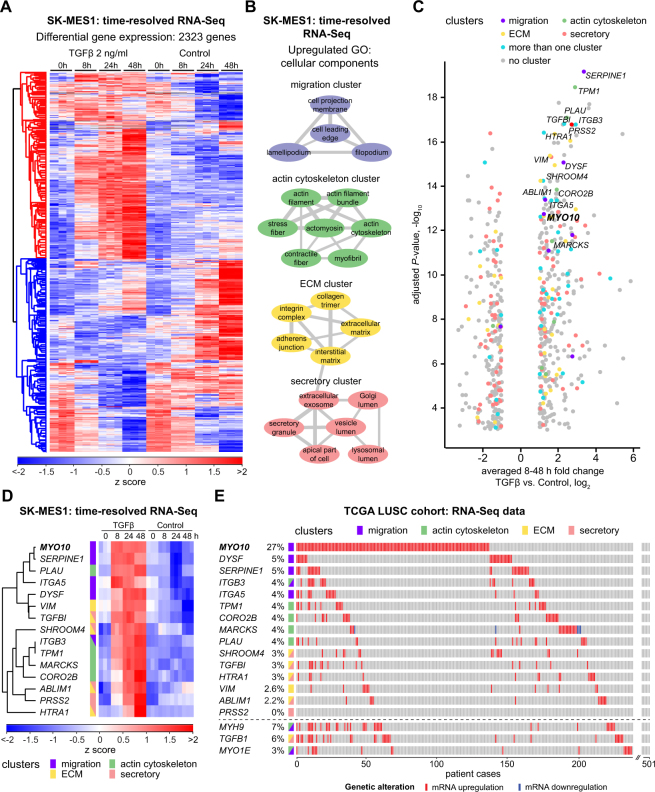
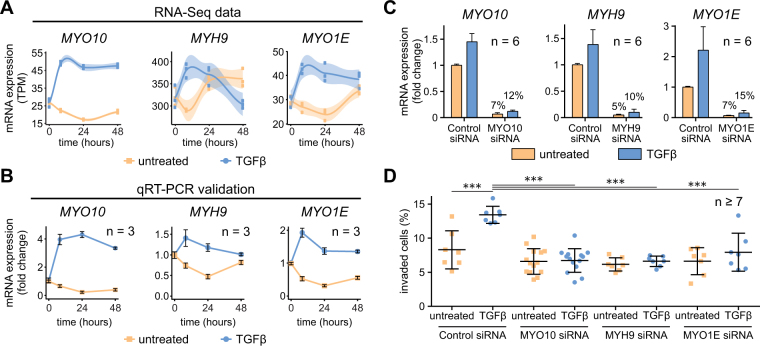
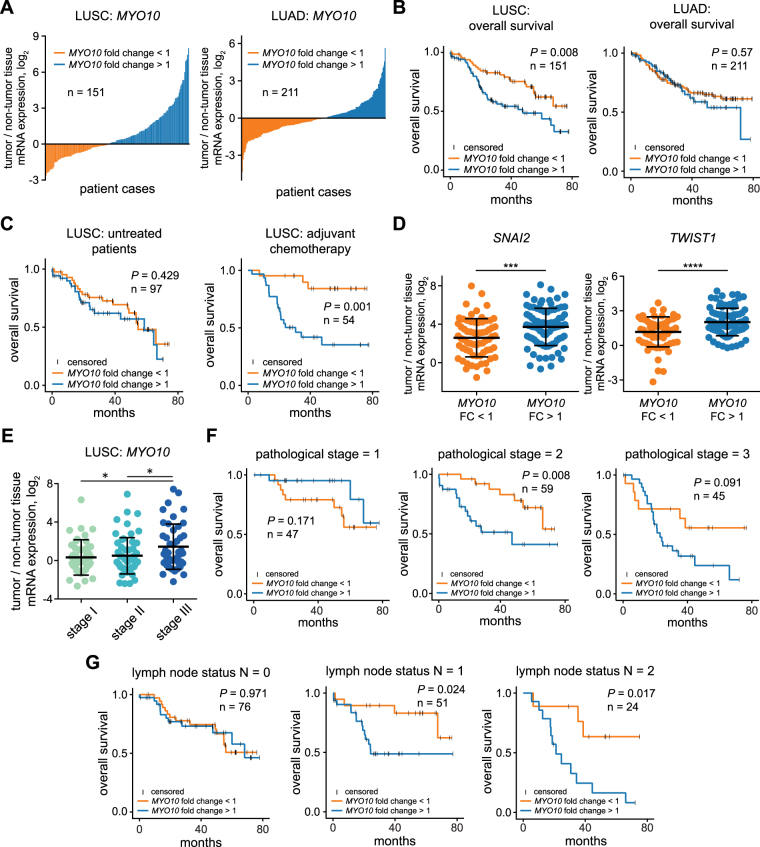
In lung cancer a deregulation of Transforming Growth Factor-β (TGFβ) signaling has been observed. Yet, the impact of TGFβ in squamous cell carcinoma of the lung (LUSC) remained to be determined. We combined phenotypic and transcriptome-wide studies and showed that the stimulation of the LUSC cell line SK-MES1 with TGFβ results in an increase of migratory invasive properties. The analysis of the dynamics of gene expression by next-generation sequencing revealed that TGFβ stimulation orchestrates the upregulation of numerous motility- and actin cytoskeleton-related genes. Among these the non-muscle myosin 10 (MYO10) showed the highest upregulation in a LUSC patient cohort of the Cancer Genome Atlas (TCGA). Knockdown of MYO10 abrogated TGFβ-induced collagen gel invasion of SK-MES1 cells. The analysis of MYO10 mRNA expression in paired tissues of 151 LUSC patients with corresponding 80-month clinical follow-up data showed that the mRNA expression ratio of MYO10 in tumor and tumor-free tissue is prognostic for overall survival of LUSC patients and predictive for the response of these patients to adjuvant chemotherapy. Thus, MYO10 represents a new clinical biomarker for this aggressive disease and due to its role in cellular motility and invasion could serve as a potential molecular target for therapeutic interventions in patients with LUSC.


Conflict of interest statement

The authors declare no competing interests.

Figures

Figure 1
Figure 1
TGFβ treatment triggers EMT in SK-MES1 cells. (A) TGFβ induces Smad2/3 phosphorylation in TGFβR1-dependent way. SK-MES1 cells were pretreated with TGFβR1 inhibitor SB-431542 or DMSO and then stimulated with 2 ng/ml TGFβ1. Data presented correspond to mean and SD, n is the number of independent experiments. Additional replicates are shown in Supplementary Fig. S1A. Full-length blots are shown in Supplementary Fig. S6. (B) Prolonged exposure of SK-MES1 cells to TGFβ1 induces acquisition of EMT-like morphology. Cells were either stimulated with 2 ng/ml TGFβ1 or left untreated for 3 days, fixed and stained for F-actin (white) and DNA (blue). Scale bar corresponds to 50 µm. (C) EMT marker genes are upregulated upon TGFβ1 treatment. Growth factor-depleted SK-MES1 cells were stimulated with 2 ng/ml TGFβ1 or left untreated. RNA was extracted and analyzed using qRT-PCR. mRNA expression was normalized to four housekeepers: GUSB, HPRT, GAPDH and G6PD. Each dot represents a biological replicate. A second independent experiment is shown in Supplementary Fig. S1B.
Figure 2
Figure 2
TGFβ treatment increases invasiveness and cisplatin resistance of squamous lung carcinoma cells SK-MES1. (A) Top, schematics of the 2D migration assay. Bottom, migratory properties of SK-MES1 cells are increased upon TGFβ treatment. Cells were seeded in 24-well plate, pretreated with either SB-431542 or DMSO, stimulated with 2 ng/ml TGFβ1 and imaged for 60 hours. Migration speed from each single cell track was quantified. Center lines show the medians; box limits indicate the 25th and 75th percentiles; whiskers extend to 5th and 95th percentiles, N indicates the number of quantified single cell tracks per condition. Additional independent experiments are shown in Supplementary Fig. S2A. Statistical analysis was performed using one-way ANOVA; ***P < 0.001; n.s., not significant. (B) Top, schematics of the collagen 3D invasion assay. Bottom, TGFβ stimulation increases number of invading cells and the average invasion depth. SK-MES1 cells were seeded in 96-well plates with precast collagen gels, allowed to attach overnight, growth factor-depleted for three hours, pretreated with either SB-431542 or DMSO, stimulated with 2 ng/ml TGFβ1, allowed to invade for four days, stained with Hoechst and imaged with a confocal microscope. The number of invaded cells and invasion depth were assessed. One representative experiment is shown. Data are presented as median and SD, every dot corresponds to a biological replicate (n = 15). N indicates the number of invaded cells. Additional independent experiments are shown in Supplementary Fig. S2B. Statistical analysis was performed using one-way ANOVA; ***P < 0.001; n.s., not significant. (C) Top, schematics of the experimental setup. Bottom, pre-treatment with TGFβ1 reduces sensitivity of SK-MES1 cells to cisplatin treatment. Cells were seeded in 96-well plate, stimulated with either 2 ng/ml TGFβ1 or left untreated for 3 days and then exposed to increasing doses of cisplatin for 3 days. Cell viability and caspase 3/7 activity were assessed. Data presented correspond to mean and SD, n is the number of biological replicates. Additional independent experiments are shown in Supplementary Fig. S1C. Statistical analysis was performed using one-way ANOVA; **P < 0.01; ***P < 0.001.
Figure 3
Figure 3
TGFβ treatment оf LUSC cells results in upregulation of migration- and actin cytoskeleton-related genes. (A) Non-supervised hierarchical clustering of z-scored differentially regulated 2323 genes (adjusted P-value < 0.01) between TGFβ-treated and untreated conditions. SK-MES1 cells were stimulated with 2 ng/ml TGFβ or left untreated. RNA was extracted and sequenced using HiSeq 4000. (B) Clusters of significantly upregulated GO cellular component gene sets between TGFβ-treated and untreated conditions. Significantly upregulated GO terms (adjusted P-value < 0.01) were visualized using REVIGO (allowed similarity 0.5). Thickness of connecting grey lines corresponds to the similarity of the GO terms. Only clusters that consist of at least two GO terms are displayed. (C) Volcano plot of differentially regulated genes between TGFβ-treated and untreated conditions. Fold change of averaged 8–48 h time points between both conditions is displayed. Only significantly regulated genes (adjusted P-value < 0.01) with a fold change of at least two are shown. Five most regulated genes from each cluster of upregulated GO cellular component gene sets are indicated with corresponding colors. Grey circles indicate differentially regulated genes that do not belong to any of the four clusters. (D) Time-resolved dynamics of top differentially regulated candidate genes from each of the clusters. Top five genes from each of the four clusters with the lowest adjusted P-values and fold change of at least two after normalization to untreated samples were selected as candidates. In case the same gene belonged to different clusters and satisfied the inclusion criteria, it was marked as belonging to both clusters. Single gene plots are shown in the Supplementary Fig. S3A. (E) TCGA LUSC cohort RNA-Seq expression data of selected candidate genes sorted by frequency of mRNA upregulation. MYH9, TGFB1 and MYO1E genes were additionally included.
Figure 4
Figure 4
TGFβ-inducible myosins are required for TGFβ-mediated cancer cell invasion. (A) Time-resolved RNA-Seq data of selected myosin genes upon TGFβ treatment in SK-MES1 cells. Cells were growth factor-depleted for three hours and stimulated with 2 ng/ml TGFβ1 or left untreated. mRNA was extracted and sequenced using HiSeq 4000. Data are presented in TPM (transcripts per million) values. Each dot represents a biological replicate, shaded areas correspond to standard error. (B) qPCR validation of RNA-Seq data. RNA of TGFβ-treated and untreated SK-MES1 cells that was used for RNA-Seq was also analyzed with qRT-PCR. Data presented correspond to mean and SD from three biological replicates. (C) siRNA knockdown results in 90% knockdown efficiency of TGFβ-inducible myosins. After 36 hours of siRNA transfection SK-MES1 cells were stimulated for 1 hour with 2 ng/ml TGFβ1 or left untreated. mRNA was extracted and the knockdown efficiency was analyzed using qRT-PCR. Data represent mean and SD from six biological replicates. (D) Myosins knockdowns inhibit TGFβ-mediated cancer cell invasion. SK-MES1 cells were transfected with siRNAs for 36 hours and stimulated with 2 ng/ml TGFβ1 for four days. Amount of invaded cells into the collagen gel was assessed. One representative experiment is shown. Every dot corresponds to a biological replicate (n ≥ 7), black line indicates the median. Additional independent experiment is shown in Supplementary Fig. S4C. Statistical analysis was performed using one-way ANOVA; ***P < 0.001.
Figure 5
Figure 5
MYO10 mRNA expression ratio is prognostic for overall survival of LUSC but not LUAD patients. (A) MYO10 mRNA expression ratio of tumor and adjacent non-tumor tissues in LUSC and LUAD patients. RNA was isolated from fresh-frozen resected tissues and MYO10 expression was measured using qRT-PCR. (B) Kaplan-Meier curves for overall survival using MYO10 mRNA expression ratio in LUSC and LUAD cohorts. Significance of difference between the two groups was tested using non-parametric Mann-Whitney U test. (C) Kaplan-Meier curves for adjuvant chemotherapy response in MYO10 low (left) and MYO10 high (right) patients. Significance of difference between the two groups was tested using non-parametric Mann-Whitney U test. (D) Differences of SNAI2 and TWIST1 expression depending on MYO10 mRNA expression ratio were tested by unpaired t-tests; ***P < 0.001; ****P < 0.0001. (E) MYO10 expression ratio in different stages of LUSC. Differences were tested by one-way ANOVA; *P ≤ 0.05. (F) Kaplan-Meier curve for the pathological stages of LUSC patients. Significance of difference between the two groups was tested using non-parametric Mann-Whitney U test. (G) Kaplan-Meier curves for lymph node status using MYO10 mRNA expression ratio. Significance of difference between the two groups was tested using non-parametric Mann-Whitney U test.

References

    1. Rami-Porta R, Crowley JJ, Goldstraw P. The revised TNM staging system for lung cancer. Ann Thorac Cardiovasc Surg. 2009;15:4–9. - PubMed
    1. Drilon A, Rekhtman N, Ladanyi M, Paik P. Squamous-cell carcinomas of the lung: emerging biology, controversies, and the promise of targeted therapy. Lancet Oncol. 2012;13:e418–426. doi: 10.1016/S1470-2045(12)70291-7. - DOI - PubMed
    1. Rooney M, Devarakonda S, Govindan R. Genomics of squamous cell lung cancer. The oncologist. 2013;18:707–716. doi: 10.1634/theoncologist.2013-0063. - DOI - PMC - PubMed
    1. Kim ES, et al. Gefitinib versus docetaxel in previously treated non-small-cell lung cancer (INTEREST): a randomised phase III trial. Lancet. 2008;372:1809–1818. doi: 10.1016/S0140-6736(08)61758-4. - DOI - PubMed
    1. Yu M, et al. Circulating breast tumor cells exhibit dynamic changes in epithelial and mesenchymal composition. Science. 2013;339:580–584. doi: 10.1126/science.1228522. - DOI - PMC - PubMed

Publication types

MeSH terms