. 2018 Jun 22;8(1):9510.
doi: 10.1038/s41598-018-27818-y.

Atlantic salmon skin barrier functions gradually enhance after seawater transfer

Affiliations

Atlantic salmon skin barrier functions gradually enhance after seawater transfer

Christian Karlsen et al. Sci Rep. .

Abstract

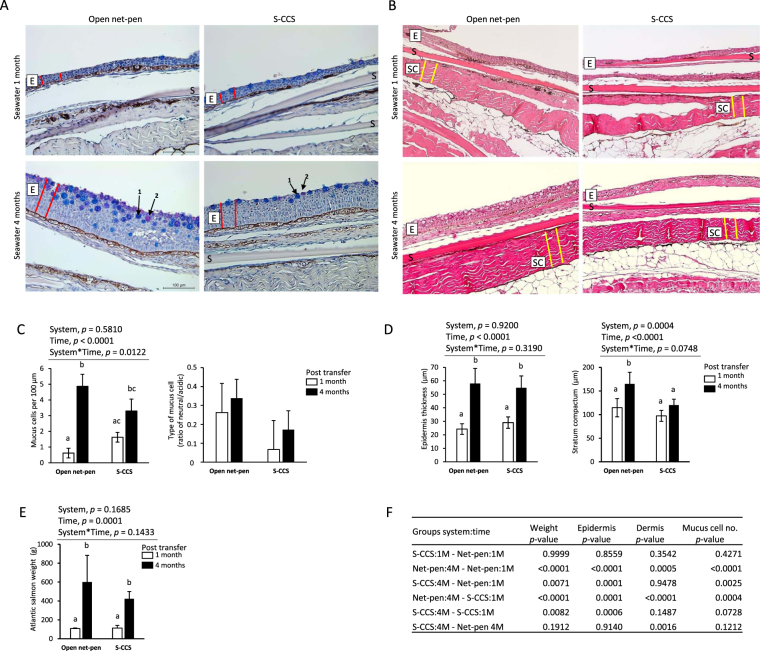
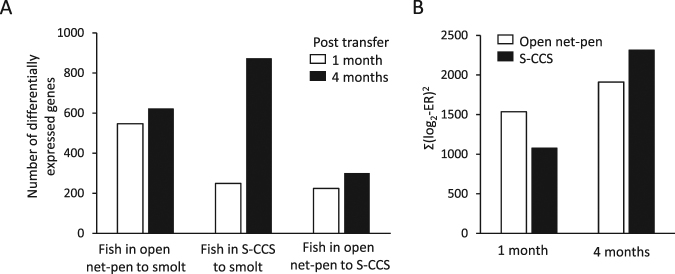
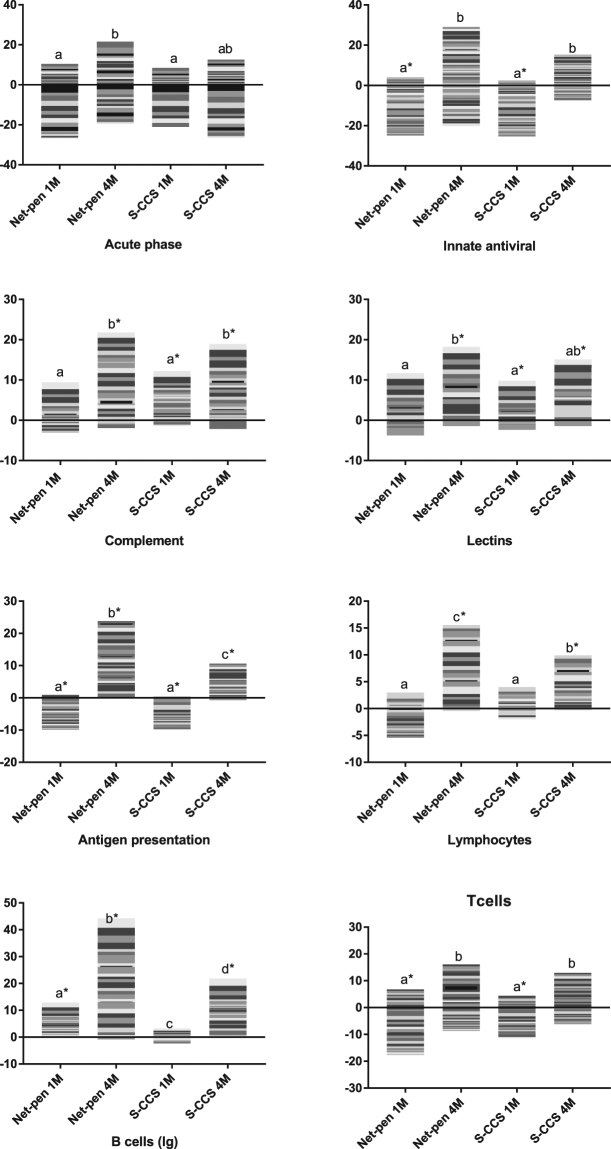
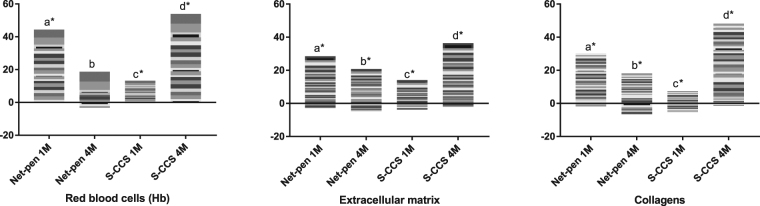
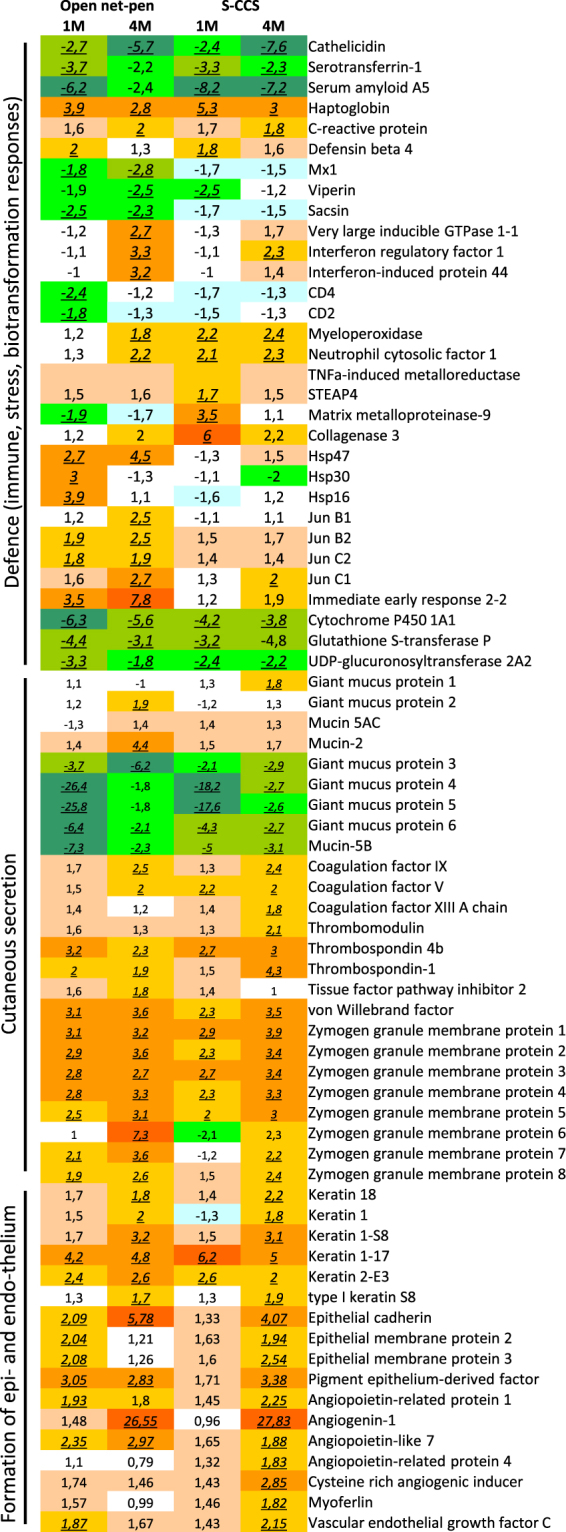
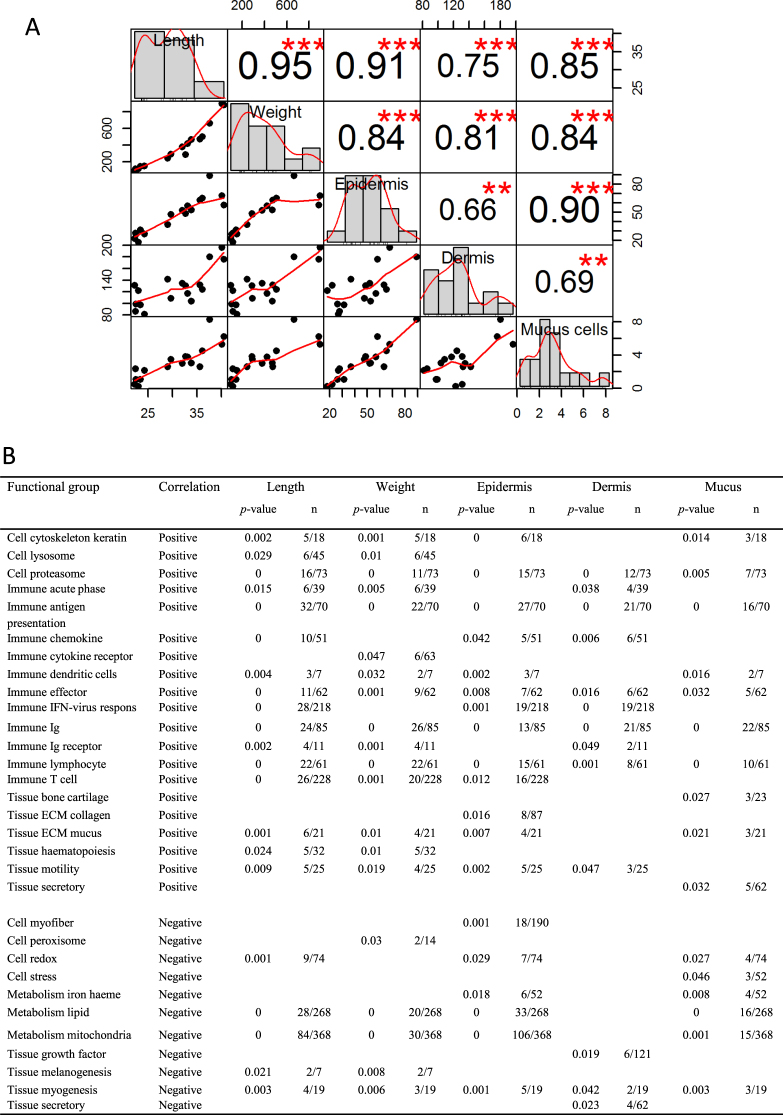
Atlantic salmon farming operates with high production intensities where skin integrity is recognized as a central factor and indicator for animal health and welfare. In the described trial, the skin development and its immune status in healthy Atlantic salmon reared in two different systems, a traditional open net-pen system and a semi-closed containment system, were investigated. Freshwater smolts were compared to post-smolts after 1 and 4 months in seawater. Growth performance, when adjusted for temperature, was equal between the systems. Skin analyses, including epidermis and dermis, showed that thickness and mucus cell numbers increased in pace with the growth and time post seawater transfer (PST). Gene expression changes suggested similar processes with development of connective tissue, formation of extracellular matrix and augmented cutaneous secretion, changes in mucus protein composition and overall increased immune activity related to gradually enforced protection against pathogens. Results suggest a gradual morphological development in skin with a delayed recovery of immune functions PST. It is possible that Atlantic salmon could experience increased susceptibility to infectious agents and risk of diseases during the first post-smolt period.


Conflict of interest statement

The authors declare no competing interests.

Figures

Figure 1
Figure 1
Representative images of Atlantic salmon skin 1 on 4 months post seawater transfer reared in net-pen or semi-closed containment systems (S-CCS). (A) Images displaying mucus cells assessed on alcian blue-periodic acid Stiff (AB-PAS) stained sections. AB-PAS stains the mucins in the goblet cells: acidic mucins stain blue (arrow 1) and neutral mucins stain pink-red (arrow 2). Epidermis layer indicated by a boxed E was measured by thickness (μm) as illustrated by red lines. S, scale. (B) Differences in the dermis stratum compactum (boxed SC) layer thickness (μm) was measured as illustrated by yellow lines. (C) Cells stained positive by AB-PAS were counted as goblet cells and presented as mucus cells per 100 µm. Numbers of mucus cells are different with time. The presence of different types of mucus cells is presented as the ratio between neutral and acidic stained cells. (D) Quantitative assessments (n = 10 measurements per sample) showing an increase in mean epidermal thickness between time-points but not systems. Thickness in stratum compactum of net-pen fish 4 months post seawater transfer was different to other groups. (E) Weight of Atlantic salmon used for histology sampling increased between time-points. Bars in all histograms represent the mean ± SD (n = 6 biological samples). Plots were analysed with two-way ANOVA (results in C-E above each graph where one or both variables are significant) and post hoc differences tested by Tukey HSD. Bars not sharing common letters are significantly different (p < 0.05). (F) Pairwise multiple comparisons of weight, epidermis, dermis and mucus measurements showing p-values from Tukey HSD.
Figure 2
Figure 2
Transcriptome changes in skin of Atlantic salmon post-smolts. (A) Numbers of differentially expressed genes comparing smolts in freshwater to post-smolt in open net-pen and S-CCS, 1 and 4 months post seawater transfer. The number of differently expressed genes in skin of Atlantic salmon between the two rearing systems at 1 and 4 months post seawater transfer is shown to the right. (B) Magnitude of expression changes in comparison with smolts.
Figure 3
Figure 3
Expression profiles from microarray data in skin of Atlantic salmon reared in either net-pen or semi-closed containment systems (S-CCS) sampled 1 (1 M) and 4 (4 M) months post seawater transfer. Groups of genes involved in immunity. Stacked columns represent log2-ER to smolts. Each band corresponds to a gene (microarray feature) presented in a white to black scale, but which is not comparable across functional groups. Comparisons between smolts (freshwater) and post-smolts (seawater), systems and time-points (in seawater) were performed. Bars not sharing common letters are different (p < 0.05 and log2-ER > |0.8| (1.74-fold)), difference from smolts in freshwater is indicated with*.
Figure 4
Figure 4
Expression profiles from microarray data in skin of Atlantic salmon reared in either net-pen or semi-closed containment systems (S-CCS) sampled 1 (1 M) and 4 (4 M) months post seawater transfer. Genes encoding markers of erythrocytes, proteins of extracellular matrix and collagens. Stacked columns represent log2-ER to smolts. Each band corresponds to a gene (microarray feature) presented in a white to black scale, but which is not comparable across functional groups. Comparisons between smolts (freshwater) and post-smolts (seawater), systems and time-points (in seawater) were performed. Bars not sharing common letters are different (p < 0.05 and log2-ER > |0.8| (1.74-fold)), difference from smolts in freshwater is indicated with*.
Figure 5
Figure 5
Examples of differently expressed genes involved in defence (immune and stress responses, biotransformation), cutaneous secretion and formation of epithelium and endothelium. Data are folds to freshwater smolts, differently expressed genes (>1.74-fold, p < 0.05) are indicated with underlined italics.
Figure 6
Figure 6
Correlation between physiological variables and gene transcription patterns. (A) Chart showing patterns of correlations across fish length, fish weight, skin epidermis thickness, skin dermis thickness and number of skin mucus cells. The distribution of each variable is shown on the diagonal. The bottom part of the diagonal shows scatter plots of the physiological measurements with a fitted line displayed. The top part shows the Pearson correlation coefficients for all pairs of variables including significant correlations marked by red stars with p-value: ***<0.001, **<0.01. (B) Results for positively followed by negatively correlated genes to the five variables. Fisher-test p-values are shown (all results for p > 0.05 were removed). Numbers of correlated genes are shown in column “n” together with the total number of genes in the respective category on the array.

References

    1. Iversen, A., Andreassen, O., Hermansen, Ø., Larsen, T. & Terjesen, B. Aquaculture Technology and Competitiveness. Nofima, Tromsø, Norway, doi:ISBN: 978-82-8296-106-6 (2013).
    1. Aunsmo A, et al. Methods for investigating patterns of mortality and quantifying cause-specific mortality in sea-farmed Atlantic salmon Salmo salar. Diseases of Aquatic Organisms. 2008;81:99–107. doi: 10.3354/dao01954. - DOI - PubMed
    1. Hjeltnes B., Bang-Jensen B., Bornø G., Haukaas A. & S., W. C. Fish health report 2017. Norwegian Veterinary Institute report serie (2018).
    1. Lunder T, et al. Phenotypic and genotypic characterization of Vibrio viscosus sp. nov. and Vibrio wodanis sp. nov. isolated from Atlantic salmon (Salmo salar) with ‘winter ulcer’. International Journal of Systematic and Evolutionary Microbiology. 2000;50:427–450. doi: 10.1099/00207713-50-2-427. - DOI - PubMed
    1. Sveen LR, et al. Impact of fish density and specific water flow on skin properties in Atlantic salmon (Salmo salar L.) post-smolts. Aquaculture. 2016;464:629–637. doi: 10.1016/j.aquaculture.2016.08.012. - DOI

Publication types