Comparative Study
. 2018 Sep 1:408:11-21.
doi: 10.1016/j.tox.2018.06.008. Epub 2018 Jun 20.

Does growth impairment underlie the adverse effects of dexamethasone on development of noradrenergic systems?

Affiliations
Comparative Study

Does growth impairment underlie the adverse effects of dexamethasone on development of noradrenergic systems?

Theodore A Slotkin et al. Toxicology. .

Abstract

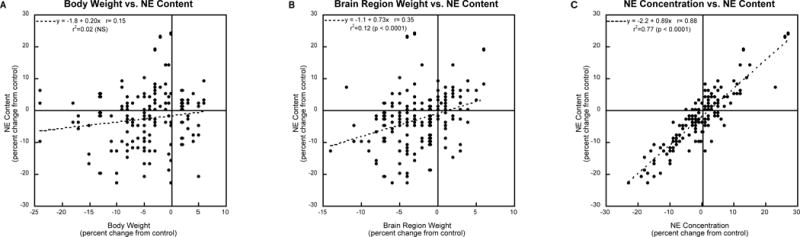
Glucocorticoids are given in preterm labor to prevent respiratory distress but these agents evoke neurobehavioral deficits in association with reduced brain region volumes. To determine whether the neurodevelopmental effects are distinct from growth impairment, we gave developing rats dexamethasone at doses below or within the therapeutic range (0.05, 0.2 or 0.8 mg/kg) at different stages: gestational days (GD) 17-19, postnatal days (PN) 1-3 or PN7-9. In adolescence and adulthood, we assessed the impact on noradrenergic systems in multiple brain regions, comparing the effects to those on somatic growth or on brain region growth. Somatic growth was reduced with exposure in all three stages, with greater sensitivity for the postnatal regimens; brain region growth was impaired to a lesser extent. Norepinephrine content and concentration were reduced depending on the treatment regimen, with a rank order of deficits of PN7-9 > PN1-3 > GD17-19. However, brain growth impairment did not parallel reduced norepinephrine content in magnitude, dose threshold, sex or regional selectivity, or temporal pattern, and even when corrected for reduced brain region weights (norepinephrine per g tissue), the dexamethasone-exposed animals showed subnormal values. Regression analysis showed that somatic growth impairment accounted for an insubstantial amount of the reduction in norepinephrine content, and brain growth impairment accounted for only 12%, whereas specific effects on norepinephrine accounted for most of the effect. The adverse effects of dexamethasone on noradrenergic system development are not simply related to impaired somatic or brain region growth, but rather include specific targeting of neurodifferentiation.

Keywords: Dexamethasone; Growth impairment; Norepinephrine; Preterm labor.


Conflict of interest statement

Conflict of interest statement: TAS has received consultant income in the past three years from Pardieck Law (Seymour, IN) and Walgreen Co. (Deerfield, IL).

Figures

Figure 1
Figure 1
Effects of gestational or postnatal dexamethasone treatment on body weights in the offspring. Data represent mean ± SE of 6 animals at each age for each treatment group and each sex. Global ANOVA across all three regimens indicates a main effect of treatment (F3,354=39, p < 0.0001) and interactions of treatment × regimen (F6,354=2.6, p < 0.02) and treatment × age (F6,354=2.3, p < 0.04). Accordingly, data were separated into the three regimens and each regimen was examined for the main treatment effect and interaction of treatment × age: (A) GD17-19, (B) PN1-3, (C) PN7-9. ANOVA across all doses appears at the top of each panel, with subdivision by dose shown within the panel. Where there was a treatment × age interaction (B), effects at specific ages are also indicated.
Figure 2
Figure 2
Effects of gestational or postnatal dexamethasone treatment on brain region weights in the offspring. Data represent mean ± SE of 6 animals at each age for each treatment group and each sex. Global ANOVA across all three regimens indicates a main effect of treatment (F3,1064=22, p < 0.0001) and interactions of treatment × regimen (F6,1064=8.1, p < 0.0001), treatment × age (F6,1064=2.4, p < 0.03), treatment × age × sex (F6,1064=2.8, p < 0.01) and treatment × regimen × age × sex (F12,1064=3.4, p < 0.0001). Accordingly, data were separated into the three regimens and each regimen was examined for the main treatment effect and interactions of treatment with the other factors: (A) GD17-19, (B) PN1-3, (C) PN7-9. ANOVA across all doses appears at the top of each panel, with subdivision by dose shown within the panel. Where there was a significant of treatment with other factors (B,C), lower order tests were performed as indicated, to identify effects at individual ages or separately for males and females. Abbreviations: cx = cerebral cortex, mb = midbrain, bs = brainstem.
Figure 3
Figure 3
Average main treatment effects on body weight (A, B, C) collapsed across age, and brain region weights (D, E, F), collapsed across age and region, for the three different regimens: (A, D) GD17-19, (B, E) PN1-3, (C, F) PN7-9.
Figure 4
Figure 4
Effects of gestational or postnatal dexamethasone treatment on norepinephrine content in the offspring. Data represent mean ± SE of 6 animals at each age for each treatment group and each sex. Global ANOVA across all three regimens indicates a main effect of treatment (F3,1059=8.1, p < 0.0001) and interactions of treatment × regimen (F6,1059=5.6, p < 0.0001) and of treatment × regimen × sex (F6,1059=2.2, p < 0.05). Accordingly, data were separated into the three regimens and each regimen was examined for the main treatment effect and the treatment × sex interaction: (A) GD17-19, (B) PN1-3, (C) PN7-9. ANOVA across all doses appears at the top of each panel, with subdivision by dose shown within the panel. Where there was a significant treatment × sex interaction (C), lower order tests were performed as indicated, to identify separate effects for males and females. Abbreviations: NS = not significant, cx = cerebral cortex, mb = midbrain, bs = brainstem.
Figure 5
Figure 5
Effects of gestational or postnatal dexamethasone treatment on norepinephrine concentration in the offspring. Data represent mean ± SE of 6 animals at each age for each treatment group and each sex. Global ANOVA across all three regimens indicates interactions of treatment × regimen (F6,1059=2.2, p < 0.04), treatment × regimen × sex (F6,1059=2.3, p < 0.04), treatment × regimen × age × sex (F12,1059=2.2, p < 0.01), and treatment × regimen × age × sex × region (F24,1059=1.6, p < 0.05). Accordingly, data were separated into the three regimens and each regimen was examined for the main treatment effect and interactions of treatment with the other factors: (A) GD17-19, (B) PN1-3, (C) PN7-9. ANOVA across all doses appears at the top of each panel, with subdivision by dose shown within the panel. Where there was a significant of treatment with other factors (B,C), lower order tests were performed as indicated, to identify effects at individual ages or separately for males and females. Abbreviations: NS = not significant, cx = cerebral cortex, mb = midbrain, bs = brainstem.
Figure 6
Figure 6
Average main treatment effects on norepinephrine content (A, B, C) and norepinephrine concentration (D, E, F), collapsed across age and region, for the three different regimens: (A, D) GD17-19, (B, E) PN1-3, (C, F) PN7-9. Abbreviations: NE = norepinephrine, Dex = dexamethasone.
Figure 7
Figure 7
Average main treatment effects for subdivisions indicated by interactions shown in Figure 5. (A) Regional differences in treatment effects for the PN1-3 regimen, collapsed across sex and age; (B) Age differences in treatment effects for the PN7-9 regimen in males, collapsed across region. Abbreviations: NE = norepinephrine, Dex = dexamethasone.
Figure 8
Figure 8
Effects of postnatal dexamethasone treatment on cerebellum, assessed at PN75: (A) brain region weight, (B) norepinephrine content, (C) norepinephrine concentration. Data represent mean ± SE of 6 animals at each age for each treatment group and each sex. Global ANOVA across both regimens appears at the top of each panel; where there was a treatment × regimen interaction (A), lower order tests for each regimen appears within the panel. Control values were: weight, male 311 ± 5 mg, female 288 ± 5; norepinephrine content, male 68 ± 4 ng, female 66 ± 3; norepinephrine concentration, male 217 ± 10 ng/g, female 231 ± 12. Abbreviations: NS = not significant, Dex = dexamethasone.
Figure 9
Figure 9
Linear regression analysis showing the relationship between dexamethasone effects on norepinephrine content and the effects on (A) body weight, (B) brain region weight, and (C) norepinephrine concentration. Values were included for all regimens, regions and ages, and for both sexes. The equation for the linear fit is shown within each panel, along with the correlation coefficient (r), attributability (r2) and p-value. The correlation coefficient in C is significantly higher than those in A or B (p < 0.0001). Abbreviation: NE = norepinephrine.

Similar articles

Cited by

References

    1. Cavalieri RL, Cohen WR. Antenatal steroid therapy: have we undervalued the risks? J Matern Fetal Neonat Med. 2006;19:265–269. - PubMed
    1. Cheong JLY, Burnett AC, Lee KJ, Roberts G, Thompson DK, Wood SJ, Connelly A, Anderson PJ, Doyle LW, Victorian Infant Collaborative Study Group Association between postnatal dexamethasone for treatment of bronchopulmonary dysplasia and brain volumes at adolescence in infants born very preterm. J Pediatr. 2014;164:737–743. - PMC - PubMed
    1. Ciaranello RD, Jacobowitz D, Axelrod J. Effect of dexamethasone on phenylethanolamine N-methyltransferase in chromaffin tissue of the neonatal rat. J Neurochem. 1973;20:799–805. - PubMed
    1. Crowther CA, Doyle LW, Haslam RR, Hiller JE, Harding JE, Robinson J, Actords Study Group Outcomes at 2 years of age after repeat doses of antenatal corticosteroids. New Eng J Med. 2007;357:1179–1189. - PubMed
    1. Dammann O, Matthews SG. Repeated antenatal glucocorticoid exposure and the developing brain. Pediatr Res. 2001;50:563–564. - PubMed

Publication types