. 2018 Aug:521:138-148.
doi: 10.1016/j.virol.2018.06.004. Epub 2018 Jun 20.

Using barcoded Zika virus to assess virus population structure in vitro and in Aedes aegypti mosquitoes

Affiliations

Using barcoded Zika virus to assess virus population structure in vitro and in Aedes aegypti mosquitoes

James Weger-Lucarelli et al. Virology. 2018 Aug.

Abstract

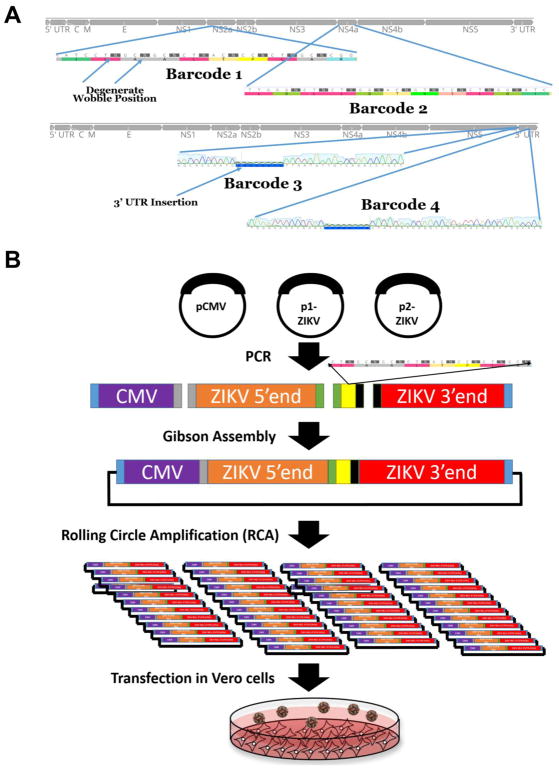
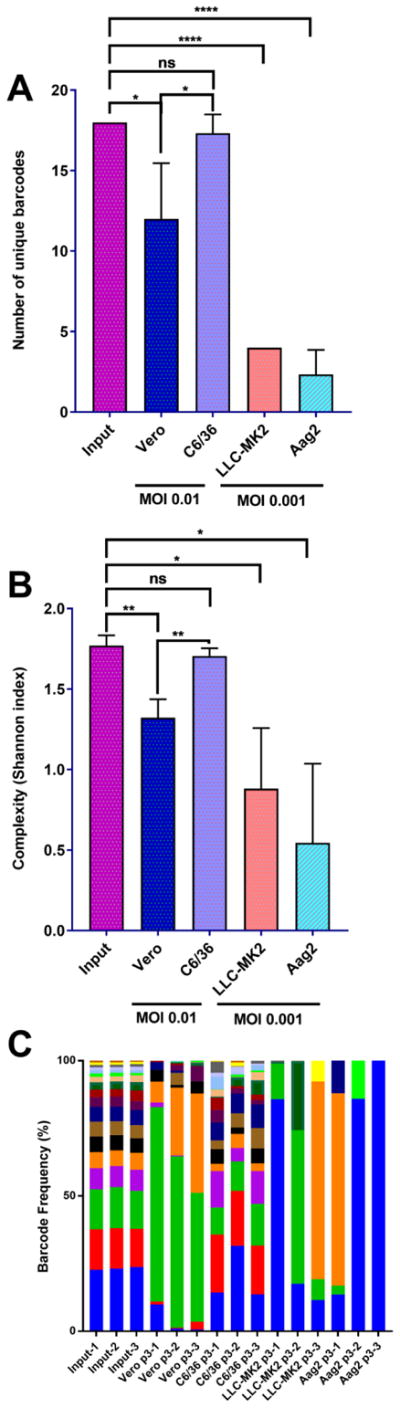
Arboviruses such as Zika virus (ZIKV, Flaviviridae; Flavivirus) must replicate in both mammalian and insect hosts possessing strong immune defenses. Accordingly, transmission between and replication within hosts involves genetic bottlenecks, during which viral population size and genetic diversity may be significantly reduced. To help quantify these bottlenecks and their effects, we constructed 4 "barcoded" ZIKV populations that theoretically contain thousands of barcodes each. After identifying the most diverse barcoded virus, we passaged this virus 3 times in 2 mammalian and mosquito cell lines and characterized the population using deep sequencing of the barcoded region of the genome. C6/36 maintain higher barcode diversity, even after 3 passages, than Vero. Additionally, field-caught mosquitoes exposed to the virus to assess bottlenecks in a natural host. A progressive reduction in barcode diversity occurred throughout systemic infection of these mosquitoes. Differences in bottlenecks during systemic spread were observed between different populations of Aedes aegypti.

Keywords: Arbovirus; Flavivirus; Mosquito-borne virus; Virus evolution; Zika virus.


Figures

Figure 1
Figure 1. Insertion of genetic barcodes into the ZIKV genome
A) Insertion site of degenerate nucleotide barcodes into the genome of ZIKV. Four barcode viruses were constructed, two in the coding sequence and two in the 3′UTR. The coding changes are a consecutive series of degenerate synonymous nucleotide changes at the third codon position. B) Schematic of construction of barcode viruses using a bacteria-free cloning (BFC) approach. This approach uses Gibson assembly and rolling circle amplification in place of bacteria. Virus is then rescued by transfection in Vero cells.
Figure 2
Figure 2
ZIKV barcode viruses replicate similar to wild-type clone derived virus and have differences in barcode diversity. (A–D) The four barcode viruses have similar replication in two mammalian (Vero (A) and LLC-MK2 (B)) and two insect-derived (C6/36 (C) and Aag2 (D)) cell lines. Cells were infected at MOI 0.01. Titers were compared using a two-way ANOVA. E) The number of unique barcodes present in each barcoded virus after transfection (passage 0) or one passage at MOI 0.01 on Vero cells (n=3). Values were compared using a one-way ANOVA for each passage. F) Average genetic complexity at the barcode positions for each barcoded virus. Calculated as -i[niN·log2(niN)]. Where ni is the frequency of each nucleotide at each barcode position and N is the total number of barcode calls at that position. Values were compared using a one-way ANOVA for each passage and between passages. **** p<0.0001. G) Frequency of individual barcodes. Each color represents a unique barcode. More colors indicate increased barcode diversity.
Figure 3
Figure 3. ZIKV barcode viruses undergo cell-type specific reduction in barcode diversity
The four barcode viruses were subjected to 3 three serial passages in two mammalian (Vero and LLC-MK2) and two insect-derived (C6/36 and Aag2) cell lines. Passages were performed at MOI 0.01 for Vero and C6/36 and 0.001 for LLC-MK2 and Aag2. A) The number of unique barcodes present in each barcode virus iteration. Values were compared statistically using a one-way ANOVA with Tukey’s multiple comparisons test, * p<0.05 **** p<0.0001 ns p>0.05 B) Average genetic complexity at the barcode positions measured by Shannon’s index. Calculated as -i[niN·log2(niN)]. Where ni is the frequency of each nucleotide at each barcode position and N is the total number of barcode calls at that position. Values were compared statistically using a one-way ANOVA with Tukey’s multiple comparisons test, * p<0.05 ** p<0.01 ns p>0.05 C) Frequency of individual barcodes. Each color represents a unique barcode. More bars indicate more barcode diversity. n=3 for all treatments. The number following the group label on the x-axis refers to the biological replicate.
Figure 4
Figure 4
Stochastic forces dominate the sequential reduction in barcode diversity during replication in Aedes aegypti mosquitoes. Mosquitoes were given infectious ZIKV bloodmeals and dissected for midguts, legs, salivary glands and saliva 14 days later. A) Percent of mosquitoes with infectious virus in the saliva 14 days post-exposure. Comparison between wild-type clone derived ZIKV and barcode 1 virus. n=16–32 for each group. Statistical comparisons were made using a two-tailed Fisher’s exact test. B) Average genetic complexity at the barcode positions measured by Shannon’s index. Calculated as -i[niN·log2(niN)]. Where ni is the frequency of each nucleotide at each barcode position and N is the total number of barcode calls at that position. This was measured in the three different mosquito populations across tissue type. Statistical comparisons were made using a one-way ANOVA with Tukey’s correction for multiple comparisons. C) The number of unique barcodes present in each barcode virus iteration. Statistical comparisons were made using a one-way ANOVA with Tukey’s correction for multiple comparisons. D–F) Frequency of individual barcodes from different tissues from the three mosquito populations; Merida (D), Coatzacoalcos (E), and Poza Rica (F). Each color represents a unique barcode. The light green portion at the top of each bar represents the remaining proportion of barcodes that were not considered “authentic”. More bars indicate more barcode diversity. n=3 for all treatments.

References

    1. Zanluca C, de Melo VCA, Mosimann ALP, Santos GIVD, Santos CNDD, Luz K. First report of autochthonous transmission of Zika virus in Brazil. Mem Inst Oswaldo Cruz. 2015;110:569–572. - PMC - PubMed
    1. Duffy MR, Chen T-H, Hancock WT, Powers AM, Kool JL, Lanciotti RS, et al. Zika virus outbreak on Yap Island, Federated States of Micronesia. N Engl J Med. 2009;360:2536–2543. - PubMed
    1. Oehler E, Watrin L, Larre P, Leparc-Goffart I, Lastere S, Valour F, et al. Zika virus infection complicated by Guillain-Barre syndrome--case report, French Polynesia, December 2013. Euro Surveill. 2014:19. Available: https://www.ncbi.nlm.nih.gov/pubmed/24626205. - PubMed
    1. Schuler-Faccini L, Ribeiro EM, Feitosa IML, Horovitz DDG, Cavalcanti DP, Pessoa A, et al. Possible Association Between Zika Virus Infection and Microcephaly - Brazil, 2015. MMWR Morb Mortal Wkly Rep. 2016;65:59–62. - PubMed
    1. Foy BD, Kobylinski KC, Chilson Foy JL, Blitvich BJ, Travassos da Rosa A, Haddow AD, et al. Probable non-vector-borne transmission of Zika virus, Colorado, USA. Emerg Infect Dis. 2011;17:880–882. - PMC - PubMed