

Microbial diversity and community composition of caecal microbiota in commercial and indigenous Indian chickens determined using 16s rDNA amplicon sequencing
- PMID: 29935540
- PMCID: PMC6015460
- DOI: 10.1186/s40168-018-0501-9
Microbial diversity and community composition of caecal microbiota in commercial and indigenous Indian chickens determined using 16s rDNA amplicon sequencing
Abstract
Background: The caecal microbiota plays a key role in chicken health and performance, influencing digestion and absorption of nutrients, and contributing to defence against colonisation by invading pathogens. Measures of productivity and resistance to pathogen colonisation are directly influenced by chicken genotype, but host driven variation in microbiome structure is also likely to exert a considerable indirect influence.
Methods: Here, we define the caecal microbiome of indigenous Indian Aseel and Kadaknath chicken breeds and compare them with the global commercial broiler Cobb400 and Ross 308 lines using 16S rDNA V3-V4 hypervariable amplicon sequencing.
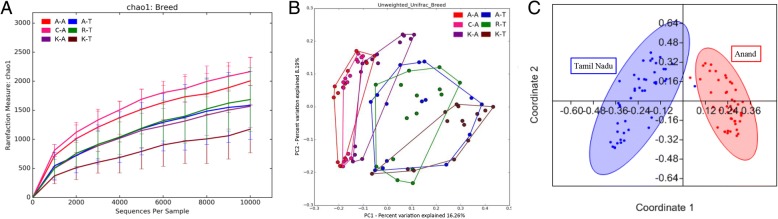
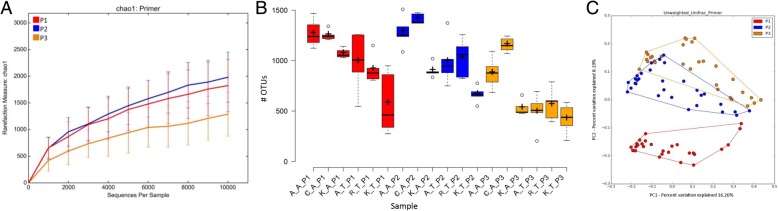
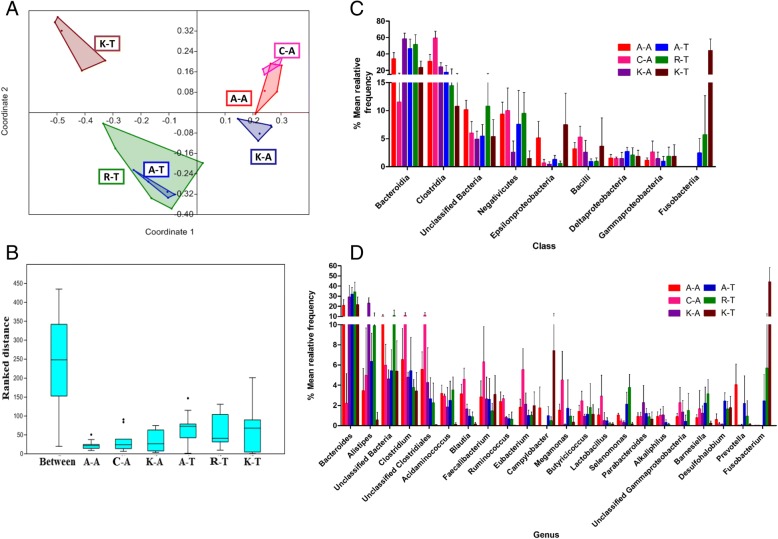
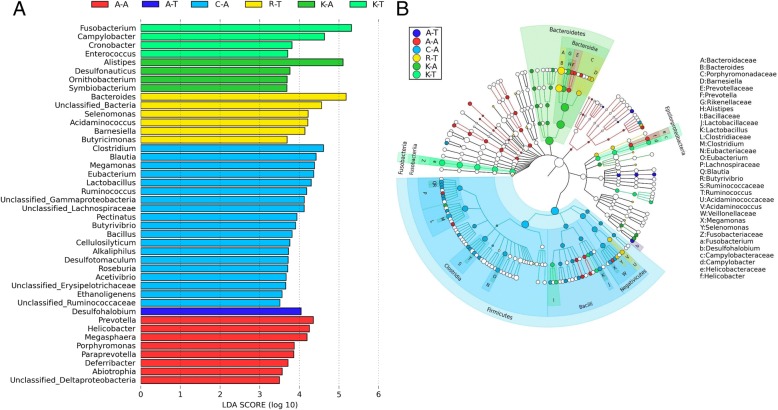
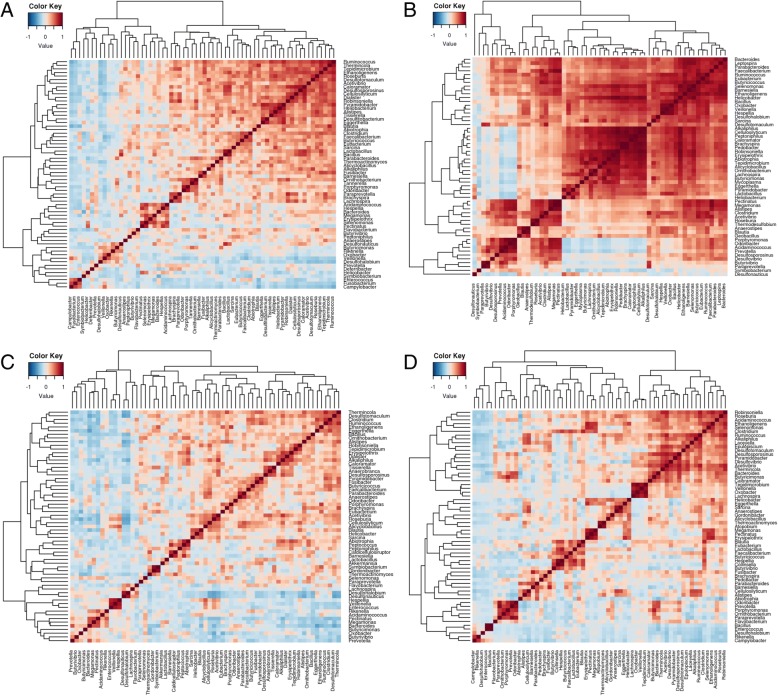
Results: Each caecal microbiome was dominated by the genera Bacteroides, unclassified bacteria, unclassified Clostridiales, Clostridium, Alistipes, Faecalibacterium, Eubacterium and Blautia. Geographic location (a measure recognised to include variation in environmental and climatic factors, but also likely to feature varied management practices) and chicken line/breed were both found to exert significant impacts (p < 0.05) on caecal microbiome composition. Linear discriminant analysis effect size (LEfSe) revealed 42 breed-specific biomarkers in the chicken lines reared under controlled conditions at two different locations.
Conclusion: Chicken breed-specific variation in bacterial occurrence, correlation between genera and clustering of operational taxonomic units indicate scope for quantitative genetic analysis and the possibility of selective breeding of chickens for defined enteric microbiota.
Keywords: 16S rRNA gene; Amplicon sequencing; Chickens; Microbiome; Pathogens.
Conflict of interest statement
Ethics approval
This study was carried out using welfare standards consistent with those established under the Animals (Scientific Procedures) Act 1986, an Act of Parliament of the United Kingdom. All protocols were approved by the Ethical Review Panel of Anand Agricultural University (AAU), the Institutional Animal Ethical Committee of the Madras Veterinary College and the Clinical Research Ethical Review Board (CRERB) of the Royal Veterinary College.
Consent for publication
Not applicable.
Competing interests
The authors declare that they have no competing interests.
Publisher’s Note
Springer Nature remains neutral with regard to jurisdictional claims in published maps and institutional affiliations.
Figures
References
-
- Dixon J, Braun H-J, Kosina P, Crouch JH. Wheat facts and futures 2009. Mexico: Cimmyt; 2009.
-
- Grace D, Mutua F, Ochungo P, Kruska R, Jones K, Brierley L, Lapar M, Said M, Herrero M, Phuc P. Mapping of poverty and likely zoonoses hotspots. 2012.
-
- Grace D, Mutua F, Ochungo P, Kruska R, Jones K, Brierley L, Lapar L, Said M, Herrero M, Phuc P. Mapping of poverty and likely zoonoses hotspots. Zoonoses Project 4. Report to the UK Department for International Development. Nairobi: International Livestock Research Institute; 2012.
Publication types
MeSH terms
Substances
Grants and funding
LinkOut - more resources
Full Text Sources
Other Literature Sources
