. 2018 Jul 25;7(1):28-40.e4.
doi: 10.1016/j.cels.2018.05.010. Epub 2018 Jun 20.

High-Throughput Functional Analysis Distinguishes Pathogenic, Nonpathogenic, and Compensatory Transcriptional Changes in Neurodegeneration

Affiliations

High-Throughput Functional Analysis Distinguishes Pathogenic, Nonpathogenic, and Compensatory Transcriptional Changes in Neurodegeneration

Ismael Al-Ramahi et al. Cell Syst. .

Abstract

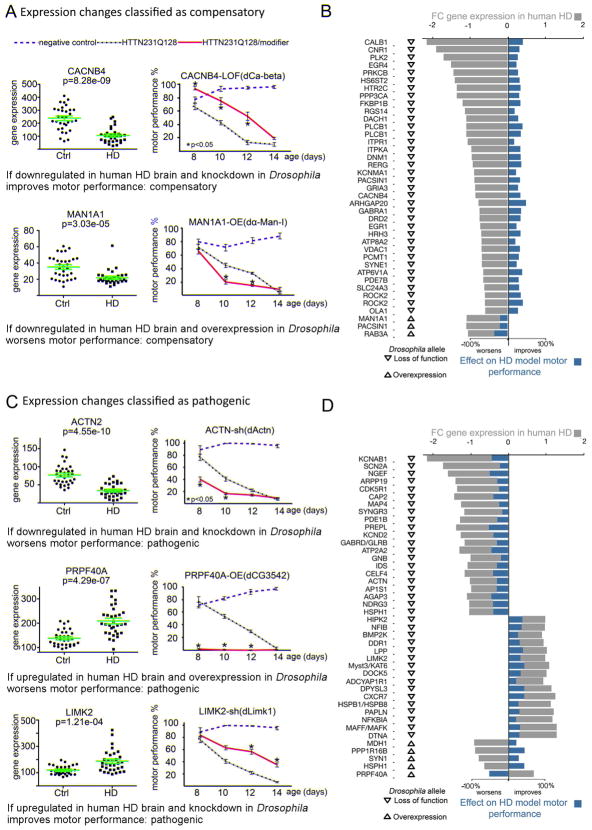
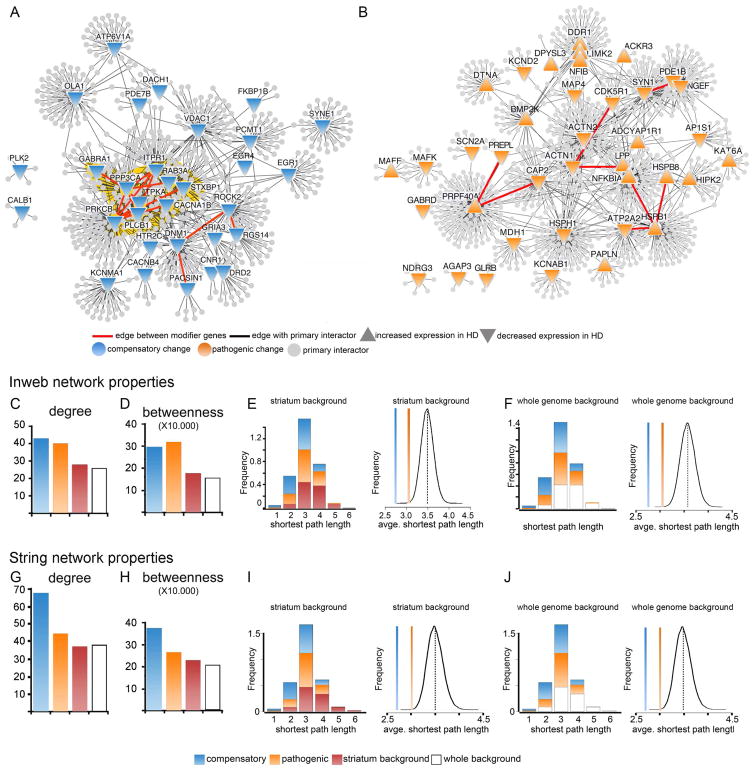
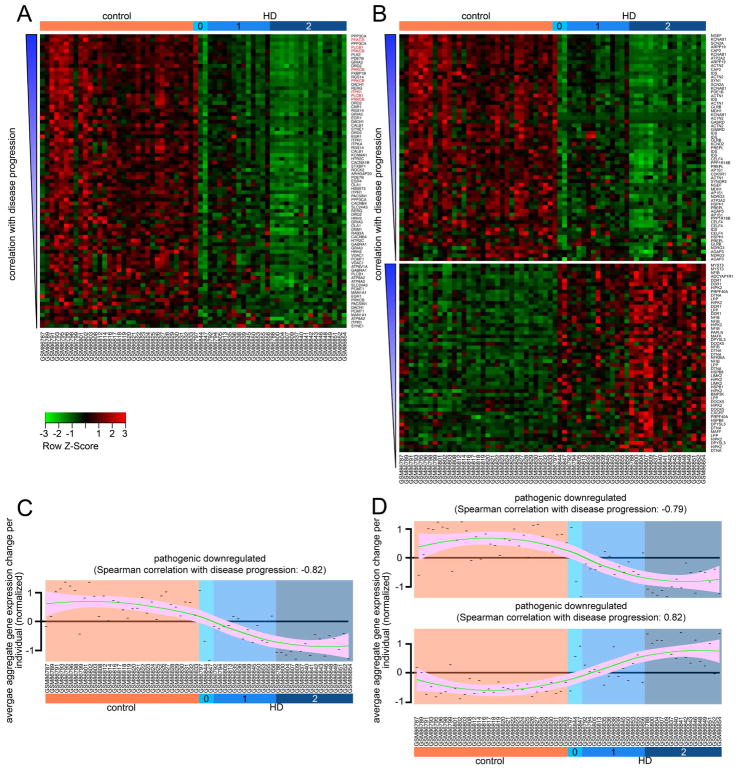
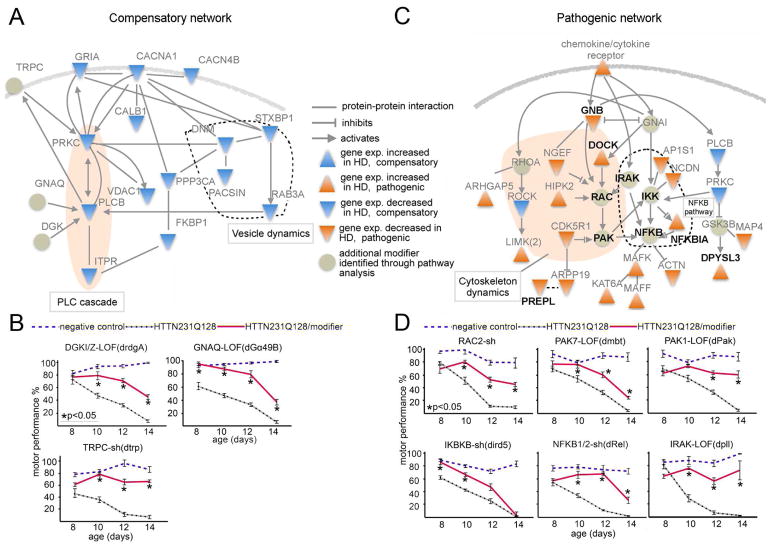
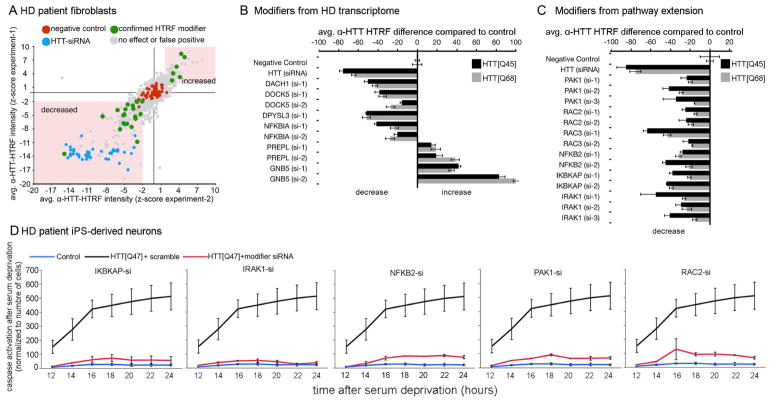
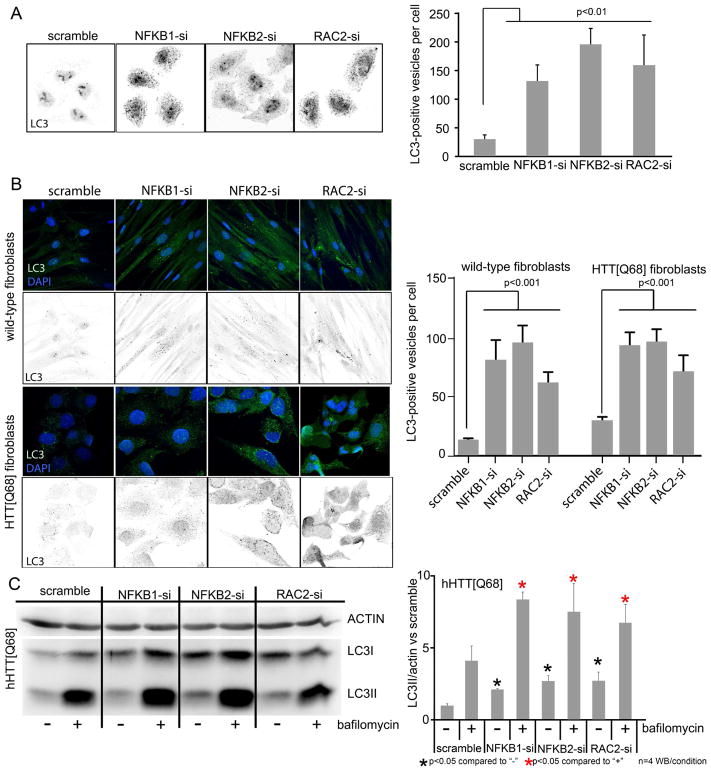
Discriminating transcriptional changes that drive disease pathogenesis from nonpathogenic and compensatory responses is a daunting challenge. This is particularly true for neurodegenerative diseases, which affect the expression of thousands of genes in different brain regions at different disease stages. Here we integrate functional testing and network approaches to analyze previously reported transcriptional alterations in the brains of Huntington disease (HD) patients. We selected 312 genes whose expression is dysregulated both in HD patients and in HD mice and then replicated and/or antagonized each alteration in a Drosophila HD model. High-throughput behavioral testing in this model and controls revealed that transcriptional changes in synaptic biology and calcium signaling are compensatory, whereas alterations involving the actin cytoskeleton and inflammation drive disease. Knockdown of disease-driving genes in HD patient-derived cells lowered mutant Huntingtin levels and activated macroautophagy, suggesting a mechanism for mitigating pathogenesis. Our multilayered approach can thus untangle the wealth of information generated by transcriptomics and identify early therapeutic intervention points.

Keywords: Huntington disease; NFKB; RAC2; actin cytoskeleton; autophagy; calcium signaling; compensatory changes; inflammation; synaptic biology; transcriptome.


Conflict of interest statement

Declaration of Interests

The authors declare no competing financial interests.

Figures

Figure 1
Figure 1. Functional analysis of HD transcriptomic alterations
(A) Representative transcriptomic alterations categorized as likely compensatory (the rest of the compensatory genes are shown in Figure S1). Scatter plots on the left show expression levels of the indicated human gene in the caudate nucleus of HD patients with Vonsattel grades 0–2 (reanalyzed after (Hodges et al., 2006) and controls, and the charts on the right show motor performance as a function of age in Drosophila negative controls (blue dashed lines, elavC155>GAL4/w1118), positive controls expressing HTTN231Q128 in neurons (black dotted line, elavC155>GAL4/w1118; UAS-HTTN231Q128/+) and experimental animals (red line, elavC155>GAL4/w1118; UAS-HTTN231Q128/+; modifier/+). CACNB4 is downregulated in HD human brains and neuron-specific knockdown (LOF) of its Drosophila homolog improves the performance of the HD fly model on the climbing assay, so it is classified as compensatory. MAN1A1 is downregulated in HD human brains and neuron-specific overexpression (OE) of its Drosophila homolog worsens HTTN231Q128-induced motor deficits, so it is also classified as compensatory. (B) Bar graph summarizing the integration of the human transcriptomic data (grey bars), Drosophila allele class (arrowhead pointing down denotes reduced function and arrowhead pointing up denotes increased function), and the average % effect of the mHTT-induced motor deficits in Drosophila (blue bars) for the all gene expression changes classified as compensatory. (C) Representative transcriptomic changes we categorized as likely pathogenic (the rest of the pathogenic genes are shown in Figure S2). Neuron-specific knockdown (shRNA) of the Drosophila homolog for ACTN, which is downregulated in human HD brains, worsens the motor deficit. PRPF40A is upregulated in HD human brains, and neuron-specific overexpression (OE) of its Drosophila homolog markedly worsens motor performance. LIMK2 is upregulated in HD human brains and neuron-specific downregulation of its Drosophila homologue improves motor performance in HD flies. (D) Bar graph parallels that in B, except that it is for gene expression changes classified as pathogenic. Green error bars in gene expression scatter plots: average and standard deviation. Error bars in motor performance charts: s.e.m. Significant differences identified using Anova followed by Tukey’s post hoc test for each time point (α=0.05).
Figure 2
Figure 2. Network analysis of the compensatory and pathogenic subnetworks
(A and B) Subnetworks of the potentially compensatory (A) and pathogenic (B) genes from the HD transcriptome showing their primary interactors. (C) Average node degree (number of edges per node) among the compensatory and pathogenic genes compared to the striatum (Wilcoxon rank sum test, p=5.41e-4 and 6.85e-3, respectively) and whole genome (p=1.38e-4 and 1.81e-3, respectively) backgrounds indicates that the compensatory and pathogenic modifiers are more tightly connected than randomly expected. This is also supported in (D) by the average betweenness (number of shortest paths crossing each node) of compensatory and pathogenic genes compared to striatum (p= 7.58e-5 and 3.33e-4, respectively) or whole genome (p= 1.79e-5 and 7.26e-5, respectively). (E-F) Network properties also show a higher connectivity among the genes in the compensatory and pathogenic subnetworks than would be randomly expected. (E) Shortest path length distribution among the compensatory and pathogenic genes compared to the striatum background and average shortest path length within the compensatory and pathogenic subnetworks compared to the striatal background (p=0 and 9.6e-4 respectively). P calculated by performing a background probability distribution (black line) corresponding to the 1.0e5 randomized samplings we ran using the striatal background genes. (F) Same as E but compared to the whole genome background (p= 0 and 1.3e-4 respectively). P calculated by performing a background probability distribution (black line) corresponding to the 1.0e5 randomized samplings we ran using the striatal background genes from the Inweb network. (G–J) Network properties of compensatory and pathogenic genes using the STRING network. Compensatory changes show the same behavior as with Inweb. Betweenness centrality is significantly increased (Wilcoxon rank sum p= 2.19e-6 for striatum and p= 4.72e-6 for whole genome). Node degree is significantly increased compared to striatum (Wilcoxon rank sum p= 6.42e-6) and whole genome (p= 3.37e-6) and average shortest path is significantly decreased (p=0). For the pathogenic subnetwork the average shortest path is significantly decreased (p=2.6e-4 striatum and 3e-5 whole genome). The betweenness centrality and degree indicators also show a trend to increase, but the Wilcoxon rank sum test does not return statistical significance.
Figure 3
Figure 3. Reanalysis of human microarray data for compensatory and pathogenic changes and disease correlation analysis
(A) Heat map of the gene expression changes in the compensatory network. Gene probes in each panel are organized by increasing degree of correlation with disease stage from bottom to top. Disease stage is indicated at the top, donor identifier at the bottom, and the gene symbol targeted by each probe on the right side. Genes in red font belong to the PLC cascade (PRKCB, PLCB1 and ITPR1). (B) Heat map of the GEP changes in the pathogenic network. Data arranged as in (A). (C and D) Trend lines representing the correlation between aggregate gene expression changes (per individual) with HD stages for each of the panels shown in A and B respectively. Note the tendency of the transcriptomic changes to become more pronounced in each group as the HD grade becomes more severe. Green line represents loess regression and pink shade indicates confidence interval. Each point is the average transcriptomic change for all the probes (in each group, indicated in the title) corresponding to a specific donor (indicated in the x axis). Chart in C corresponds to panel in A, and the same correspondence exists between charts in D and panels B. A–D (reanalyzed after (Hodges et al., 2006)). Correlation of gene expression changes with disease progression was calculated using Spearman’s correlation.
Figure 4
Figure 4. Compensatory and pathogenic networks
(A) Functional interaction network of potentially compensatory genes (blue triangles) and modifiers identified through pathway extension (faded green circles) generated using Ingenuity Pathway Analysis. (B) Motor assays of the GPCR cascade genes identified by pathway extension show that when knocked down, they too relieve motor impairments caused by HTTN231Q128-induced neuronal dysfunction. (C) Functional interaction network of 19 genes (orange triangles) in the pathogenic network together with additional modifiers identified through pathway extension (faded green circles). Interactions generated using Ingenuity Pathway Analysis. A more detailed interaction map is shown in (Figure S5F). All genes in bold font also modulate mHTT protein levels in fibroblasts from HD patients (Figure 5). (D) Effect on mHTT-induced motor deficits of additional modifiers identified by pathway extension of genes categorized as pathogenic. In B and D, charts show motor performance as a function of age in Drosophila negative controls (blue dashed lines, elavC155>GAL4/w1118), positive controls expressing HTTN231Q128 in the nervous system (black dotted line, elavC155>GAL4/w1118; UAS-HTTN231Q128/+) and experimental animals (red line, elavC155>GAL4/w1118; UAS-HTTN231Q128/+; modifier/+). For B and D sh: shRNA; LOF: loss of function. Error bars in motor performance charts: s.e.m. Significant differences identified using Anova followed by Tukey’s post hoc test for each time point (α=0.05). Table S5 lists the specific modifier alleles identified through pathway expansion.
Figure 5
Figure 5. Knockdown of genes involved in inflammation/ regulation of actin cytoskeleton decreases mHTT protein levels in HD fibroblasts; pathway validation in HD iPS-derived neurons
(A–B) Analysis of mHTT protein levels in fibroblasts from HD patients. Fibroblasts were transfected with siRNAs targeting the human homologs of the Drosophila genetic modifiers identified among genes altered in the HD transcriptome. (A) Scatter plot summarizing the HTRF screen in HTT[Q68] fibroblasts for genes modulating mHTT protein levels. All 82 human genes whose Drosophila homologs modified motor impairments caused by HTTN231Q128-induced neuronal dysfunction were targeted using 8 siR-NAs per gene. Screen was done in duplicate (experiment-1 and -2). (B) Effect of the hit genes on mHTT levels in HTT[Q68] and HTT[Q45] patient fibroblast lines normalized to negative control. Error bars: standard deviations. (C) Analysis of mHTT protein levels in HD fibroblasts transfected with siRNAs targeting the additional genetic modifiers identified by pathway extension analysis. Data is shown for both HTT[Q68] and HTT[Q45] fibroblast lines. (D) Charts showing average caspase-3 activation following BDNF deprivation as a function of time. Black line: iPS-derived neuron like cells from a HTT[Q47] patient. Red line: HTT[Q47]-derived neurons transfected with siRNAs targeting the indicated gene. Blue line: control iPS-derived neuron like cells. The donor was the sibling of the patient that donated the HTT[Q47] cells. Error bars indicate standard deviation. All the differences shown in B and C where significantly different compared to the corresponding negative controls (using Anova followed by Student’s t test, α=0.05).
Figure 6
Figure 6. Knockdown of NFKB2 and RAC2 results in activation of autophagy
(A) Immunofluorescence (IF) staining showing LC3-positive vesicles and quantification in HeLa cells with decreased levels of NFKB1/2 and RAC2. (B) IF staining and quantification in control (WT) and HD patient (HTT[Q68]) fibroblasts showing the number of LC3-positive vesicles. (C) Western blot (WB) analysis and quantification showing increased levels of the autophagic vesicle bound LC3II in HD patient (HTT[Q68]) fibroblasts with decreased levels of NFKB1/2 and RAC2 in normal conditions (“-” in WB and charts). Also shown is the effect of bafilomycin treatment (“+” in WB and charts). Significant differences were identified using Anova followed by Student’s t test (α=0.05).

References

    1. Ament SA, Pearl JR, Grindeland A, St Claire J, Earls JC, Kovalenko M, Gillis T, Mysore J, Gusella JF, Lee JM, et al. High resolution time-course mapping of early transcriptom-ic, molecular and cellular phenotypes in Huntington’s disease CAG knock-in mice across multiple genetic backgrounds. Hum Mol Genet. 2017;26:913–922. - PMC - PubMed
    1. Andre R, Carty L, Tabrizi SJ. Disruption of immune cell function by mutant huntingtin in Huntington’s disease pathogenesis. Curr Opin Pharmacol. 2016;26:33–38. - PubMed
    1. Bando SY, Silva FN, da Costa LF, Silva AV, Pimentel-Silva LR, Castro LH, Wen HT, Ama-ro E, Jr, Moreira-Filho CA. Complex network analysis of CA3 transcriptome reveals pathogenic and compensatory pathways in refractory temporal lobe epilepsy. PLoS One. 2014;8:e79913. - PMC - PubMed
    1. Bjorkqvist M, Wild EJ, Thiele J, Silvestroni A, Andre R, Lahiri N, Raibon E, Lee RV, Benn CL, Soulet D, et al. A novel pathogenic pathway of immune activation detectable before clinical onset in Huntington’s disease. J Exp Med. 2008;205:1869–1877. - PMC - PubMed
    1. Branco J, Al-Ramahi I, Ukani L, Perez AM, Fernandez-Funez P, Rincon-Limas D, Botas J. Comparative analysis of genetic modifiers in Drosophila points to common and distinct mechanisms of pathogenesis among polyglutamine diseases. Hum Mol Genet. 2008;17:376–390. - PubMed

Publication types

Substances