. 2018 Sep;20(5):565-571.
doi: 10.1016/j.jmoldx.2018.04.003. Epub 2018 Jun 22.

Pre-Analytical Handling Conditions and Small RNA Recovery from Urine for miRNA Profiling

Affiliations

Pre-Analytical Handling Conditions and Small RNA Recovery from Urine for miRNA Profiling

David A Armstrong et al. J Mol Diagn. 2018 Sep.

Abstract

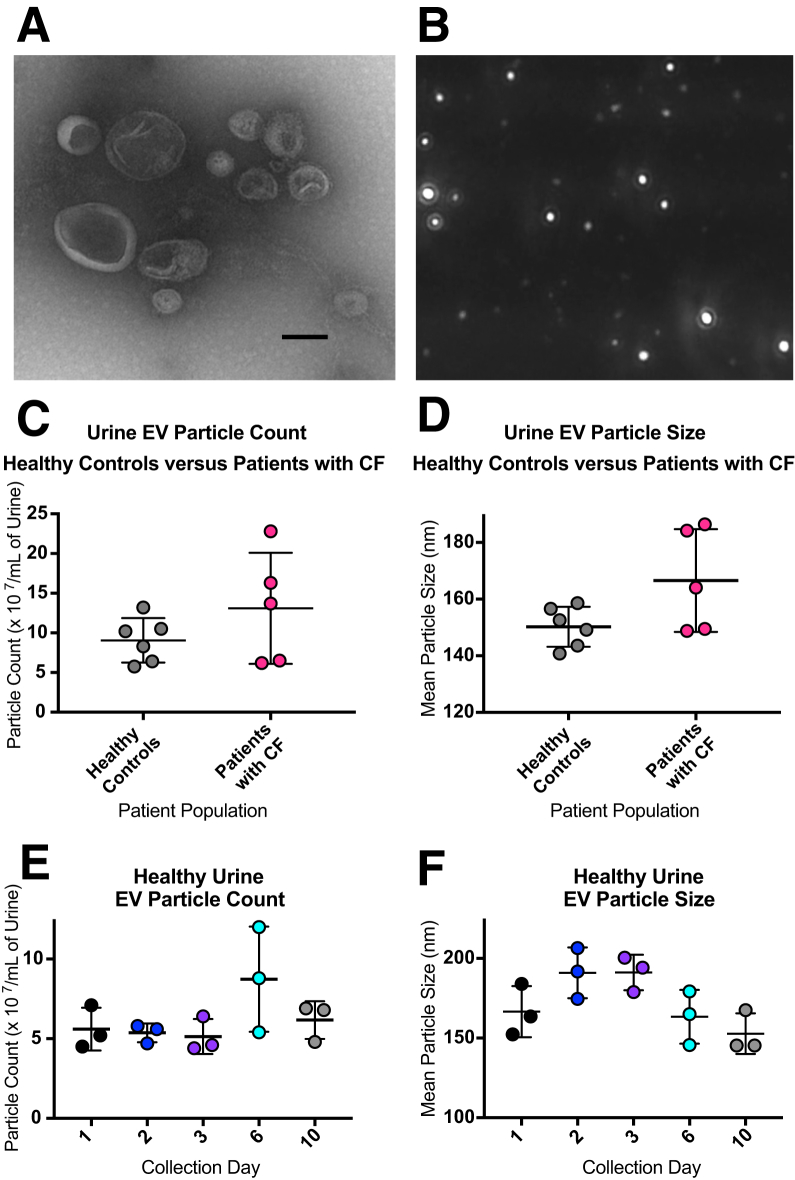
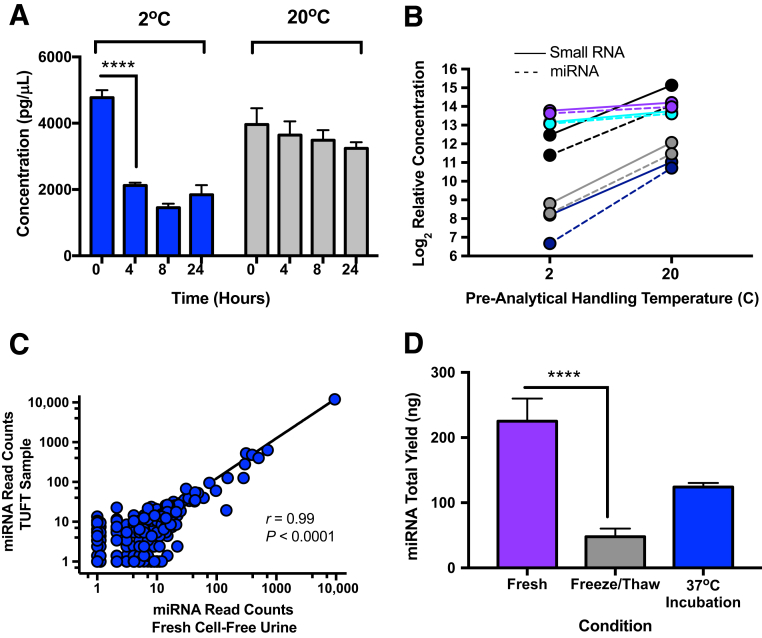
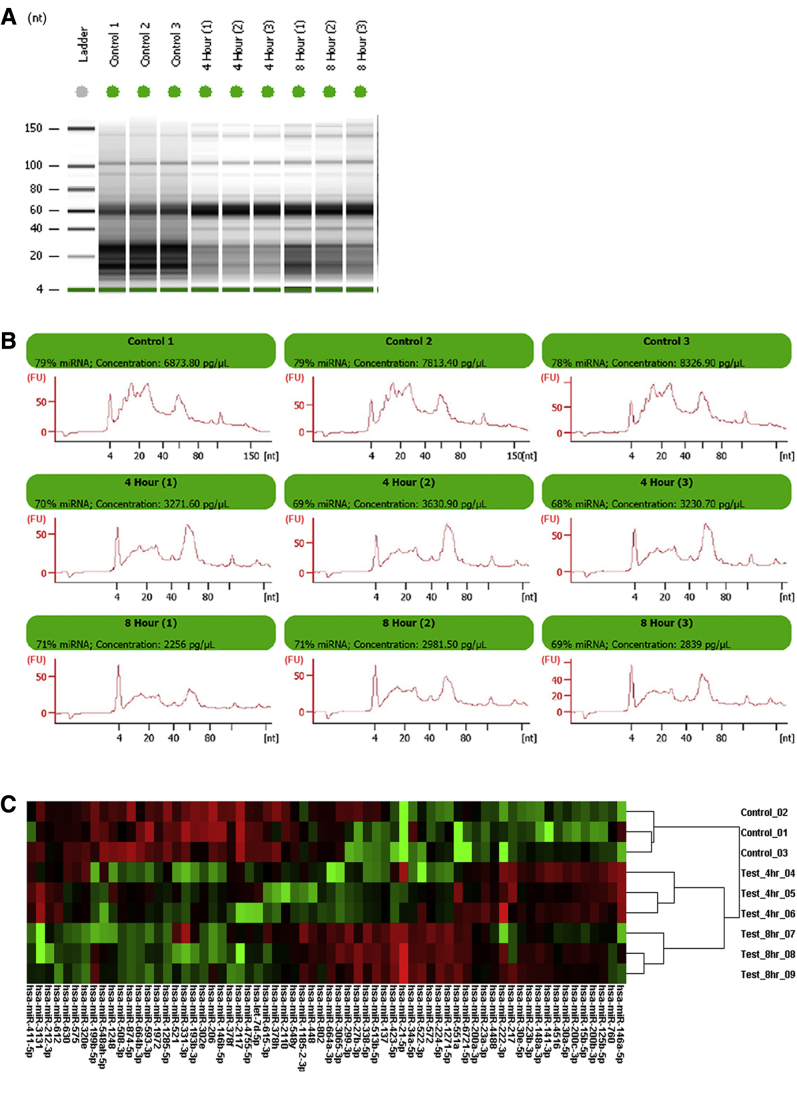
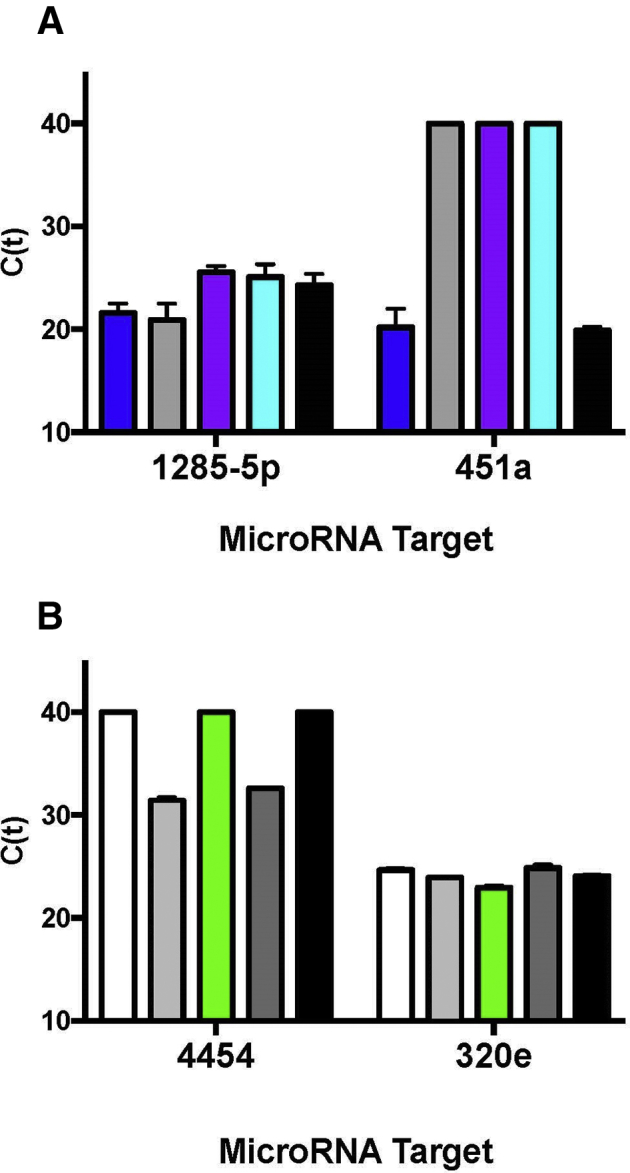
There are currently no standardized protocols for pre-analytical handling of urine to best preserve small RNA for miRNA profiling studies. miRNA is an attractive candidate as a potential biomarker because of the high level of stability in body fluids and its ability to be quantified on multiple high-throughput platforms. We present a comparison of small RNA recovery and stability in urine under alternate pre-analytical handling conditions and extend recommendations on what conditions optimize yield of miRNA from cell-free urine and urine extracellular vesicles (EVs). Using an affinity slurry for isolation of small RNA from urine, we found that urine samples held at room temperature (20°C) for up to 8 hours before processing yield the highest amounts of intact small RNAs from EVs. Some miRNA is lost from urine samples when held 2°C to 4°C and/or frozen before EV isolation, likely because of EV entrapment in uromodulin precipitates. However, we found that a simple 5-minute incubation of urine containing cold-induced precipitate at 37°C resolubilizes much of this precipitate and results in an increased recovery of EVs and miRNAs. Finally, small RNA integrity can be compromised when whole urine is held at 37°C for as little as 4 hours and is not conducive to efficient miRNA profiling.


Figures

Figure 1
Figure 1
Visualization, particle counting, and particle sizing of urine extracellular vesicles (EVs). EVs were isolated from cell-free urine via Norgen affinity slurry B1 (Materials and Methods).A and B: Particles were imaged using both negative staining transmission electron microscopy (A) and nanoparticle tracking analysis (NTA) (B). NTA was also used for particle counting and particle sizing. Urine EVs were isolated from healthy controls and patients with cystic fibrosis (CF). C: Particle counts ranged from 50 million to 230 million/mL of cell-free urine (P = 0.224). D: Mean particle size range was 140 to 185 nmol/L (P = 0.071). E and F: In addition, urine EVs were collected from one donor during a period of 10 days to examine variability and storage stability for particle count (E) and particle sizing (F). Data are expressed as means ± SEM (C–F). n = 6 healthy controls; n = 5 patients with CF. Scale bar = 150 nm (A). Original magnification, ×5000 (B).
Figure 2
Figure 2
Different pre-analytical handling conditions result in altered miRNA recovery from urine extracellular vesicles (EVs). Whole urine was equilibrated at 2°C (on ice) or 20°C for up to 24 hours. At the conclusion of each time point, two low-speed centrifugations (200 × g and 1000 × g; 10 minutes each) were performed to eliminate cells and cell debris. miRNA concentrations were measured via the Agilent 2100 Bio-Analyzer. A: Recovery of miRNAs from urine at 2°C was markedly decreased over time compared with immediate processing. B: Equilibration of urine at 20°C resulted in greater recovery of miRNA compared with a cold (2°C) pre-analytical handling condition. Each time point was run in triplicate from healthy donors. Because of the large volume of biofluid needed for the time course (TC) study, one healthy donor sample was used for 2the °C TC and another healthy donor was used for the 20°C TC. In addition, small RNA and miRNA recovery was measured from multiple donors after sample equilibration at 2°C or 20°C for 4 hours. C: Less small RNA and miRNA is recovered from all donors when samples were held at 2°C compared with 20°C. Each of the five donors is represented by a different color, with small RNA shown as a continuous line and miRNA represented by a dashed line. RNA quantity is plotted as log2 relative concentration because of the variability of RNA yield among donors. Each line is an individual sample. Graph represents directional change across the study population. NanoString nCounter miRNA assay reveals good correlation of miRNA read counts between fresh urine sample and total urine with a one-time freeze/thaw (TUFT) from the same donor (patient with cystic fibrosis) with a normalized input quantity. D: miRNA recovery is partially rescued when precipitate is solubilized at 37°C for 5 minutes from freeze/thaw samples. Each time point was run in triplicate from one healthy donor. Graph shown is representative of multiple experiments. Data are expressed as means ± SD (A and D). n = 5 donors (B). ∗∗∗∗P < 0.0001 (Tukey-Kramer honestly significant difference).
Figure 3
Figure 3
Small RNA and miRNA stability at 37°C. To simulate possible handling conditions of infant urine diaper pad collection overnight (temperature and time), whole urine was incubated at 37°C for up to 8 hours followed by 4°C for 6 hours. A: Bio-Analyzer gel image demonstrates clear alterations in small RNA density patterns with increasing time at 37°C. B: Electropherograms showing miRNA peak (approximately 20 to 25 nucleotides) and concentrations. C: Nanostring miRNA assay heat map of most variable miRNAs across incubation times. One sample from a donor with cystic fibrosis was used in this experiment; each condition was run in triplicate.
Supplemental Figure S2
Analysis of urine extracellular vesicle (EV) miRNA by real-time quantitative PCR (qPCR). A: EVs and miRNA were isolated from two groups of individuals. miRNA was assayed by qPCR as a quality control measure of recovered RNA quality. miRNA targets hsa-miR-1285-5p and hsa-miR-451a were measured in one group of individuals. B: Each bar represents an individual. miRNA targets hsa-miR-4454 and hsa-miR-320e were assayed in another group of individuals. TaqMan advanced miRNA assays were used for qPCR. All samples were run in triplicate. Mean Ct values are shown for each participant. Data are expressed as means ± SD (A and B). n = 5 in each group.

References

    1. Properzi F., Logozzi M., Fais S. Exosomes: the future of biomarkers in medicine. Biomark Med. 2013;7:769–778. - PubMed
    1. Butz H., Nofech-Mozes R., Ding Q., Khella H.W.Z., Szabo P.M., Jewett M., Finelli A., Lee J., Ordon M., Stewart R., Krylov S., Yousef G.M. Exosomal microRNAs are diagnostic biomarkers and can mediate cell-cell communication in renal cell carcinoma. Eur Urol Focus. 2016;2:210–218. - PubMed
    1. He X., Jing Z., Cheng G. MicroRNAs: new regulators of Toll-like receptor signalling pathways. Biomed Res Int. 2014;2014:945169. - PMC - PubMed
    1. Olivieri F., Rippo M.R., Prattichizzo F., Babini L., Graciotti L., Recchioni R., Procopio A.D. Toll like receptor signaling in “inflammaging”: microRNA as new players. Immun Ageing. 2013;10:11. - PMC - PubMed
    1. Wu X.Q., Dai Y., Yang Y., Huang C., Meng X.M., Wu B.M., Li J. Emerging role of microRNAs in regulating macrophage activation and polarization in immune response and inflammation. Immunology. 2016;148:237–248. - PMC - PubMed

Publication types