. 2018 Sep;20(5):686-702.
doi: 10.1016/j.jmoldx.2018.05.004. Epub 2018 Jun 22.

Analytical Validation of a Hybrid Capture-Based Next-Generation Sequencing Clinical Assay for Genomic Profiling of Cell-Free Circulating Tumor DNA

Affiliations

Analytical Validation of a Hybrid Capture-Based Next-Generation Sequencing Clinical Assay for Genomic Profiling of Cell-Free Circulating Tumor DNA

Travis A Clark et al. J Mol Diagn. 2018 Sep.

Abstract

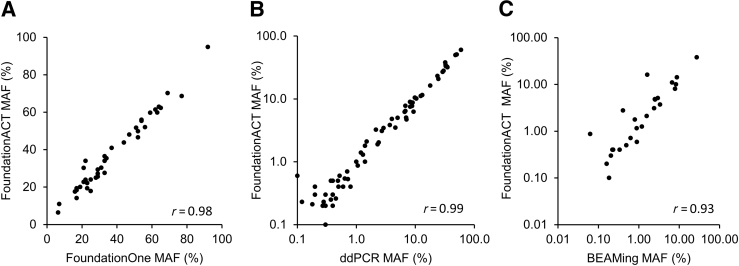
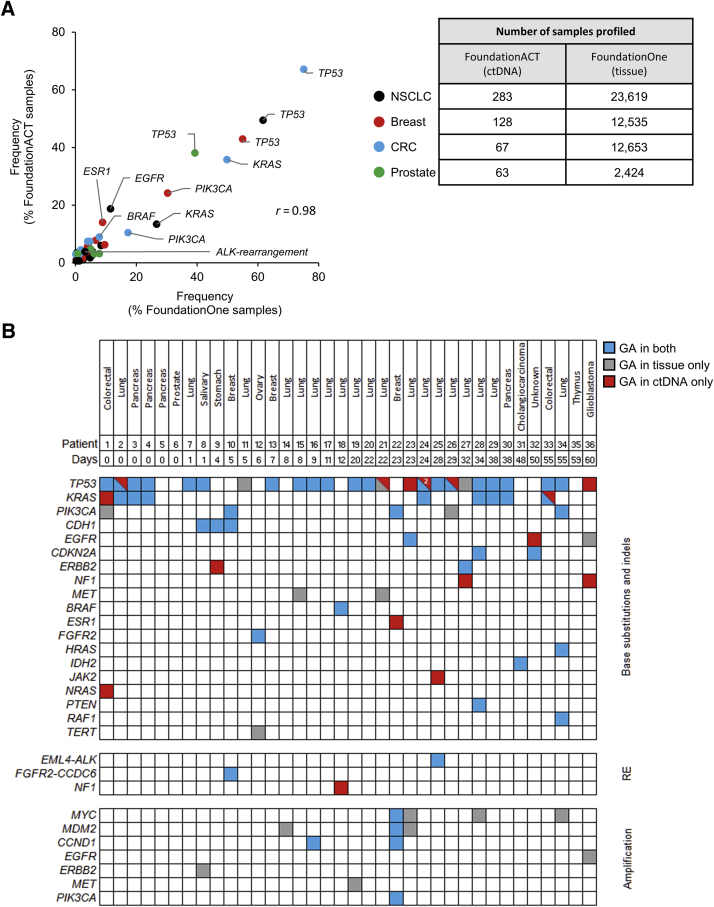
Genomic profiling of circulating tumor DNA derived from cell-free DNA (cfDNA) in blood can provide a noninvasive method for detecting genomic biomarkers to guide clinical decision making for cancer patients. We developed a hybrid capture-based next-generation sequencing assay for genomic profiling of circulating tumor DNA from blood (FoundationACT). High-sequencing coverage and molecular barcode-based error detection enabled accurate detection of genomic alterations, including short variants (base substitutions, short insertions/deletions) and genomic re-arrangements at low allele frequencies (AFs), and copy number amplifications. Analytical validation was performed on 2666 reference alterations. The assay achieved >99% overall sensitivity (95% CI, 99.1%-99.4%) for short variants at AF >0.5%, >95% sensitivity (95% CI, 94.2%-95.7%) for AF 0.25% to 0.5%, and 70% sensitivity (95% CI, 68.2%-71.5%) for AF 0.125% to 0.25%. No false positives were detected in 62 samples from healthy volunteers. Genomic alterations detected by FoundationACT demonstrated high concordance with orthogonal assays run on the same clinical cfDNA samples. In 860 routine clinical FoundationACT cases, genomic alterations were detected in cfDNA at comparable frequencies to tissue; for the subset of cases with temporally matched tissue and blood samples, 75% of genomic alterations and 83% of short variant mutations detected in tissue were also detected in cfDNA. On the basis of analytical validation results, FoundationACT has been approved for use in our Clinical Laboratory Improvement Amendments-certified/College of American Pathologists-accredited/New York State-approved laboratory.


Figures

Figure 1
Figure 1
ctDNA genomic profiling assay workflow and fragment molecular barcode–based sequencing and error detection approach. A: Peripheral whole blood (16 to 20 mL) is collected in cfDNA collection tubes, plasma is isolated, and cfDNA is extracted. B: cfDNA (20 to 100 ng) undergoes library construction, tagging with fragment barcodes, library amplification, and hybridization capture. C: Sequencing is performed using the Illumina HiSeq 4000 platform (2 × 151 bp paired-end sequencing) to generate 50 to 100 million read pairs. Fragment barcodes are used to identify multiple reads originating from the same unique input cfDNA fragment for subsequent error detection. D: Base substitutions, insertions/deletions, gene re-arrangements, and copy number amplification are called, considering detected errors. Benign germline variants are filtered (dbSNP and 1000 Genomes Project). Driver alterations are called as known and clinically annotated to highlight potential matching approved targeted therapies and clinical trials.
Figure 2
Figure 2
Analytical validation of the assay for base substitutions, insertions/deletions (indels), re-arrangements, and amplifications. A–C: Cumulative frequency of expected mutant allele frequencies (MAFs) from reference HapMap and cancer cell line samples or synthetic gene fusion constructs for base substitutions (A), indels (B), and re-arrangements (C). D–F: Observed MAFs of detected genomic alterations correlate with the expected MAFs in reference samples for base substitutions (D), indels (E), and re-arrangements (F).
Figure 3
Figure 3
Assessment of ERBB2 (HER2) amplification at lower tumor fraction. A: Example copy number amplification (CNA) data for the HCC2218 cell line (ERBB2 copy number, 9) diluted with matched normal DNA to generate samples with different tumor fractions. ERBB2 amplification detectable at 10% tumor fraction. B: Example CNA data for the HCC1954 cell line (ERBB2 copy number, 17) diluted with matched normal DNA to generate samples with different tumor fractions. ERBB2 amplification detectable at 1% tumor fraction. A and B:y Axes denote log2 ratio measurements of coverage obtained in test samples versus normal reference samples. Each point denotes a genomic region measured by the assay, and these are ordered by genomic position. Red lines indicate the average log2 ratio in a segment. Asterisks denote ERBB2 amplification (chromosome 17).
Figure 4
Figure 4
Validation of assay on clinical cfDNA samples by comparison with orthogonal assays performed on the same samples. Mutant allele frequencies (MAFs) observed by FoundationACT were correlated with MAFs observed using orthogonal assays, including FoundationOne next-generation sequencing (Pearson correlation r = 0.98; A), droplet digital PCR (ddPCR; Pearson correlation r = 0.99; B), and beads, emulsions, amplification, and magnetics (BEAMing; Pearson correlation r = 0.93; C).
Figure 5
Figure 5
Clinical genomic profiling of ctDNA using the FoundationACT assay. A: Distribution of cancer types for the 860 cases that were successfully profiled. B: Histogram demonstrating the distribution of allele frequency for the 1252 reportable short variant mutations (variants of unknown significance not included) detected in the 860 cases. Inset: A detailed view for the subset of short variants at lower allele frequencies. C: Frequency of all reportable genomic alterations in most commonly altered genes among the 860 cases. Genes altered in five or more cases are shown. D: List of kinase fusions/re-arrangements detected. Arrows indicate the gene and specific exons involved in the fusion and directionality of the exons (e). Yellow shading indicates the portion of the re-arrangement that includes the intact kinase domain. Asterisks indicate a novel re-arrangement. EGFR KDD, epidermal growth factor receptor kinase domain duplication; Indel, insertion/deletion; NSCLC, non–small-cell lung cancer.
Figure 6
Figure 6
Comparison of genomic profiling of ctDNA (FoundationACT) and tumor tissue samples (FoundationOne). A: The frequency of genomic alterations detected by FoundationACT was evaluated for non–small-cell lung cancer (NSCLC), breast cancer, colorectal cancer (CRC), and prostate cancer cases: for each cancer type, genes with at least two short variants or re-arrangements were included; short variants or re-arrangements were evaluated separately. The results were compared with those observed in our database of FoundationOne genomic profiling results from tissue biopsy specimens. B: Concordance between genomic alterations (GAs) detected in ctDNA and temporally matched tumor tissue from the same patient. Days between blood and tissue collection are shown. Concordant/shared genomic alterations are in blue, genomic alterations detected in tissue only are in gray, and genomic alterations detected in ctDNA only are in red. For samples with multiple unique mutations in a gene, the number of mutations is shown. Indel, insertion/deletion; RE, re-arrangement.
Supplemental Figure S1
Distribution of median unique exon coverage observed in 141 routine clinical cfDNA samples (20 to 100 ng input cfDNA mass) that were processed through the FoundationACT assay (red) and reference cell line samples that were used for analytic validation (blue). A: Distribution of unique coverage observed from the primary experimental data set of reference cell line samples used for analytic validation compared with routine clinical samples. B:In silico sampling of the primary experimental reference cell line data was performed. Aggregate results of multiple samplings of the primary experimental data set were used to generate a sampled data set to simulate the coverage observed in routine clinical samples profiled by the assay.

Similar articles

Cited by

References

    1. Frampton G.M., Fichtenholtz A., Otto G.A., Wang K., Downing S.R., He J. Development and validation of a clinical cancer genomic profiling test based on massively parallel DNA sequencing. Nat Biotechnol. 2013;31:1023–1031. - PMC - PubMed
    1. Hartmaier R.J., Albacker L., Chmielecki J., Bailey M., He J., Goldberg M.E., Ramkissoon S., Suh J., Elvin J.A., Chiacchia S., Frampton G.M., Ross J.S., Miller V., Stephens P.J., Lipson D. High-throughput genomic profiling of adult solid tumors reveals novel insights into cancer pathogenesis. Cancer Res. 2017;77:2464–2475. - PubMed
    1. Zehir A., Benayed R., Shah R.H., Syed A., Middha S., Kim H.R. Mutational landscape of metastatic cancer revealed from prospective clinical sequencing of 10,000 patients. Nat Med. 2017;23:703–713. - PMC - PubMed
    1. Eisenberg R., Varmus H. Insurance for broad genomic tests in oncology. Science. 2017;358:1133–1134. - PubMed
    1. Swisher E.M., Lin K.K., Oza A.M., Scott C.L., Giordano H., Sun J., Konecny G.E., Coleman R.L., Tinker A.V., O'Malley D.M., Kristeleit R.S., Ma L., Bell-McGuinn K.M., Brenton J.D., Cragun J.M., Oaknin A., Ray-Coquard I., Harrell M.I., Mann E., Kaufmann S.H., Floquet A., Leary A., Harding T.C., Goble S., Maloney L., Isaacson J., Allen A.R., Rolfe L., Yelensky R., Raponi M., McNeish I.A. Rucaparib in relapsed, platinum-sensitive high-grade ovarian carcinoma (ARIEL2 part 1): an international, multicentre, open-label, phase 2 trial. Lancet Oncol. 2017;18:75–87. - PubMed

Publication types

Substances