

The socioeconomic profile of alcohol-attributable mortality in South Africa: a modelling study
- PMID: 29936909
- PMCID: PMC6016129
- DOI: 10.1186/s12916-018-1080-0
The socioeconomic profile of alcohol-attributable mortality in South Africa: a modelling study
Abstract
Background: Globally, illness and life expectancy follow a social gradient that puts people of lower socioeconomic status (SES) at higher risk of dying prematurely. Alcohol consumption has been shown to be a factor contributing to socioeconomic differences in mortality. However, little evidence is available from low- and middle-income countries. The objective of this study was to quantify mortality attributable to alcohol consumption in the adult (15+ years) general population of South Africa in 2015 by SES, age, and sex.
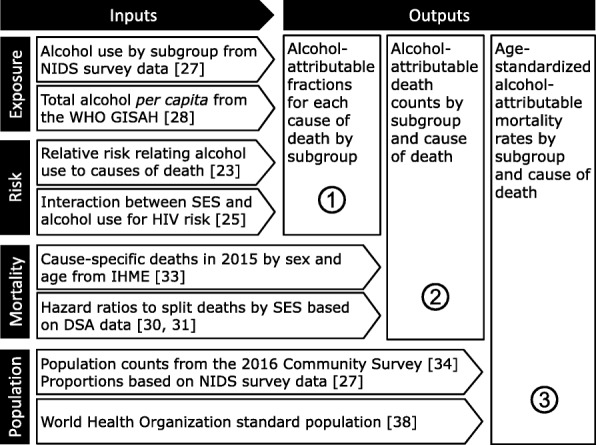
Methods: A comparative risk assessment was performed using individual and aggregate data from South Africa and risk relations reported in the literature. Alcohol-attributable fractions (AAFs) and alcohol-attributable mortality rates were estimated for cause-specific mortality by SES, sex, and age. Monte Carlo simulation techniques were used to calculate 95% uncertainty intervals (UI).
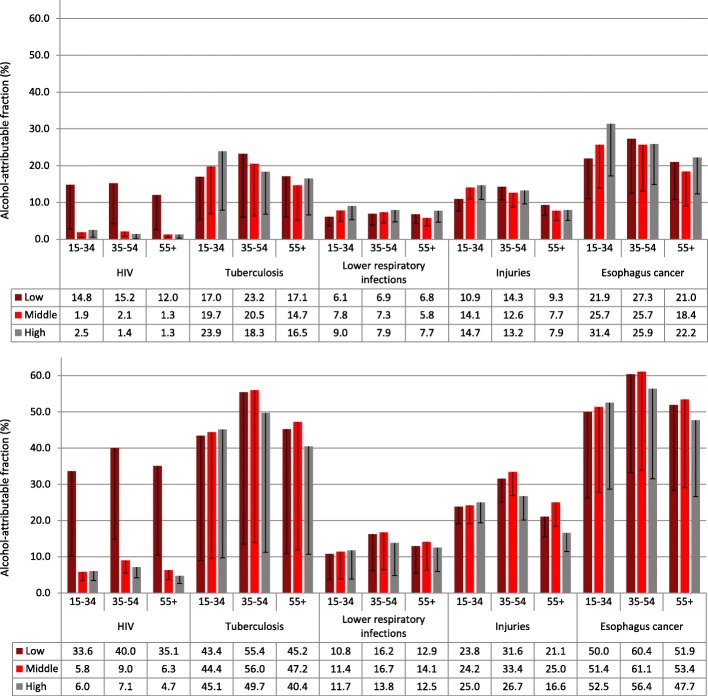
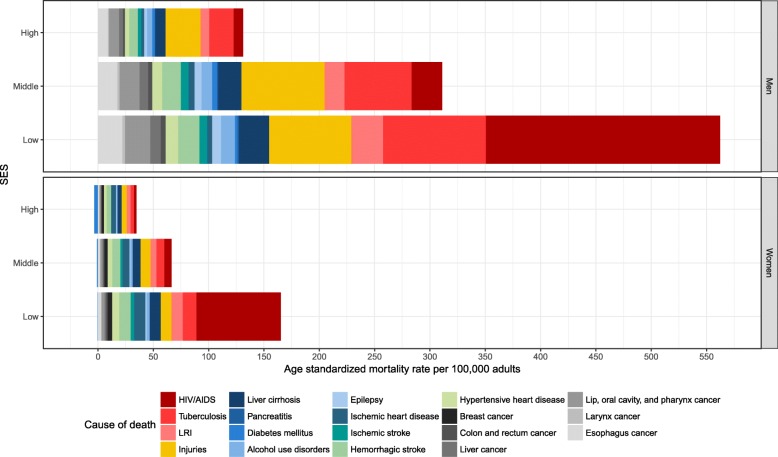
Results: Overall, approximately 62,300 (95% UI 27,000-103,000) adults died from alcohol-attributable causes in South Africa in 2015, with 60% of deaths occurring in people in the low and 15% in the high SES groups. Age-standardized, alcohol-attributable mortality rates per 100,000 adults were highest for the low SES group (727 deaths, 95% UI 354-1208 deaths) followed by the middle (377 deaths, 95% UI 165-687 deaths) and high SES groups (163 deaths, 95% UI 71-289 deaths). The socioeconomic differences were highest for mortality from infectious diseases. People of low SES had a lower prevalence of current alcohol use but heavier drinking patterns among current drinkers. Among men, AAFs were elevated at low and middle SES, particularly for the middle and higher age groups (35+). Among women, AAFs differed less across SES groups and, in the youngest age group (15-34), women of high SES had elevated AAFs.
Conclusions: Alcohol use contributed to vast socioeconomic differences in mortality. Where observed, elevated AAFs for people of low and middle SES arose from higher levels of consumption among current drinkers and not from the prevalence of current alcohol use per se. The findings can direct preventive measures and interventions on those at highest risk. Future research is needed to investigate socioeconomic differences in the risk functions relating alcohol use to cause-specific mortality.
Keywords: Alcohol consumption; Burden of disease; Inequalities; Mortality; Socioeconomic status; South Africa.
Conflict of interest statement
Ethics approval and consent to participate
The study used secondary data exclusively. The analyses conformed to the principles embodied in the Declaration of Helsinki and ethics approval was obtained from the Centre for Addiction and Mental Health Research Ethics Board (CAMH REB; Reference # 117/2016).
Consent for publication
Not applicable.
Competing interests
The authors declare that they have no competing interests.
Publisher’s Note
Springer Nature remains neutral with regard to jurisdictional claims in published maps and institutional affiliations.
Figures

References
-
- Deaton A. The Great Escape: Health, Wealth, and the Origins of Inequality. Princeton: Princeton University Press; 2013.
-
- Milanovic B. Global Inequality. Cambridge: Harvard University Press; 2016.
-
- Marmot M. The Health Gap: The Challenge of an Unequal World. London: Bloomsbury Publishing; 2015. - PubMed
-
- Commission on Social Determinants of Health . Closing the Gap in a Generation: Health Equity through Action on the Social Determinants of Health. Geneva: World Health Organization; 2008. - PubMed
Publication types
MeSH terms
LinkOut - more resources
Full Text Sources
Other Literature Sources
Medical
