. 2018 Jul 10;11(1):183-196.
doi: 10.1016/j.stemcr.2018.05.018. Epub 2018 Jun 21.

Disruption of GRIN2B Impairs Differentiation in Human Neurons

Affiliations

Disruption of GRIN2B Impairs Differentiation in Human Neurons

Scott Bell et al. Stem Cell Reports. .

Abstract

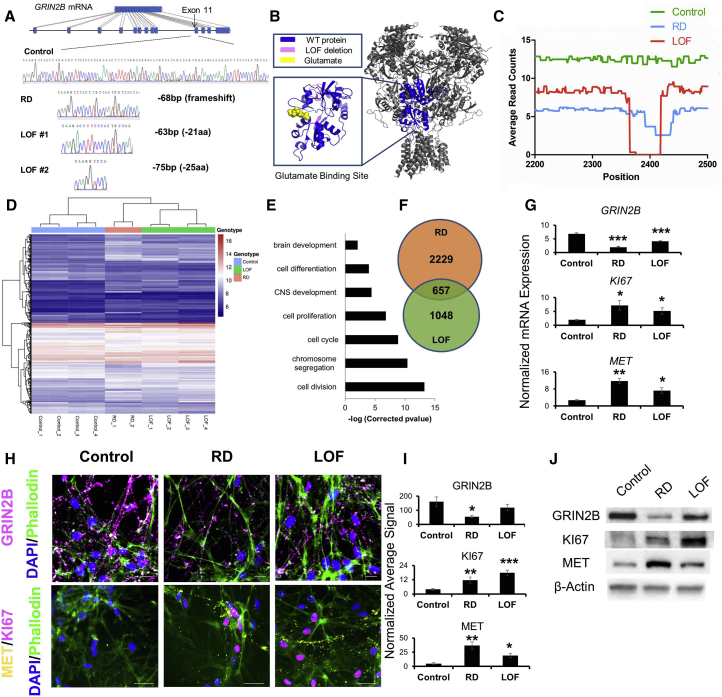
Heterozygous loss-of-function mutations in GRIN2B, a subunit of the NMDA receptor, cause intellectual disability and language impairment. We developed clonal models of GRIN2B deletion and loss-of-function mutations in a region coding for the glutamate binding domain in human cells and generated neurons from a patient harboring a missense mutation in the same domain. Transcriptome analysis revealed extensive increases in genes associated with cell proliferation and decreases in genes associated with neuron differentiation, a result supported by extensive protein analyses. Using electrophysiology and calcium imaging, we demonstrate that NMDA receptors are present on neural progenitor cells and that human mutations in GRIN2B can impair calcium influx and membrane depolarization even in a presumed undifferentiated cell state, highlighting an important role for non-synaptic NMDA receptors. It may be this function, in part, which underlies the neurological disease observed in patients with GRIN2B mutations.

Keywords: CRISPR; CRISPR-Cas9; GRIN2B; NMDA; NMDAR2B; NPCs; glutamate; iPSCs; neural stem cell; neurodevelopment.


Figures

None
Graphical abstract
Figure 1
Figure 1
Generation and Characterization of Forebrain Neurons (A) Outline of procedure used to generate iPSC-derived models of forebrain development. (B) Representative immunocytochemistry (ICC) for the four key pluripotency markers in control iPSCs. Scale bars represent 100 μm. (C) Representative ICC of control neural progenitor cells (NPCs) showing the absence of pluripotency markers and the presence of neuronal forebrain markers. Scale bars represent 50 μm. (D) Representative ICC of forebrain neuronal culture following 30 days of differentiation (D30) from NPCs, demonstrating the relative abundance of glutamatergic, GABAergic, and astrocytic markers in the population. Scale bars represent 50 μm. (E) Quantification of the percentage of cells positive for markers shown in (D). n = 8 images taken from separate coverslips from the same culture of D30 neurons. Error bars denote SD. (F) Representative ICC of forebrain neurons differentiated for 30 days from NPCs demonstrating uniform staining for the forebrain marker MAP2. Scale bar represents 50 μm. (G) Synapsin 1 (SYN1) staining in D30 neurons; Arrows highlight select SYN1 punctate, though many more are visible. Scale bar represents 50 μm. (H) Representative trace of resting membrane potential (RMP) observed in D18 neurons. (I) Representative trace of a hyperpolarizing pulses demonstrating that D18 neurons exhibit inward current and spontaneous action potential. (J) Representative trace of action potentials observed in D18 neurons during current ramp protocol. See also Figures S1–S3 and Table S1.
Figure 2
Figure 2
Forebrain Neural Progenitor Cell Cultures Contain a Subpopulation of Cells that Are Electrically Active and Respond to NMDA (A) Morphology and electrophysiological characteristics of five healthy, control NPCs. Scale bars represent 10 μm. (B) Trace of RMP obtained from NPC 4. (C) Representative trace of a hyperpolarizing pulse applied to NPC 4 showing demonstrating inward current and spontaneous action potential. (D) NPC cells stain uniformly positive for forebrain NPC markers SOX1 and Nestin. Scale bar represents 50 μm. (E) Western blot showing relative level of expression of GRIN1 and GRIN2B in NPCs and D30 forebrain neurons. (F) Stills of NPCs and D5 neural cells incubated with the Fluo4 calcium indicator before and after application of NMDA. Stills obtained from Videos S1 and S2. Scale bars represent 40 μm. (G) Intensity of fluorescent signal detected in NPC and D5 neural cells following application of NMDA and vehicle (DMSO), as shown in Videos S1 and S2. Error bars denote SEM; n ≥ 46 cells from imaged wells. See also Figure S4; Videos S1 and S2.
Figure 3
Figure 3
Genetically Engineered GRIN2B-Deficient Forebrain Neurons Show Impaired Differentiation (A) Location of gene-editing site within GRIN2B, Sanger sequencing of two edited lines, RD (reduced dosage) and LOF (loss of function). RD is heterozygous with only a single alteration resulting in a frame-shifted protein. LOF has two edited alleles, both of which are in-frame. (B) Structure of the NMDA receptor, with a magnified view of the glutamate binding site. The region of the glutamate binding site deleted in the LOF model is highlighted in pink. (C) RNA sequencing reads at the site of editing in transcripts obtained from control, RD, and LOF forebrain D30 neurons after 30 days of differentiation. (D) Hierarchical clustering of control, RD, and LOF D30 neurons after RNA sequencing. Heatmap of the commonly differentially expressed mRNAs in RD and LOF conditions compared with control. (E) Gene ontology terms related to significant enrichment of genes commonly deregulated in GRIN2B RD and in GRIN2B LOF differentiated neurons compared with controls. Corrected p values are expressed as −log. (F) Venn diagram showing the number of genes exclusively or commonly deregulated in GRIN2B LOF and in GRIN2B RD differentiated neurons. (G) Validation of GRIN2B, KI67, and MET mRNA differential expression in LOF and RD D30 neurons by qPCR. mRNA expression is normalized to GAPDH expression. Error bars denote SEM; n = 3 independent experiments, with each data point obtained from a separate culture of neuronal cells. p < 0.05; ∗∗p < 0.01; ∗∗∗p < 0.001. (H) Representative ICC images of GRIN2B, KI67, and MET immunopositive neurons in control, RD, and LOF conditions. Neurons were fixed at D30 of differentiation. Scale bars represent 50 μm. (I) Quantification of GRIN2B, KI67, and MET signals in control, RD, and LOF D30 neurons. The expression level expressed as normalized average signal is: (mean KI67 or MET pixel intensity) × (number of pixels above threshold/number of DAPI-positive pixels). Error bars denote SEM; n = 3 independent experiments, with each data point representing quantifications of coverslips obtained from separate cultures of each cell line. p < 0.05; ∗∗p < 0.01; ∗∗∗p < 0.001. (J) GRIN2B, KI67, and MET western blots of lysates from control, LOF, and RD forebrain neurons at D30. See also Figure S5.
Figure 4
Figure 4
Forebrain Neurons Derived from a GRIN2B Mutation Patient Have Impaired Differentiation that Is Reversible by Genetic Repair (A) Structure of the NMDA receptor, with a magnified view of the glutamate binding site. The patient mutation E413G is displayed in pink and is highlighted with an orange arrow. (B) Sanger sequencing of the patient and a healthy control at the site of mutation in GRIN2B. (C) Average fold change of genes differentially expressed in iPSC-derived neurons from patient E413G compared with controls belonging to the Cell Cycle or Synapse GEO terms. (D) qPCR validation of GRIN2B, KI67, and MET mRNA upregulation in D30 neurons derived from the patient compared with control. Data normalized to GAPDH expression. Error bars denote SEM; n = 3 independent experiments, with each data point obtained from a separate culture of neuronal cells: ∗∗p < 0.01; ∗∗∗p < 0.001. (E) Representative ICC images of GRIN2B, KI67, and MET immunopositive neurons for patient and control D30 neurons. Scale bars represent 25 μm. (F) Quantification of GRIN2B, MET, and KI67 immunopositive signals in neurons from patient D30 neurons compared with control. Error bars denote SEM; n = 7 independent experiments, with each data point representing quantifications of coverslips obtained from separate cultures of each cell line. ∗∗p < 0.01; ∗∗∗p < 0.001. (G) Western blot of GRIN2B, KI67, MET, and β-actin using lysates obtained from control and patient D30 forebrain neurons. (H) Western blot of C-FOS, P-CREB, CREB, and β-actin using lysates obtained from control and patient, RD, and LOF D30 forebrain neurons. (I) Diagram of the experimental procedure used to generate failed repair (RP-F) and successful repair (RP-S) neurons from patient fibroblasts. (J) Sanger sequencing of two failed and successful repaired lines at the site of mutation shown in (B). (K) Normalized expression level of GRIN2B, MET, and KI67 mRNA in failed and successful repair D30 neurons. Measurements are matched by color to the specific line to which they correspond (blue: RP-F1; green: RP-F2; orange: RP-S1; red: RP-S2). Error bars denote SEM; n = 6 independent experiments, with each data point obtained from a separate culture of neuronal cells. ∗∗p < 0.01; ∗∗∗p < 0.001. See also Figure S5.
Figure 5
Figure 5
Pharmacological Block of NMDAR Impairs Neuronal Differentiation (A) Diagram showing the mechanism of action of APV and ifenprodil on NMDAR. (B) Representative ICC images of GRIN2B; MET, and KI67 immunostaining on D30 control neurons either untreated or treated with APV- or ifenprodil-supplemented medium every 72 hr. Scale bars represent 25 μm. (C) Quantification of GRIN2B, MET, and KI67 immunopositive signals shown in (B). Error bars denote SEM; n = 7 independent experiments, with each data point representing quantifications of coverslips obtained from separate cultures of each cell line. p < 0.05; ∗∗p < 0.01; ∗∗∗p < 0.001. (D) Western blot of GRIN2B, KI67, MET, and β-actin using lysates obtain from control D30 neurons differentiated in APV or ifenprodil-supplemented medium. See also Figure S5.
Figure 6
Figure 6
Forebrain Neurons with Genetic Deficiency in GRIN2B Show Impaired Responses to NMDA (A) Stills of D21 control, patient, RD, and LOF forebrain neurons incubated with the Fluo4 calcium indicator before and after application of NMDA. Stills obtained from Video S3. Application of NMDA to D21 Control Neurons, Related to Figure 6, Video S4. Application of NMDA to D21 Patient Neurons, Related to Figure 6, Video S5. Application of NMDA to D21 RD Neurons, Related to Figure 6, Video S6. Application of NMDA to D21 LOF Neurons, Related to Figure 6. Scale bars represent 40 μm. (B) Intensity of fluorescent signal detected in D21 control, patient, RD, and LOF forebrain neurons following application of NMDA and vehicle, as shown in Video S3. Application of NMDA to D21 Control Neurons, Related to Figure 6, Video S4. Application of NMDA to D21 Patient Neurons, Related to Figure 6, Video S5. Application of NMDA to D21 RD Neurons, Related to Figure 6, Video S6. Application of NMDA to D21 LOF Neurons, Related to Figure 6. Error bars denote SEM; n ≥ 58 cells imaged from a well containing each cell line. (C) Frequency of excitatory postsynaptic currents (EPSCs) in control, patient, RD, and LOF neurons after application of vehicle and 2 μM NMDA. Neurons measured between D5 and D9 differentiation time point. (D) Amplitude histogram distribution of EPSCs after application of vehicle or NMDA as described in (C). Amplitude distribution was fitted using a Gaussian fit. (E) Frequency of EPSCs after application of vehicle or 2 μM NMDA as described in (C). See also Figure S5 and Video S3. Application of NMDA to D21 Control Neurons, Related to Figure 6, Video S4. Application of NMDA to D21 Patient Neurons, Related to Figure 6, Video S5. Application of NMDA to D21 RD Neurons, Related to Figure 6, Video S6. Application of NMDA to D21 LOF Neurons, Related to Figure 6.

Similar articles

Cited by

References

    1. Aamodt S.M., Constantine-Paton M. The role of neural activity in synaptic development and its implications for adult brain function. Adv. Neurol. 1999;79:133–144. - PubMed
    1. Adams D.R., Yuan H., Holyoak T., Arajs K.H., Hakimi P., Markello T.C., Wolfe L.A., Vilboux T., Burton B.K., Fajardo K.F. Three rare diseases in one Sib pair: RAI1, PCK1, GRIN2B mutations associated with Smith-Magenis syndrome, cytosolic PEPCK deficiency and NMDA receptor glutamate insensitivity. Mol. Genet. Metab. 2014;113:161–170. - PMC - PubMed
    1. Bading H., Ginty D.D., Greenberg M.E. Regulation of gene expression in hippocampal neurons by distinct calcium signaling pathways. Science. 1993;260:181–186. - PubMed
    1. Balazs R., Hack N., Jorgensen O.S. Stimulation of the N-methyl-D-aspartate receptor has a trophic effect on differentiating cerebellar granule cells. Neurosci. Lett. 1988;87:80–86. - PubMed
    1. Behar T.N., Scott C.A., Greene C.L., Wen X., Smith S.V., Maric D., Liu Q.Y., Colton C.A., Barker J.L. Glutamate acting at NMDA receptors stimulates embryonic cortical neuronal migration. J. Neurosci. 1999;19:4449–4461. - PMC - PubMed

Publication types

MeSH terms

Grants and funding