. 2018 Jul 12;174(2):338-349.e20.
doi: 10.1016/j.cell.2018.05.042. Epub 2018 Jun 21.

mTORC1 Controls Phase Separation and the Biophysical Properties of the Cytoplasm by Tuning Crowding

Affiliations

mTORC1 Controls Phase Separation and the Biophysical Properties of the Cytoplasm by Tuning Crowding

M Delarue et al. Cell. .

Abstract

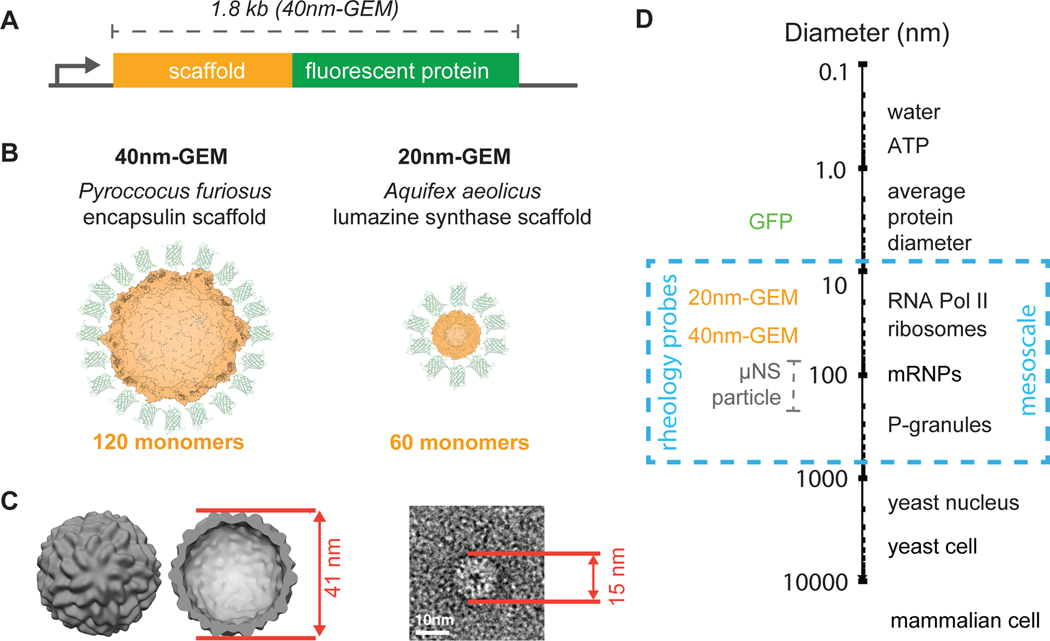
Macromolecular crowding has a profound impact on reaction rates and the physical properties of the cell interior, but the mechanisms that regulate crowding are poorly understood. We developed genetically encoded multimeric nanoparticles (GEMs) to dissect these mechanisms. GEMs are homomultimeric scaffolds fused to a fluorescent protein that self-assemble into bright, stable particles of defined size and shape. By combining tracking of GEMs with genetic and pharmacological approaches, we discovered that the mTORC1 pathway can modulate the effective diffusion coefficient of particles ≥20 nm in diameter more than 2-fold by tuning ribosome concentration, without any discernable effect on the motion of molecules ≤5 nm. This change in ribosome concentration affected phase separation both in vitro and in vivo. Together, these results establish a role for mTORC1 in controlling both the mesoscale biophysical properties of the cytoplasm and biomolecular condensation.

Keywords: biophysics; cytoplasm; electron tomography; mTORC1; microrheology; molecular crowding; nanoparticles; phase separation; ribosomes; systems biology.


Figures

Figure 1.
Figure 1.. Genetically Encoded Multimeric nanoparticles (GEMs) are homomultimeric fluorescent nanoparticles that self-assemble to a stereotyped size and shape.
(A) General gene structure of GEMs, which consist of an in-frame fusion of a multimerizing scaffold (orange) to a fluorescent protein (green). (B) Predicted structures of 40nm-GEMs and 20nm-GEMs. (C) Left, cryo-ET subtomogram average of 40nm-GEMs within the cell; Right, negative stain EM image of a 20nm-GEM. Diameters are shown in red. (D) Diameters of GEMs and other macromolecules at the meso length-scale, shown in relation to small molecules, protein complexes, and cells.
Figure 2.
Figure 2.. mTORC1 inhibition increases the effective diffusion coefficient of GEMs.
(A) 40nm-GEMs expressed in (A) S. cerevisiae and (B) HEK293 cells. GEMs are visualized using the T-Sapphire fluorescent protein (green). The SiR-Hoeschst DNA stain is used to visualize the nucleus (Nuc, magenta). Yeast cell walls are visualized using calcofluor-white and HEK293 membrane with wheat germ agglutinin (cyan). (C) High magnification example of tracking a 40nm-GEM particle (green) within a S. cerevisiae cell, imaged at 100 frames per second. Three other GEMs and the nucleus (magenta) are also seen within the image. Raw pixels are displayed. (D-E) Distribution of 40nm-GEM effective diffusion coefficients (Deff) within S. cerevisiae (D) and HEK293 cells (E); results from DMSO (carrier control) treatment and rapamycin treatment are displayed in blue and orange, respectively. Insets: time and ensemble-averaged mean-square displacements in log-log space with the anomalous exponent indicated. (F) Cumulative distribution function showing Deff data for both S. cerevisiae (solid lines) and HEK293 cells (dashed lines) in both control (blue) and rapamycin treatment (orange).
Figure 3.
Figure 3.. mTORC1 inhibition increases the effective diffusion of particles 20 nm and larger in S. cerevisiae.
(A-C) Cumulative distribution plots showing Deff data for 20nm-GEMs (A), GFA1 mRNP particles (B), and μNS condensates (C) in yeast cells treated with DMSO (blue) or rapamycin (orange). (D) Fluorescence correlation spectroscopy (FCS) autocorrelation function for a tandem GFP dimer (Stokes radius of ~ 5 nm). There is no significant difference between DMSO and rapamycin. (E) Effect of rapamycin on the effective diffusion coefficients of endogenous molecules and tracer particles of various sizes. Indicated, the −2 power-law scaling of diffusion coefficient as a function of diameter, which does not conform to Stokes-Einstein predictions. In all cases control conditions are shown in blue and rapamycin in orange.
Figure 4.
Figure 4.. mTORC1 controls the effective diffusion coefficient of 40nm-GEMs by tuning ribosome concentration.
(A) Selected mutants from a candidate screen in S. cerevisiae. The change in the baseline effective diffusion coefficients of 40nm-GEMs (left, blue) is plotted for each mutant, along with the magnitude of the rapamycin effect normalized to the effect in wild-type cells (ε right, orange; 0 = no rapamycin effect, 1 = same effect as wild-type). (B) Pharmacological and siRNA perturbations in HEK293 cells suggest that mTORC1 also modulates cytoplasmic rheology through ribosome crowding in mammals. Data are presented as the median +/− SEM (standard error of the mean). (C) Proposed model of crowding control in S. cerevisiae and HEK293 cells.
Figure 5.
Figure 5.. In situ cryo-electron tomography of FIB-milled S. cerevisiae reveals that ribosome concentration dramatically decreases upon mTORC1 inhibition.
(A) DMSO-treated cell. (B) Rapamycin-treated cell. (Left) Slice through a representative cryo-electron tomogram of a FIB-milled yeast cell. The cell wall (CW), plasma membrane (PM), rough endoplasmic reticulum (rER), lipid droplets (LD), mitochondria (M), Golgi apparatus (G), vacuole (V), aggregates (Agg), and one example GEM nanoparticle are indicated. (Right) 3D segmentation of the same tomogram showing ribosomes (cyan) and GEMs (orange). The non-cytosolic volume is grey. (C) Subtomogram averages of the 40nm-GEM nanoparticles and ~30 nm ribosomes from within the cellular volumes, shown in relative proportion. (D) Cytosolic ribosome concentrations after 2 h DMSO (blue) and rapamycin (orange) treatment. Error bars are SEM. Concentrations were calculated from 14 DMSO-treated and 13 rapamycin-treated cells (see figures S5 and S6).
Figure 6.
Figure 6.. A physical model of the cytosol accurately predicts diffusion as a function of ribosome concentration.
(A) The phenomenological Doolittle equation describes the effective diffusion coefficient of particles as a function of excluded volume, the volume of the cytoplasm occupied by macromolecules. (B and C) A model based on the Doolittle equation to relate Deff to the concentration of ribosomes, log(D)=ζφ0/φm1φ0/φm1cribo1criboφ0/φm, parameterized empirically with no parameter fitting, accurately predicts the diffusion coefficient of 40nm-GEMs in both yeast (B) and HEK293 cells (C) as a function of the concentration of ribosomes (measured by quantification of a total extracted nucleic acids, see figure S8E-G). Median coefficients of diffusion are normalized to wild-type conditions on the day the data was acquired and plotted as the median +/− SEM. Prediction is shown as a dashed black line with grey confidence intervals based on the error associated with the estimation of ζandφ0/φm.
Figure 7.
Figure 7.. Ribosomes act as a crowding agent that drives phase separation both in vitro and in vivo.
(A) A homodecamer repeat of SUMO (SUMO10) was mixed with a homohexamer repeat SUMO interaction motif peptide (SIM6) to achieve equimolar concentrations of each monomer (60 μM). SUMO10 + SIM6 was kept at constant concentration and incubated with an increasing concentration of fully assembled 70S ribosomes (purified from E. coli). There was a >50% increase in the partition coefficient of SUMO10 + SIM6 when ribosome concentration was increased from 13 μM (equivalent to yeast treated with rapamycin) to 23 μM (the concentration of ribosomes in logarithmically growing yeast cells). (B) An in-frame fusion of SUMO10-SIM6-GFP was expressed in budding yeast (S. cerevisiae W303) and HEK293 cells. Micrographs of control cells (DMSO) and cells treated with rapamycin for 2 h. (C) Quantification of total area of phase-separated droplets in control cells (blue), cells treated with rapamycin (orange), and cells treated with rapamycin followed with a hyperosmotic shock with 1.5M (yeast cells) or 0.1M (human cells) sorbitol (orange bars with white cross hatches). (D) Probability of observing SUMO10-SIM6 phase separation versus ribosome concentration in yeast ribosomal crowding mutants sfp1Δ, rim15Δ, and atg13Δ as well as wild-type BY4741.

Comment in

  • Translating the Physical Code of Life.
    Knapp BD, Huang KC. Knapp BD, et al. Cell. 2018 Jul 12;174(2):253-255. doi: 10.1016/j.cell.2018.06.050. Cell. 2018. PMID: 30007414 Free PMC article.
  • Crowd control.
    Miura G. Miura G. Nat Chem Biol. 2018 Aug;14(8):745. doi: 10.1038/s41589-018-0109-1. Nat Chem Biol. 2018. PMID: 30018416 No abstract available.

References

    1. Akita F, Chong KT, Tanaka H, Yamashita E, Miyazaki N, Nakaishi Y, Suzuki M, Namba K, Ono Y, Tsukihara T, et al. (2007). The crystal structure of a virus-like particle from the hyperthermophilic archaeon Pyrococcus furiosus provides insight into the evolution of viruses. J Mol Biol 368, 1469–1483. - PubMed
    1. Albert S, Schaffer M, Beck F, Mosalaganti S, Asano S, Thomas HF, Plitzko JM, Beck M, Baumeister W, and Engel BD (2017). Proteasomes tether to two distinct sites at the nuclear pore complex. Proceedings of the National Academy of Sciences 114, 13726–13731. - PMC - PubMed
    1. Alberti S, and Hyman AA (2016). Are aberrant phase transitions a driver of cellular aging? Bioessays 38, 959–968. - PMC - PubMed
    1. Asano S, Engel BD, and Baumeister W. (2016). In Situ Cryo-Electron Tomography: A Post-Reductionist Approach to Structural Biology (Academic Press; ). - PubMed
    1. Banani SF, Rice AM, Peeples WB, Lin Y, Jain S, Parker R, and Rosen MK (2016). Compositional Control of Phase-Separated Cellular Bodies. Cell 166, 651–663. - PMC - PubMed

Publication types

MeSH terms

Substances

LinkOut - more resources