. 2018 Jul 26;174(3):549-563.e19.
doi: 10.1016/j.cell.2018.05.052. Epub 2018 Jun 21.

LSD1 Ablation Stimulates Anti-tumor Immunity and Enables Checkpoint Blockade

Affiliations

LSD1 Ablation Stimulates Anti-tumor Immunity and Enables Checkpoint Blockade

Wanqiang Sheng et al. Cell. .

Abstract

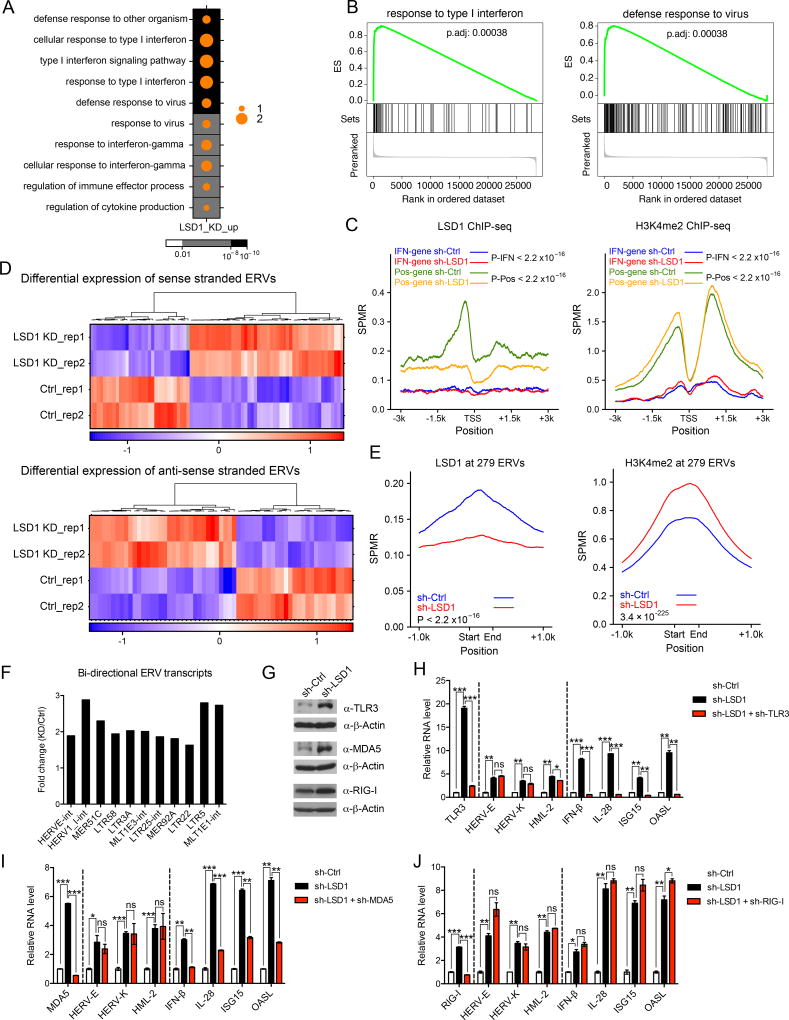
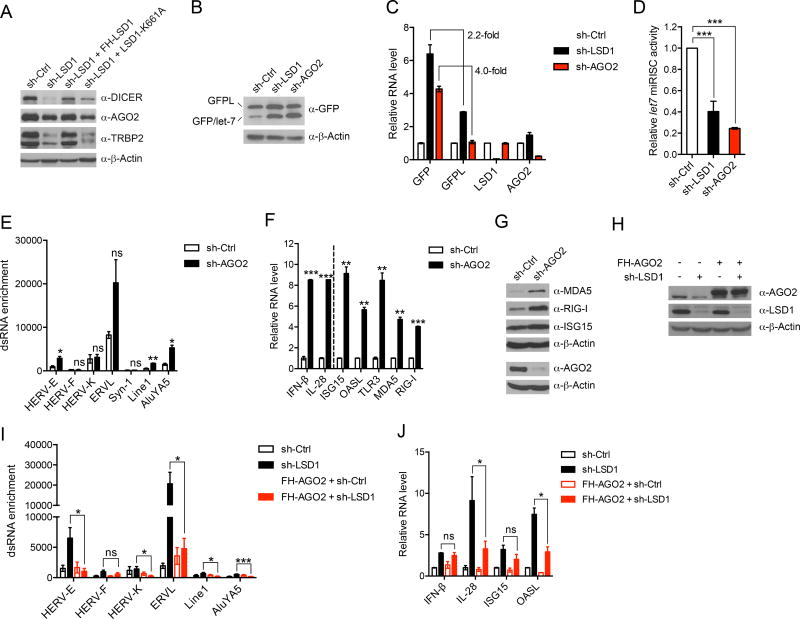
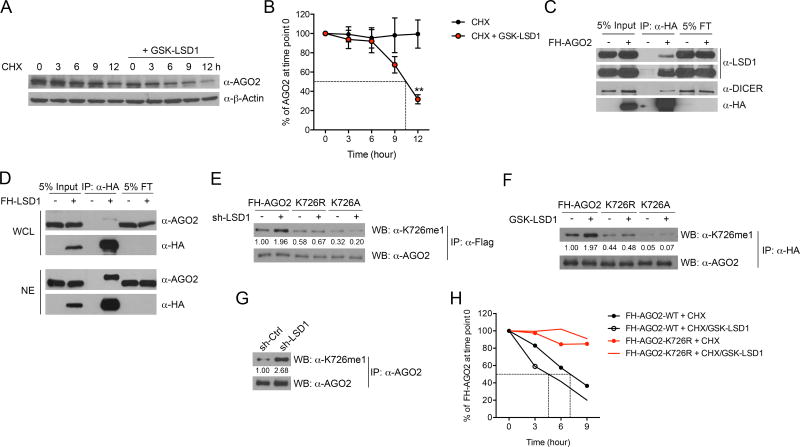
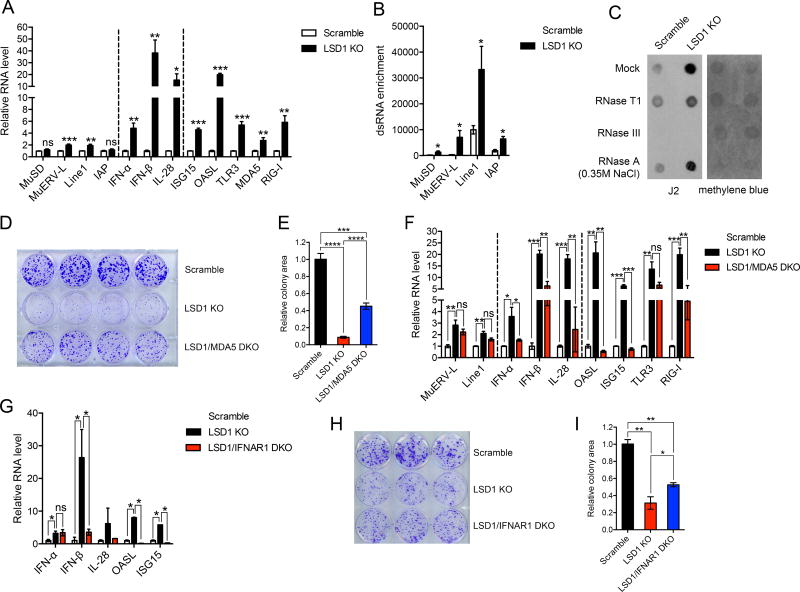
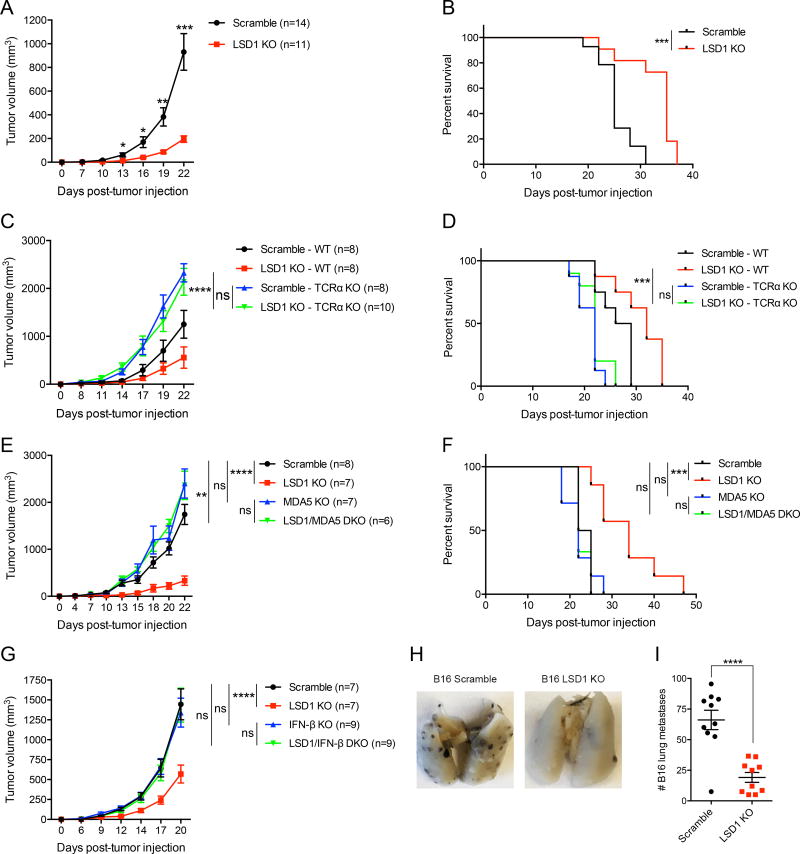
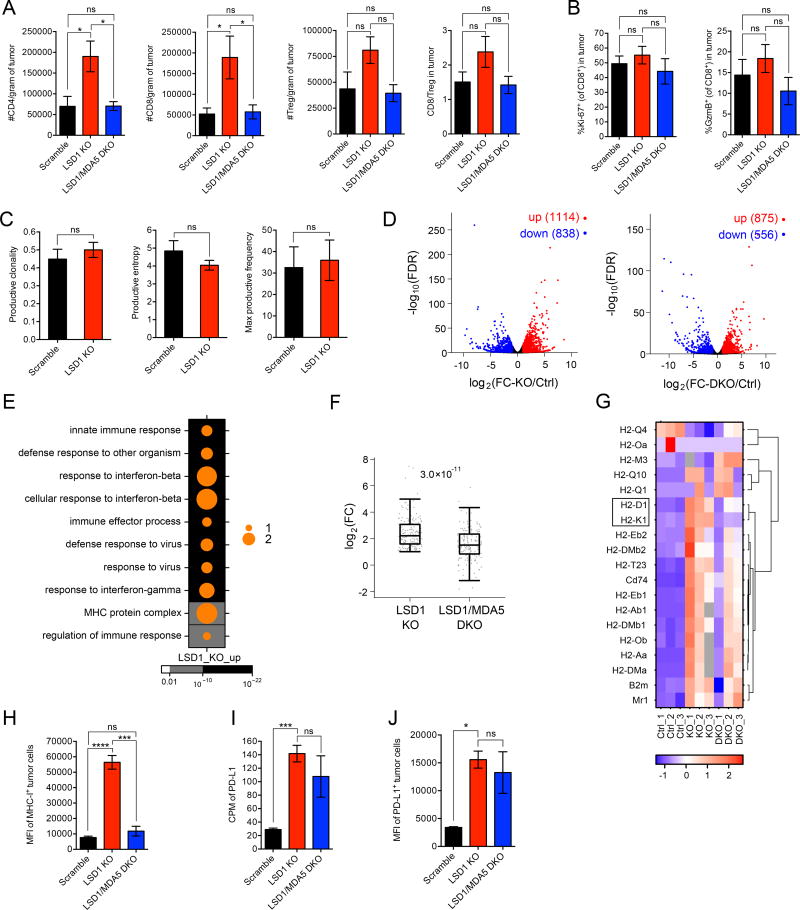
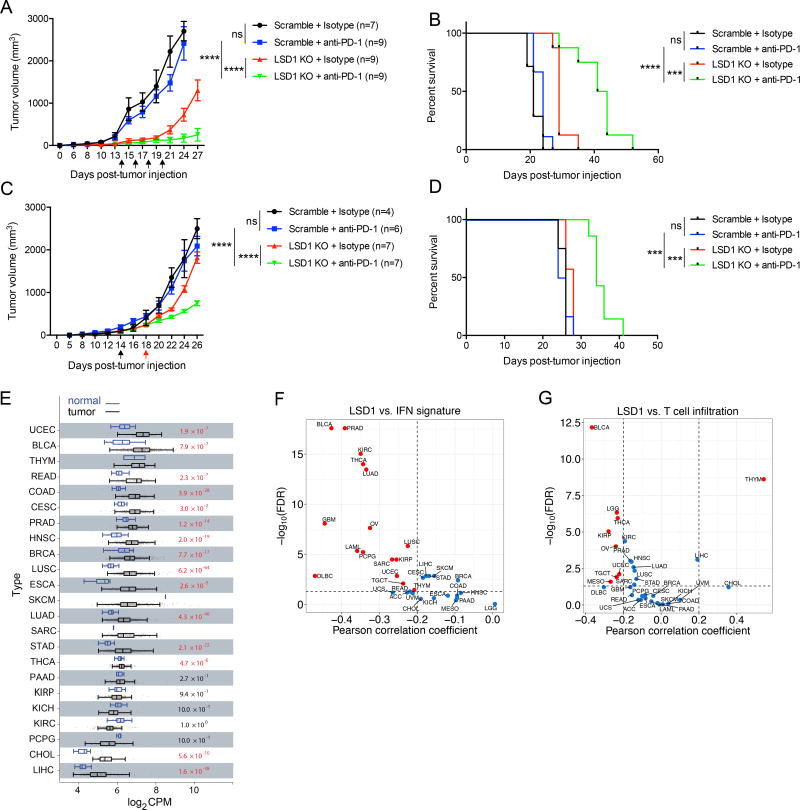
Chromatin regulators play a broad role in regulating gene expression and, when gone awry, can lead to cancer. Here, we demonstrate that ablation of the histone demethylase LSD1 in cancer cells increases repetitive element expression, including endogenous retroviral elements (ERVs), and decreases expression of RNA-induced silencing complex (RISC) components. Significantly, this leads to double-stranded RNA (dsRNA) stress and activation of type 1 interferon, which stimulates anti-tumor T cell immunity and restrains tumor growth. Furthermore, LSD1 depletion enhances tumor immunogenicity and T cell infiltration in poorly immunogenic tumors and elicits significant responses of checkpoint blockade-refractory mouse melanoma to anti-PD-1 therapy. Consistently, TCGA data analysis shows an inverse correlation between LSD1 expression and CD8+ T cell infiltration in various human cancers. Our study identifies LSD1 as a potent inhibitor of anti-tumor immunity and responsiveness to immunotherapy and suggests LSD1 inhibition combined with PD-(L)1 blockade as a novel cancer treatment strategy.

Keywords: LSD1; MHC-1; PD-1/PD-L1; RISC; T cell infiltration; anti-tumor immunity; dsRNA; endogenous retroviral element; immune checkpoint blockade; interferon.


Conflict of interest statement

DECLARATION OF INTERESTS

All other authors declare no competing interests.

Figures

Figure 1
Figure 1. LSD1 restrains intracellular dsRNA stress and IFN activation
(A) A dot map showing top 10 terms in GO analysis of up-regulated genes (log2(FC-KD/Ctrl) > 1 and FDR < 0.05) in LSD1 KD versus control MCF-7 cells. FC-fold change. Background color and dot size represent FDR and log2 transformed odds ratio separately. (B) GSEA analysis in LSD1 KD versus control MCF-7 cells. (C) LSD1 and H3K4me2 ChIP-seq signals at promoter regions of 125 induced IFN/antiviral responsive genes (IFN-gene, log2(FC-KD/Ctrl) > 0 and FDR < 0.05) or selected 537 genes with LSD1 peaks as positive control (Pos-gene) in control and LSD1 KD cells. (D) Heatmaps for differential expression (FDR < 0.05) of sense or antisense transcripts of ERVs between control and LSD1 KD cells. (E) LSD1 and H3K4me2 ChIP-seq signals at genomic loci of 8593 individual ERVs from 279 ERV subfamilies in control and LSD1 KD cells. (F) Fold changes of a number of representative bi-directional ERV transcripts in LSD1 KD versus control cells determined by directional RNA-seq. (G) Immunoblots of TLR3, MDA5 and RIG-I in MCF-7 cells. (H–J) The RT-qPCR analysis of transcripts of selected ERVs, IFNs and ISGs in MCF-7 cells transduced with shRNA against scramble, LSD1 or LSD1 plus TLR3 (H), MDA5 (I) or RIG-I (J). The RT-qPCR data were normalized to GAPDH and presented as fold changes of gene expression in the test sample compared to the control, representing two to three independent experiments. Error bars represent standard deviation (SD) between two replicate samples in one experiment. *p < 0.05, **p < 0.01, ***p < 0.001, ns, not significant, as determined by unpaired t-test. Also see Figure S1 and Figure S2.
Figure 2
Figure 2. LSD1 inhibition suppresses the expression of RISC components, contributing to dsRNA stress
(A) Immunoblots of RISC components in MCF-7 cells transduced with shRNA against scramble or LSD1, and rescued with either WT LSD1 or catalytically compromised LSD1-K661A. (B–D) U2OS stable cell line expressing dual reporters GFPL/GFP-let-7 was transduced with shRNA against scramble, LSD1 or AGO2. The expression of GFPL and GFP was measured by immunoblot (B) and RT-qPCR (C). The ratios of GFPL over GFP protein in different samples from five repeats for sh-LSD1 and two repeats for sh-AGO2 were calculated and the ratio in sh-Ctrl sample was considered as 100% miRISC activity (D). (E) The dsRNA enrichment of a few retrotransposons assessed by RNase A digestion and RT-qPCR analysis. (F and G) The expression of IFNs and ISGs in control and AGO2 KD MCF-7 cells analyzed by RT-qPCR (F) and immunoblot (G). (H–J) The measurement of AGO2 and LSD1 protein expression by immunoblot (H), dsRNA enrichment of a few retrotransposons (I), and RNA levels of IFNs and ISGs by RT-qPCR (J) in MCF-7 cells with indicated manipulations. Error bars represent SD between duplicates (C, E and F) or triplicates (J) in one of two experiments, or standard error of the mean (SEM) from five experiments (I). *p < 0.05, **p < 0.01, ***p < 0.001, ns, not significant, as determined by unpaired t-test. Also see Figure S3.
Figure 3
Figure 3. LSD1 regulates AGO2 methylation status and stability
(A and B) Representative immunoblot of AGO2 (A) and quantification of AGO2 signal from five experiments (B, mean±SEM) in MCF-7 cells treated with 50 µg/ml cycloheximide (CHX) in the presence or absence of 2 µM GSK-LSD1 for the indicated times. (C and D) The physical interaction between LSD1 and AGO2 was examined by co-IP assay using whole cell lysate (WCL) of MCF-7 cells stably expressing FH-AGO2 (C), or reciprocally using WCL and nuclear extract (NE) of MCF-7 cells stably expressing FH-LSD1 (D). FT-flow through. (E and F) Ectopically expressed WT FH-AGO2 and mutants in MCF-7 cells treated by LSD1 KD (E) or GSK-LSD1 (F) were immunoprecipitated, and then immunoblotted with mono-methyl AGO2 specific antibody and an AGO2 antibody. (G) The immunoblot of K726me1 on endogenous AGO2 in control or LSD1 KD MCF-7 cells. (H) The protein stability of transiently expressed WT FH-AGO2 and FH-AGO2-K726R in 293T cells was measured using CHX chase assay in the presence or absence of 2 µM GSK-LSD1. The averaged AGO2 quantification from two experiments is shown. **p < 0.01, as determined by unpaired t-test. Also see Figure S3.
Figure 4
Figure 4. LSD1 abrogation-induced dsRNA stress suppresses tumor cell growth in vitro
(A) The transcripts of selected retrotransposons, IFNs and ISGs in control and LSD1 KO (clone g5-4) B16 cells analyzed by RT-qPCR. (B) The dsRNA enrichment of a few retrotransposons in control and LSD1 KO B16 cells assessed by RNase A digestion and RT-qPCR analysis. (C) Total RNA extract treated with mock, RNase T1, RNase III or RNase A (350 mM NaCl) was dotted on Hybond N+ membranes, visualized by methylene blue staining and immunoblotted with J2 antibody. (D and E) Colony formation (D) and quantification of colony areas (E) of scramble, LSD1 KO or LSD1/MDA5 DKO B16 cells. (F) The expression of selected retrotransposons, IFNs and ISGs in scramble, LSD1 KO and LSD1/MDA5 DKO B16 cells analyzed by RT-qPCR. (G) The expression of IFNs and ISGs in scramble, LSD1 KO and LSD1/IFNAR1 DKO B16 cells analyzed by RT-qPCR. (H and I) Colony formation (H) and quantification of colony areas (I) of scramble, LSD1 KO or LSD1/IFNAR1 DKO B16 cells. Error bars represent SEM from three (A and B) or two (F) experiments, or representing SD between duplicates (G), quadruplicates (E) or triplicates (I) in one of two experiments. *p < 0.05, **p < 0.01, ***p < 0.001, ****p < 0.0001, ns, not significant, as determined by unpaired t-test. Also see Figures S4 and S5.
Figure 5
Figure 5. LSD1 inhibition stimulates anti-tumor T cell immunity, which depends on dsRNA recognition and IFN-β production
(A and B) Tumor growth (A) and survival curves (B) of immunocompetent mice inoculated with 500k scramble or LSD1 KO B16 cells. (C and D) Tumor growth (C) and survival curves (D) of immunocompetent or immunodeficient (TCRα KO) mice inoculated with 500k scramble or LSD1 KO B16 cells. (E and F) Tumor growth (E) and survival curves (F) of immunocompetent mice inoculated with 500k scramble, LSD1 KO, MDA5 KO, or LSD1/MDA5 DKO B16 cells. (G) Tumor growth of immunocompetent mice inoculated with 500k scramble, LSD1 KO, IFN-β KO, or LSD1/IFN-β DKO B16 cells. (H and I) Representative images (H) and quantification (I) of lung metastasis in immunocompetent mice receiving 200k scramble or LSD1 KO B16 cells intravenously. Data represent two independent experiments (A–F). Error bars represent SEM of individual mice per group in one experiment. *p<0.05, **p < 0.01, ***p < 0.001, ****p < 0.0001, ns, not significant, as determined by unpaired t-test (A and I), Log-rank test (B, D and F), or 2-way ANOVA (C, E and G).
Figure 6
Figure 6. LSD1 inhibition enhances tumor immunogenicity
(A) Tumor infiltrating lymphocytes (TILs) from transplanted B16 tumors (n=5 for scramble, n=5 for LSD1 KO and n=6 for LSD1/MDA5 DKO) in immunocompetent mice were analyzed by flow cytometry at day 14 post implantation when tumor sizes were comparable among the three groups. (B) The expression of Ki-67 and GzmB by CD8+ TILs as in (A) was analyzed by flow cytometry. (C) The clonality and entropy of CD8+ TILs isolated from transplanted B16 tumors (n=5 for scramble and n=3 for LSD1 KO) were analyzed by TCR sequencing. (D–G) GFP-labeled B16 tumor cells (n=3 per group of scramble, LSD1 KO and LSD1/MDA5 DKO) were isolated from tumor-bearing immunocompetent mice and subjected to RNA-seq analysis. Differential gene expression was shown in volcano plots (D). Dots in red represent increased genes (log2(FC) > 1 and FDR < 0.05) and dots in blue represent decreased genes (log2(FC) < −1 and FDR < 0.05) in LSD1 KO versus scramble cells (left plot) or LSD1/MDA5 DKO versus scramble cells (right plot). GO analysis of up-regulated genes (log2(FC-KO/Ctrl) > 1 and FDR < 0.05) in LSD1 KO versus scramble cells was performed and top 10 terms were shown in a dot map (E). The up-regulated genes associated with top 10 GO terms (170 in total) were sorted out and log2(FC) of their expression in LSD1 KO and LSD1/MDA5 DKO versus scramble cells was plotted (F). All genes categorized in GO term “MHC protein complex” were displayed in a heatmap (G). (H–J) Flow cytometry analysis of MHC-1 (H) and PD-L1 (J) expression and RNA-seq analysis of PD-L1 expression (I) by GFP-labeled B16 tumor cells (n=3 per group of scramble, LSD1 KO and LSD1/MDA5 DKO) isolated from tumor-bearing mice. Data represent two independent experiments (A, B, H and J). Error bars represent SEM of individual mice per group in one experiment. *p < 0.05, ***p < 0.001, ****p < 0.0001, ns, not significant, as determined by unpaired t-test. Also see Figures S6.
Figure 7
Figure 7. LSD1 inhibition overcomes tumor resistance to PD-1 blockade in a mouse model and LSD1 expression level is inversely correlated with T cell infiltration in human tumors
(A and B) Tumor growth (A) and survival curves (B) of immunocompetent mice inoculated with 250k B16 cells, and treated with anti-PD-1 or isotype control. Arrows indicate time points of anti-PD-1 injection. (C and D) Tumor growth (C) and survival curves (D) of immunocompetent mice inoculated with 500k B16 cells, and treated with anti-PD-1 or isotype control based on a set tumor size (~200 mm3) for initial treatment. Arrows indicate time points of initial anti-PD-1 injection into scramble tumor-bearing mice (in black) and LSD1 KO tumor-bearing mice (in red), followed by additional anti-PD-1 injections every other day. (E) The analysis of LSD1 RNA expression in tumors and normal tissues from patients with indicated types of cancers in TCGA dataset. (F and G) Correlation analysis for LSD1 expression level versus IFN signature (F) or CD8+ T cell infiltration (G) in tumors from indicated types of cancer patients in TCGA dataset. Error bars represent SEM of individual mice per group in one experiment. ***p < 0.001, ****p < 0.0001, ns, not significant, as determined by 2-way ANOVA (A and C), or Log-rank test (B and D). Also see Figure S7.

References

    1. Baylin SB, Jones PA. A decade of exploring the cancer epigenome - biological and translational implications. Nat Rev Cancer. 2011;11:726–734. - PMC - PubMed
    1. Berrens RV, Andrews S, Spensberger D, Santos F, Dean W, Gould P, Sharif J, Olova N, Chandra T, Koseki H, et al. An endosiRNA-Based Repression Mechanism Counteracts Transposon Activation during Global DNA Demethylation in Embryonic Stem Cells. Cell Stem Cell. 2017;21:694–703. e697. - PMC - PubMed
    1. Brookes E, Shi Y. Diverse epigenetic mechanisms of human disease. Annu Rev Genet. 2014;48:237–268. - PubMed
    1. Chen Q, Sun L, Chen ZJ. Regulation and function of the cGAS-STING pathway of cytosolic DNA sensing. Nat Immunol. 2016;17:1142–1149. - PubMed
    1. Chen S, Lee LF, Fisher TS, Jessen B, Elliott M, Evering W, Logronio K, Tu GH, Tsaparikos K, Li X, et al. Combination of 4-1BB agonist and PD-1 antagonist promotes antitumor effector/memory CD8 T cells in a poorly immunogenic tumor model. Cancer Immunol Res. 2015;3:149–160. - PubMed

Publication types