. 2018 Jul 26;174(3):700-715.e18.
doi: 10.1016/j.cell.2018.05.047. Epub 2018 Jun 21.

The Inner Nuclear Membrane Is a Metabolically Active Territory that Generates Nuclear Lipid Droplets

Affiliations

The Inner Nuclear Membrane Is a Metabolically Active Territory that Generates Nuclear Lipid Droplets

Anete Romanauska et al. Cell. .

Abstract

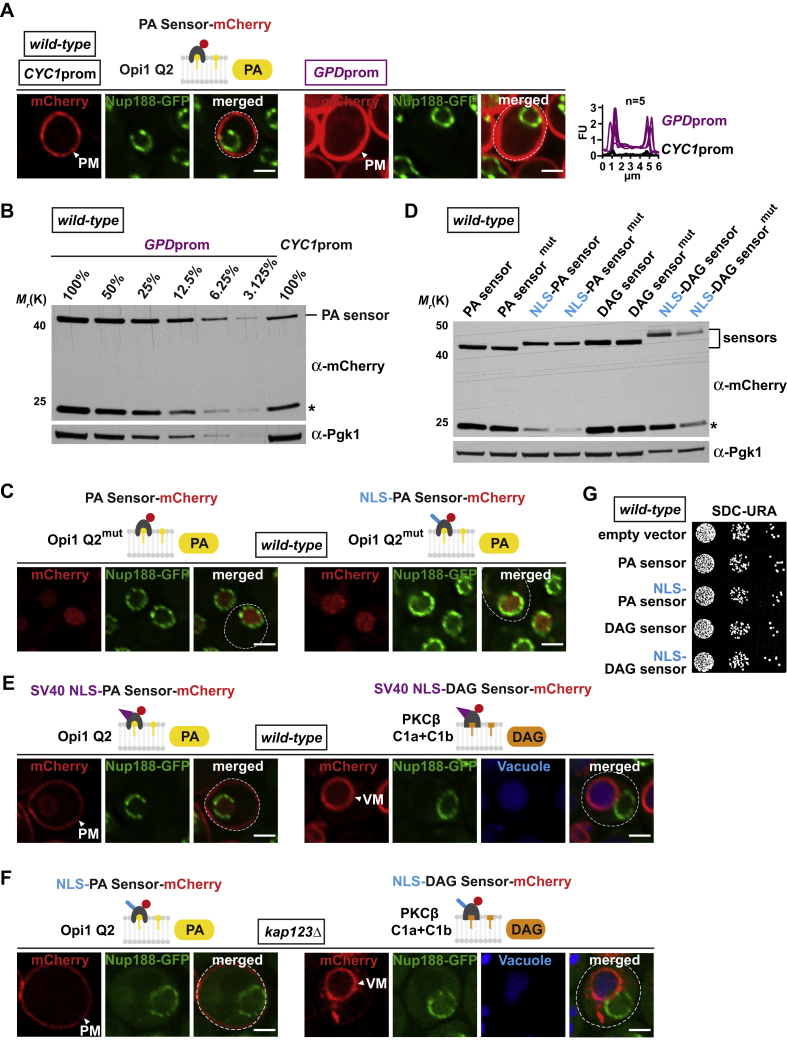
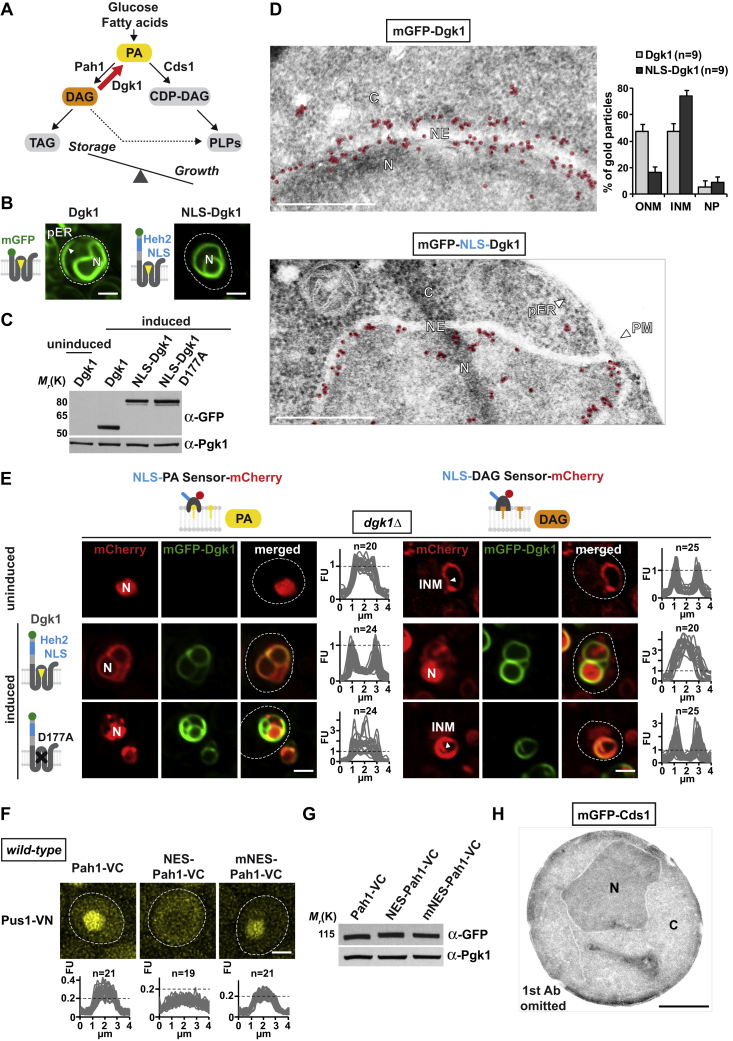
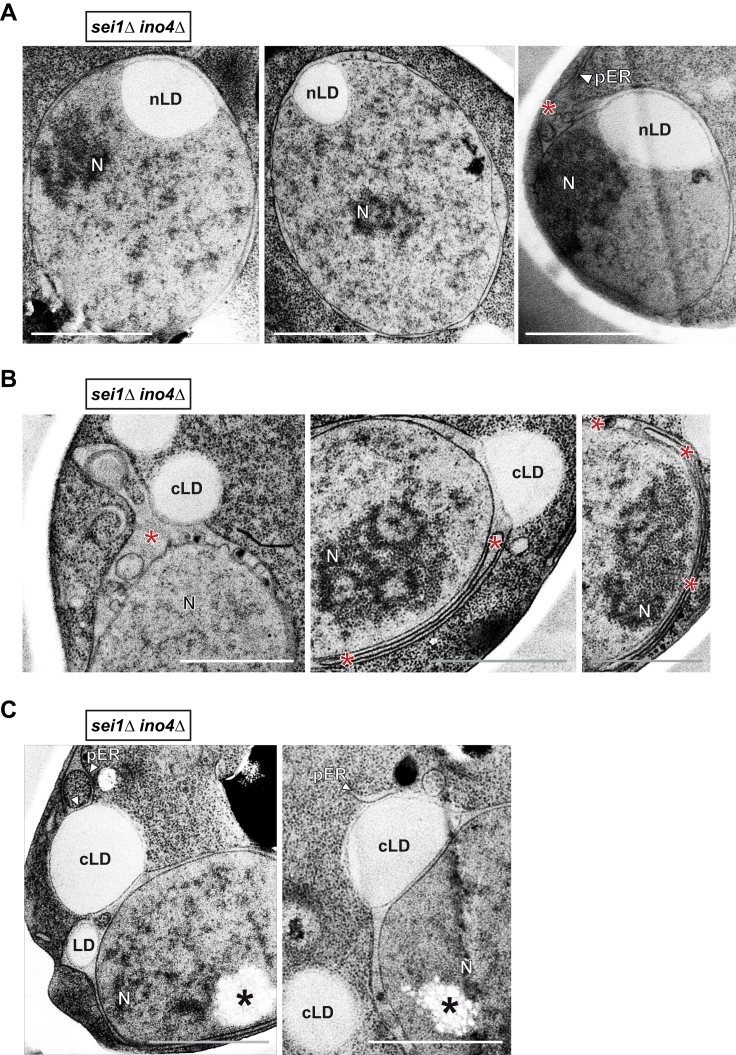
The inner nuclear membrane (INM) encases the genome and is fused with the outer nuclear membrane (ONM) to form the nuclear envelope. The ONM is contiguous with the endoplasmic reticulum (ER), the main site of phospholipid synthesis. In contrast to the ER and ONM, evidence for a metabolic activity of the INM has been lacking. Here, we show that the INM is an adaptable membrane territory capable of lipid metabolism. S. cerevisiae cells target enzymes to the INM that can promote lipid storage. Lipid storage involves the synthesis of nuclear lipid droplets from the INM and is characterized by lipid exchange through Seipin-dependent membrane bridges. We identify the genetic circuit for nuclear lipid droplet synthesis and a role of these organelles in regulating this circuit by sequestration of a transcription factor. Our findings suggest a link between INM metabolism and genome regulation and have potential relevance for human lipodystrophy.

Keywords: Lipin; Seipin; diacylglycerol; endoplasmic reticulum; inner nuclear membrane; lipid metabolism; lipid sensors; nuclear lipid droplets; phosphatidic acid; transcription factor.


Figures

None
Graphical abstract
Figure 1
Figure 1
Lipid Biosensors for Probing the INM (A) Simplified cartoon of yeast lipid biosynthesis depicting the two major branches leading to synthesis of phospholipids (PLPs) (Growth) or triacylglycerol (TAG) (Storage). Phosphatidic acid (PA) is a central precursor. The Kennedy pathway (dashed line) channels diacylglycerol (DAG) into PLP production. CDP-DAG, cytidine diphosphate diacylglycerol. (B) Presumed lipid traffic between the contiguous membranes of endoplasmic reticulum (ER), outer nuclear membrane (ONM), and inner nuclear membrane (INM). Lipid droplets (LDs) form on ER and ONM. NPC, nuclear pore complex. (C) Live imaging of cells expressing the plasmid-based PA sensor Opi1 Q2-mCherry with or without an N-terminal Nup60 nuclear localization sequence (NLS). Nup188-GFP marks the nuclear envelope; dashed white line indicates the cell contour. Sensor fluorescence intensity was quantified across a line spanning the whole cell (left) or the nucleus (right). For comparison, the FU value 1 is marked with a horizontal dashed line. n = number of randomly selected cells. FU, arbitrary fluorescence units; PM, plasma membrane. Scale bar, 2 μm. (D) Live imaging of cells expressing the plasmid-based DAG-mCherry sensor with or without the N-terminal NLS. Vacuoles stained with CellTracker Blue. Sensor fluorescent intensity was quantified across the vacuole (left) or the nucleus (right). INM, inner nuclear membrane; VM, vacuolar membrane. Scale bar, 2 μm. (E) Experimental design for BiFC (bimolecular fluorescence complementation). VN, VC, complementary Venus fragments. (F) Live imaging of cells expressing the indicated BiFC constructs. Lipid sensors are fused with VC, Nup60, and Pus1 with VN. Empty vectors are used as controls. Fluorescent intensity was quantified across the nucleus. n = number of randomly selected cells. Scale bar, 2 μm. (G) Apparent localization of major PA and DAG pools in wild-type cells as detected by lipid biosensors. N, nucleus; V, vacuole; otherwise abbreviations are the same as above. See also Figure S1, Figure S2, Figure S3, Figure S7.
Figure S1
Figure S1
Characterization of Lipid Sensor Specificity and Nuclear Import, Related to Figure 1 (A) Overexpression of the Opi1 Q2 sensor detects the same cellular distribution of PA. Live imaging of exponentially growing cells expressing the plasmid-based PA sensor Opi1 Q2-mCherry under the CYC1 or GPD (TDH3) promoter. Nup188-GFP labels NPCs. Images were taken with the same exposure time and scaling. Line-scan graphs generated in ImageJ quantify the increase in sensor fluorescent intensity at the PM upon overexpression. n indicates the number of randomly selected cells, y axis: Arbitrary Fluorescence Units, FU; x axis: distance in μm. Dashed line marks the cell contours. Plasma membrane, PM. Scale bar: 2 μm. (B) Comparison of PA sensor protein levels when expressed from the CYC1 or stronger GPD (TDH3) promoter in wild-type cells. Denaturing extracts were prepared and immunoblotted with an anti-mCherry antibody directed against the sensors and with an anti-Pgk1 (3-phosphoglycerate kinase) antibody as a loading control. Serial dilutions of cell extracts are shown. Asterisk indicates mCherry-reactive degradation product. (C) Live imaging of cells expressing the indicated plasmid-based sensors and genomically integrated Nup188-GFP. Mutations in Opi1 Q2 (Q2mut) were previously characterized to reduce PA affinity as shown by the lack of PA detection at the plasma membrane (Loewen et al., 2004). The mutant PA sensor lacking an NLS is imported into the nucleus due to an endogenous NLS overlapping with the Q2 domain (Loewen et al., 2004). Scale bar: 2 μm. (D) Comparison of the indicated sensor protein levels in wild-type cells. Denaturing extracts were prepared and immunoblotted with an anti-mCherry antibody against the sensors and with an anti-Pgk1 antibody as a loading control. Asterisk indicates mCherry-reactive degradation product. (E) Live imaging of cells expressing the indicated plasmid-based PA and DAG sensors, both carrying an N-terminal Simian-Virus 40 large T-antigen nuclear localization sequence (SV40 NLS). This type of NLS is known to depend on the Kap60/Kap95 import pathway. Compared to the Nup60 NLS, the SV40 NLS failed to import the lipid sensors into the nucleus. Vacuoles are stained using CellTracker Blue. Plasma membrane, PM; vacuolar membrane, VM. Scale bar: 2 μm. (F) Kap123 is required for importing lipid sensors harboring an NLS present in aa1-24 of Nup60 (Mészáros et al., 2015). Live imaging of kap123Δ cells expressing a plasmid-based NLS-PA sensor or NLS-DAG sensor and genomically integrated Nup188-GFP. Both sensors exhibit the distribution of the non-NLS sensors upon inhibition of nuclear import. Thus, DAG and PA recognition is not generally impaired by the Nup60 NLS or the SV40 NLS (E). Vacuoles are stained using CellTracker Blue. Plasma membrane, PM; vacuolar membrane, VM. Scale bar: 2 μm. (G) Growth analysis of wild-type cells transformed with the indicated plasmids. Growth was followed on SDC-Ura plates. Cells were spotted onto plates in 10-fold serial dilutions and incubated for 2 days at 30°C.
Figure S2
Figure S2
Characterization of Lipid Sensor Specificity, Related to Figure 1 (A) Live imaging of cells expressing the plasmid-based PA sensor Spo20-mCherry with or without the Nup60 NLS. Spo20 is a sporulation-specific protein required for the formation of the yeast prospore membrane (Nakanishi et al., 2004). The Spo20 sensor detects PA pools in the same subcellular localization as Opi1 Q2 with high PA levels at the plasma membrane and low PA levels at the INM. Line-scan graphs generated in ImageJ were used to quantify sensor fluorescent intensity at the PM and in the nucleus. n indicates the number of randomly selected cells, y axis: Arbitrary Fluorescence Units, FU; x axis: distance in μm. Plasma membrane, PM. Scale bar: 2 μm. (B) Specificity control for the Spo20 PA sensors. A mutant version of Spo20 (Nakanishi et al., 2004) no longer detected PA at the plasma membrane (left panel). Line-scan graphs were used to quantify sensor fluorescent intensity at the plasma membrane (line drawn across plasma membrane and cytoplasm) and in the nucleus. Scale bar: 2 μm. (C) Specificity controls for the indicated DAG sensors. The PKCβ C1a+C1b was mutated at residues Q63 and Q128, which are critical for DAG sensing (Lučić et al., 2016). The NLS-sensor no longer detected DAG at the INM (right panel), whereas the non-NLS sensor failed to detect DAG at the vacuole (left panel). See Figure S1D for protein expression/stability. Line-scans quantify sensor fluorescent intensity across the vacuole (line drawn across vacuole and cytoplasm) and in the nucleus. n indicates the number of randomly selected cells, y axis: Arbitrary Fluorescence Units, FU; x axis: distance in μm. Vacuoles are stained with CellTracker Blue. Scale bar: 2 μm. (D) ∼40-fold overexpression of the PKCβ C1a+C1b sensor does not detect DAG at the ONM or ER. Live imaging of exponentially growing cells expressing the plasmid-based DAG sensor C1a+C1b-mCherry under the CYC1, stronger GPD or highly inducible GAL1 promoter. Nup188-GFP labels the nuclear envelope. The GAL1 promoter causes high sensor overexpression and saturation of the maximum intensity values when recorded with the same imaging exposure as the CYC1 or GPD promoter (0.4 s) and is therefore also recorded with 0.05 s. Line-scan graphs quantify the increase in sensor fluorescent intensity at the VM upon overexpression from the GPD promoter. n indicates the number of randomly selected cells, y axis: Arbitrary Fluorescence Units, FU; x axis: distance in μm. Vacuolar membrane, VM. Scale bar: 2 μm. (E) Comparison of DAG sensor protein levels when expressed from the CYC1, GPD or GAL1 promoter. Denaturing cell extracts were prepared and immunoblotted with an anti-mCherry antibody directed against the sensors and with an anti-Pgk1 antibody as a loading control. Serial dilutions of cell extracts were prepared. The GAL1 promoter increases the sensor protein levels approximately 40-fold compared to CYC1. Asterisk indicates mCherry-reactive degradation product. (F) Live imaging of Pma1-FKBP12 cells expressing the plasmid-based DAG sensor and Pah1-FRB-GFP or Pah1 7A-FRB-GFP. Cells were treated with a final concentration of 1 μg/mL of rapamycin for 1 hr. Targeting wild-type Pah1 to the PM resulted in a modest increase of DAG in this location, possibly because of an inefficient activation by the ER-resident Nem1-Spo7 phosphatase complex, which activates Pah1 through dephosphorylation (Santos-Rosa et al., 2005). A Pah1 variant, which harbors 7 Ser to Ala point mutations (Pah1 7A) at known Pah1 phosphorylation sites, is thought to bypass the need for Nem1-Spo7 dephosphorylation and is constitutively active (O’Hara et al., 2006). Accordingly, Pah1 7A strongly increased DAG levels at the PM. Line-scan graphs were used to compare sensor fluorescence intensity at the VM and the PM. Lines were drawn across these two membranes (3 μm dashed white lines) in cells with similar corrected total cell fluorescence (CTCF). Measurements confirm that the sensor can simultaneously recognize DAG at the vacuole and other endomembranes. This also excludes the possibility that sequestration of the sensor on the vacuole would prevent it from recognizing DAG at the ONM/ER consistent with sensor overexpression experiments (D). Line-scans were aligned with a similar VM-PM distance (vertical dashed lines). Vacuolar membrane, VM; plasma membrane, PM. Scale bar: 2 μm.
Figure S3
Figure S3
Increased Dgk1 Activity at the INM Modulates PA and DAG Levels, Related to Figures 1 and 3 (A) Cartoon depicts a predicted shift toward the growth branch of lipid metabolism upon Dgk1 overexpression (Henry et al., 2012). For abbreviations of lipid species, see Figure 1A. (B) Live imaging of dgk1Δ cells expressing plasmid-based wild-type Dgk1 or an NLS-Dgk1 construct, both N-terminally tagged with mGFP. The exogenous NLS sequence comprises the NLS of the INM transmembrane protein Heh2 and an adjacent linker (aa 93-317). The transmembrane protein Dgk1 was overexpressed from the inducible GAL1 promoter. Cells were grown exponentially in raffinose-containing media and Dgk1 expression was induced with 2% galactose (final) for 4 hr before imaging. Dgk1 overexpression causes NE proliferation as shown by nuclear deformation and growth of additional NE structures, which are labeled by mGFP-Dgk1 (Han et al., 2008a). White arrowhead shows Dgk1 localization at the peripheral ER. Nucleus, N. Scale bar: 2 μm. (C) Comparison of protein levels of mGFP-tagged Dgk1 constructs when expressed from the GAL1 promoter in dgk1Δ cells. Denaturing extracts were prepared and immunoblotted with an anti-GFP antibody and with an anti-Pgk1 antibody as a loading control. Induced refers to protein expression in the presence of 2% galactose. (D) Immunogold TEM of representative dgk1Δ cells expressing mGFP-tagged Dgk1 or NLS-Dgk1 constructs as in (B). Wild-type Dgk1 is found on both sides of the NE whereas NLS-Dgk1 is enriched on the INM side. Gold particles were false colored in transparent red. Gold particle quantification was performed by counting particles within a 125 nm zone relative to the NE midline (INM and ONM side) or in the nucleoplasm (NP) (> 125 nm from NE midline). Dgk1: 760 gold particles; NLS-Dgk1: 877 particles. n indicates number of analyzed nuclei, error bars indicate standard deviation. Nuclear envelope, NE; inner nuclear membrane, INM; outer nuclear membrane, ONM; nucleus, N; cytoplasm, C; peripheral endoplasmic reticulum, pER; plasma membrane, PM. Scale bar: 0.5 μm. (E) Live imaging of dgk1Δ cells expressing the plasmid-based NLS-PA sensor or NLS-DAG sensor and the indicated mGFP-Dgk1 constructs under the GAL1 promoter. Cells were grown in raffinose containing media and Dgk1 expression was induced by addition of galactose (2% final) for 4 hr before imaging. The uninduced condition recapitulates the DAG and PA distribution seen in wild-type cells (compare with Figures 1C and 1D, right panels). Upon induction of NLS-Dgk1, the PA sensor detects increased PA levels at the INM (left panel), whereas the DAG sensor exhibits a nucleoplasmic location indicating reduced DAG levels (right panel). A catalytically inactive Dgk1 was created by mutating D177 > A, a conserved catalytic residue (Han et al., 2008b). As in wild-type cells this mutant exhibits a mainly nucleoplasmic location of the PA sensor and an INM location of the DAG sensor. Line-scan graphs generated in ImageJ were used to quantify sensor fluorescence intensity across the nucleus. n indicates the number of randomly selected cells, y axis: Arbitrary Fluorescence Units, FU; x axis: distance in μm. Note that overexpression of the catalytically inactive Dgk1 also causes some NE proliferation, which is likely caused by membrane stress, a phenomenon that may also result in NE ‘karmellae’ formation. Nucleus, N; inner nuclear membrane, INM. Scale bar: 2 μm. (F) Live imaging of cells expressing the indicated BiFC constructs. Wild-type Pah1, Pah1 with an exogenous nuclear export signal (NES, Rna1aa316-357) or Pah1 with a mutant NES (mNES) are fused with the Venus fragment VC; Pus1 is fused with the Venus fragment VN. The mNES contained the following mutations L320A, L323A, L326A, I328A, L340A, L342A according to (Feng et al., 1999). Line-scan graphs were used to quantify BiFC signals across multiple nuclei. The same FU value is marked for comparison (horizontal dashed line), n = number of randomly selected cells. Scale bar: 2 μm. (G) Comparison of protein levels of Pah1 constructs fused with the Venus fragment VC. Denaturing extracts were prepared and immunoblotted with an anti-GFP antibody (capable of detecting the Venus fragment VC) and with an anti-Pgk1 antibody as a loading control. (H) Immunogold TEM control sample of wild-type cells expressing mGFP-Cds1, in which the primary antibody was omitted. Sample shows no unspecific staining by the secondary antibody (anti-rabbit IgG coupled with 6 nm gold). The same outcome was observed for the Dgk1 and Pah1 samples analyzed in this study (not shown). Nucleus, N; cytoplasm, C. Scale bar: 1 μm.
Figure 2
Figure 2
Cds1 and Nutrients Regulate Nuclear Lipid Droplet Synthesis at the INM (A) Cartoon depicts a shift toward the storage branch of lipid metabolism (Henry et al., 2012) through Cds1 inactivation (cds1-ts). TAG (triacylglycerol) is stored in lipid droplets, which are metabolized by specific enzymes. MAG, monoacylglycerol; other abbreviations are as in Figure 1A. (B) Live imaging of wild-type or cds1-ts cells expressing the NLS-PA-mCherry sensor grown at the indicated temperatures for 4 hr. BODIPY stains lipid droplets; Nup188-GFP visualizes nuclear pores. Sensor fluorescent intensity was quantified across the nucleus as in Figure 1. The line scan was centered on nuclear lipid droplets (nLD) when present (dashed vertical line). Scale bar, 2 μm. (C) Time course of nLD formation in cds1-ts cells expressing NLS-PA-mCherry sensor. Exponentially growing cells were shifted from 23°C to 37°C and examined at the indicated time points. See also Videos S1 and S2. Scale bar, 2 μm. (D) Quantification of cells with nLDs. Cells were grown for 4 hr at the indicated temperatures. nLDs were defined as spherical structures that stained both with BODIPY and NLS-PA-mCherry sensor. At least 200 cells were counted for each condition. (E) Comparison of nuclear and cytoplasmic lipid droplet diameter in cells grown at the indicated temperatures. Box-whisker plot showing median, interquartile range, and minimum and maximum value. ∗∗∗p value <0.001 determined by ANOVA with post hoc Tukey HSD. (F) Transmission electron microscopy (TEM) of a representative cds1-ts cell after growth at 37°C for 4 hr. An nLD localizes next to the INM. The lumen of the NE is widened in a discrete portion (red arrowhead) and contains electron-dense material (red asterisk). Abbreviations are as before. Scale bar, 0.5 μm. (G) Live imaging of wild-type cells grown in oleic-acid-containing or control media, expressing the NLS-PA-mCherry sensor and stained with BODIPY. Two representative phenotypes of oleic-acid-treated cells are shown. Fluorescent intensity was quantified across the nucleus as in (B). Scale bar, 2 μm. (H) Quantification of NLS-PA sensor localization as observed in (G). n = number of analyzed cells. See also Figure S4 and Videos S1 and S2.
Figure S4
Figure S4
DAG, PA, and Enzymes of Lipid Metabolism Are Enriched on the nLD Surface, Related to Figures 2 and 3 (A) Growth comparison of wild-type and cds1-ts cells at the indicated temperatures. Cells were spotted onto YPD plates in 10-fold serial dilutions and incubated for 2 days at indicated temperatures. (B) Live imaging of cds1-ts cells expressing a plasmid-based NLS-PA sensor mutated in residues critical for PA binding. The mutant sensor fails to recognize PA at the INM or on nuclear lipid droplets. Cells were grown at the indicated temperatures for 4 hours and co-stained with BODIPY to visualize lipid droplets. Line-scans were used to quantify sensor fluorescent intensity across the nucleus. n indicates the number of randomly selected cells, y axis: Arbitrary Fluorescence Units, FU; x axis: distance in μm. For comparison the FU value 1 is marked with a horizontal dashed line. Nuclear lipid droplet, nLD. Scale bar: 2 μm. (C) Automated quantification of lipid droplet size in wild-type cells upon oleic acid treatment. After setting identical fluorescence intensity thresholds, circular BODIPY structures were automatically selected and quantified using ImageJ. Number of analyzed cells is indicated. p value (∗∗∗ < 0.001) was determined by Wilcoxon signed-rank test. (D) Live imaging of cds1-ts cells expressing a plasmid-based NLS-DAG sensor mutated in residues critical for DAG recognition. The DAG pool at the INM and nLDs is no longer recognized as shown by the nucleoplasmic sensor signal. Cells were grown at the indicated temperatures for 4 hours and co-stained with BODIPY to visualize lipid droplets and CellTracker Blue for vacuoles. Line-scans were used to quantify sensor fluorescent intensity across the nucleus. n indicates the number of randomly selected cells, y axis: Arbitrary Fluorescence Units, FU; x axis: distance in μm. For comparison the FU value 1 is marked with a horizontal dashed line. Nuclear lipid droplet, nLD. Scale bar: 2 μm. (E) Live imaging of cds1-ts cells expressing GFP-tagged enzymes previously implicated in cytoplasmic lipid droplet metabolism. Cells co-express a plasmid-based NLS-bearing PA-mCherry sensor to visualize nLDs. Cells were grown for 4 hours at the indicated temperatures. Arrowheads highlight enzymes that co-localize with the PA-rich nLD monolayer. Other GFP-foci or circular structures reflect the association with cytoplasmic LDs. Inset shows magnified views of nLDs. Nuclear lipid droplet, nLD. Scale bar: 2 μm.
Figure 3
Figure 3
Enzymes of Lipid Metabolism Are Targeted to the INM (A) BiFC experiment with cells expressing the indicated enzymes fused with the Venus fragment VC, Nup60, or Pus1 are fused with VN. Empty vectors are used as controls. Fluorescent intensity was quantified across the nucleus as in Figure 1. n = number of randomly selected cells. Scale bar, 2 μm. (B) Immunogold TEM of representative wild-type cells expressing Pah1-mGFP or mGFP-Cds1. Gold particles are false colored in transparent red. Particles were counted within a 125-nm zone relative to the NE midline (INM and ONM side) or in the nucleoplasm (NP) (>125 nm from NE midline). Error bars: SD. n = number of analyzed nuclei. Pah1: 381 gold particles; Cds1: 602 particles. pER, peripheral endoplasmic reticulum; cLD, cytoplasmic lipid droplet; other abbreviations are as before. Scale bar, 1 μm. (C) Live imaging of cds1-ts cells expressing genomically integrated Tgl5-GFP and the plasmid-based NLS-PA-mCherry sensor. Cells were grown for 4 hr at the indicated temperatures. Inset shows magnified nLD; white arrowheads label the nLD surface. Scale bar, 2 μm. (D) Live imaging of cds1-ts cells expressing the NLS-DAG-mCherry sensor and stained with BODIPY for lipid droplets and CellTracker Blue for vacuoles. Cells were grown for 4 hr at the indicated temperatures. Sensor fluorescent intensity was quantified across the nucleus. Measurements from nLD-containing nuclei were aligned by nLD peak intensity (dashed vertical line). n = number of randomly selected cells. Scale bar, 2 μm. (E) Live imaging of cds1-ts cells co-expressing the NLS-DAG-mGFP and NLS-PA-mCherry sensor. Vacuoles were stained with CellTracker Blue. Cells were grown for 4 hr at the indicated temperatures. Scale bar, 2 μm. See also Figures S3 and S4.
Figure 4
Figure 4
Nuclear Lipid Droplets Are Generated Directly from the INM (A) Cartoon of lipid synthesis control by the Ino2/Ino4 transcriptional activator and the Opi1 transcriptional repressor. CDS1 and several other genes involved in phospholipid synthesis (e.g., INO1, CHO1, CHO2, OPI3, PSD1) are controlled by these factors. (B) Live imaging of ino4Δ cells expressing the NLS-PA-mCherry sensor. Lipid droplets are stained with BODIPY. Sensor fluorescent intensity was quantified across the nucleus as in Figure 2B. n = number of randomly selected cells. Scale bar, 2 μm. (C) Quantification of cells with nLDs; 150 wild-type and 400 ino4Δ cells were analyzed. (D) Comparison of nuclear and cytoplasmic lipid droplet diameter in the indicated strain backgrounds. Box-whisker plot showing median, interquartile range, and minimum and maximum value. ∗∗∗p value <0.001 was determined by Wilcoxon signed-rank test. (E–J) Transmission electron microscopy (TEM) and 3D reconstruction of the nuclear envelope in ino4Δ cells. (F) and (G) correspond to the boxed areas in the upper part of (E) and show INM-nLD membrane bridges. (I) shows a magnification of INM evaginations seen on the right side of (E). (H) and (J) are 3D reconstructions of (G) and (I), respectively. The ONM is studded with ribosomes (red spheres). See Video S3 for an animated 3D model. Scale bar, 200 nm (E) or 100 nm for images (F), (G), and (I). See also Figure S5 and Video S3.
Figure S5
Figure S5
Disruption of Ino2/Ino4 Complex Results in nLD Formation, Related to Figure 4 (A) Live imaging of ino2Δ cells expressing the plasmid-based NLS-bearing PA-mCherry sensor. Lipid droplets were co-stained with BODIPY. Line-scan graphs quantify the fluorescent intensity across the nucleus. nLDs were aligned in the middle of the line scan (dashed vertical line). n indicates the number of randomly selected cells, y axis: Arbitrary Fluorescence Units, FU; x axis: distance in μm. For comparison with Figure 2B the FU value 1 is marked with a horizontal dashed line. Nuclear lipid droplet, nLD. Scale bar: 2 μm. (B) TEM analysis of ino2Δ cells reveals ultrastructure of a nuclear lipid droplet (nLD) and INM evaginations (asterisks). Nucleus, N. Scale bar: 1 μm. (C and D) TEM analysis of representative examples of ino4Δ cells. Note that multiple perinuclear zones with INM evaginations/cavities can occur (red asterisks). Membrane bridges that connect nLDs to the INM are indicated with red arrowheads. Nuclear lipid droplet, nLD; nucleus, N; vacuole, V. White arrowhead - spindle pole body. Scale bar: 1 μm.
Figure 5
Figure 5
Seipin Regulates Formation of INM-nLD Membrane Bridges (A) Live imaging of representative cells expressing the indicated BiFC constructs. Empty vector co-expressed with Sei1-VC is used as a control. Scale bar, 2 μm. (B) Live imaging of cds1-ts cells expressing the NLS-PA-mCherry sensor and BiFC constructs. Cells were grown for 4 hr at the indicated temperatures. Scale bar, 2 μm. (C) Representative TEM images of ino4Δ cells and sei1Δ ino4Δ cells. An nLD is connected to the INM via numerous membrane bridges (red arrowheads) in the ino4Δ cell, which are absent in the sei1Δ ino4Δ mutant. Scale bar, 1 μm. (D) INM evaginations in the periplasmic space have highly irregular shapes and sizes (red asterisks) in sei1Δ ino4Δ cells (compare with Figure 4I). Scale bar, 1 μm. See also Figure S6.
Figure S6
Figure S6
Seipin Regulates Formation of INM-nLD Membrane Bridges and Architecture of the Perinuclear Space, Related to Figure 5 (A) TEM analysis of sei1Δ ino4Δ cells. nLDs were found to adhere tightly to the INM. Irregular periplasmic spaces are indicated (red asterisk). Nuclear lipid droplet, nLD; nucleus, N; peripheral endoplasmic reticulum, pER. Scale bar: 1 μm. (B) Representative examples of periplasmic space abnormalities in sei1Δ ino4Δ cells. These can range from heterogeneously sized evaginations to large flat cavities (both marked with red asterisks). Cytoplasmic lipid droplet, cLD; nucleus, N. Scale bar: 1 μm. (C) TEM analysis of sei1Δ ino4Δ cells. cLDs also adhere to the ONM and/or pER. Clusters of small, aggregated LDs are indicated (black asterisks). Cytoplasmic lipid droplet, cLD; nucleus, N; peripheral endoplasmic reticulum, pER. Scale bar: 1 μm.
Figure S7
Figure S7
NE Growth Is Linked to an Increase of Phosphatidic Acid at the INM, Related to Figure 1, 6, 7, and Discussion (A) Live imaging of pah1Δ cells expressing the indicated plasmid-based PA-mCherry sensors and the genomically integrated nucleoplasmic marker Pus1-GFP. PAH1 deletion induces nuclear membrane proliferation and nuclear expansion, which can lead to the engulfment of cytoplasmic material (marked by asterisk) as shown by the absence of Pus1 staining and earlier studies (Santos-Rosa et al., 2005). Line-scans were generated across the whole cell (left) or the nucleus (right). n indicates the number of randomly selected cells, y axis: Arbitrary Fluorescence Units, FU; x axis: distance in μm. For comparison the FU value 1 is marked with a horizontal dashed line. Plasma membrane, PM; nucleus, N; inner nuclear membrane, INM. Scale bar: 2 μm. (B) Live imaging of the indicated DAG sensors in pah1Δ cells. DAG sensor-reactive material (diamond), which often overlapped with the vacuole and may represent aberrant membrane structures, is frequently seen in pah1Δ cells. Vacuoles are stained with CellTracker Blue. Line-scans were generated across the vacuole (left) or the nucleus (right). Inner nuclear membrane, INM; nucleus, N. Asterisk indicates NE expansion. Scale bar: 2 μm. (C) Sensor protein levels were analyzed in wild-type and pah1Δ cells. Denaturing extracts were prepared and immunoblotted with an anti-mCherry antibody directed against the sensors and with an anti-Pgk1 antibody as a loading control. Sensor expression was reduced in the pah1Δ mutant. Asterisk indicates degradation product. (D) Schematic localization of major PA and DAG pools in pah1Δ cells as detected by lipid biosensors. Asterisk marks NE expansion. DAG-positive structures of unknown origin overlap with vacuoles. Inner nuclear membrane, INM; outer nuclear membrane, ONM; nucleus, N; endoplasmic reticulum, ER; plasma membrane, PM; vacuole, V. (E) Automated quantification of lipid droplet size in cds1-ts cells grown at 23°C or 37°C for 4 hours. After setting identical fluorescence intensity thresholds, circular BODIPY structures were automatically selected and quantified in ImageJ. Number of analyzed cells is indicated. p value (∗∗∗ < 0.001) was determined by Wilcoxon signed-rank test. (F) Live imaging of wild-type cells expressing genomically integrated Opi1-mCherry and plasmid-based Pus1-BFP. Lipid droplets are stained with BODIPY. The subcellular distribution of genomically expressed Opi1 is indistinguishable from plasmid-based Opi1. Opi1 interacts with the ER-protein Scs2 and labels mostly the NE. Line-scans quantify the fluorescent intensity across the nucleus. n indicates the number of randomly selected cells, y axis: Arbitrary Fluorescence Units, FU; x axis: distance in μm. The FU value 0.2 is marked with a horizontal dashed line. Nuclear envelope, NE. Scale bar: 2 μm. (G) Protein levels of the indicated plasmid-based Opi1-mCherry constructs expressed from different promoters in opi1Δ scs2Δ cells. Opi1 is expressed at similar levels from its genomic locus or from a plasmid harboring the endogenous OPI1 promoter. Denaturing extracts were prepared and immunoblotted with an anti-mCherry antibody for Opi1 and with an anti-Pgk1 antibody as a loading control. (H) Characterization of fast-growing genetic suppressors, which emerged in the opi1 Q2 mutant when expressed from the endogenous OPI1 promoter (lane 2, -Ino, Figure 7D) or the stronger GPD promoter (lane 4, -Ino, Figure 7D). Individual colonies were picked from the plate and analyzed by fluorescent microscopy. Suppression of the growth defect likely stems from acquired mutations that abolish Opi1-mCherry expression as shown by the lack of mCherry fluorescence. Scale bar: 2 μm. (I) Automated quantification of lipid droplet size in (H) shows that suppression of the Opi1 Q2 mutant growth defect correlates with a reduction of cellular LD size. Suppressor colonies were compared to the respective Opi1 Q2 mutants shown in Figure 7B and an empty vector control. After setting identical fluorescence intensity thresholds for all experiments, circular BODIPY structures were automatically selected and quantified in ImageJ. Number of analyzed cells is indicated.
Figure 6
Figure 6
Coordinated Production and Size Control of Nuclear and Cytoplasmic Lipid Droplets (A) TEM analysis of an ino4Δ cell shows an nLD and a cLD. Inset shows magnified view of the boxed area with cLD connections to both ONM and pER. Multiple membrane contacts (red arrowheads) between the cLD and ONM are apparent. INM evaginations are labeled with red asterisk. Scale bar, 0.5 μm. (B) Live imaging of cds1-ts cells expressing Opi1-mCherry and the nucleoplasmic marker Pus1-BFP. Lipid droplets are stained with BODIPY. Cells were grown for 4 hr at the indicated temperatures. Scale bar, 2 μm. (C) Live imaging of Opi1-mCherry expressed in opi1Δ cells. Lipid droplets were stained with BODIPY. Cells were grown in oleic-acid-containing or control media. Scale bar, 2 μm. (D) Live imaging of cds1-ts cells expressing the PA-mCherry sensor. Lipid droplets were stained with BODIPY. Cells were grown for 4 hr at the indicated temperatures. Scale bar, 2 μm. (E) Live imaging of cds1-ts cells expressing the DAG-mCherry sensor. Lipid droplets were stained with BODIPY, vacuoles with CellTracker Blue. Cells were grown for 4 hr at the indicated temperatures. Note that upon Cds1 inhibition the sensor also uncovered a DAG pool at the plasma membrane (PM). VM, vacuolar membrane. Scale bar, 2 μm. See also Figure S7.
Figure 7
Figure 7
The Transcription Factor Opi1 Regulates Nuclear and Cytoplasmic Lipid Droplet Production (A) Cartoon of Opi1 domain organization and tethering to the endoplasmic reticulum (ER) and outer nuclear membrane (ONM) via its PA-sensing Q2 domain and the transmembrane protein Scs2. Opi1 contains an endogenous NLS, which partially overlaps with the Q2 domain (not depicted). FFAT, two phenylalanines (F) in an acidic tract motif; AID, activator interaction domain. (B) Live imaging of opi1Δ scs2Δ cells expressing the indicated plasmid-based Opi1-mCherry constructs or an empty vector. Lipid droplets were stained with BODIPY, the nucleoplasm with Pus1-BFP. Opi1 was either expressed from its endogenous promoter or overexpressed from the heterologous GPD (TDH3) promoter. Q2mut indicates a mutation in the PA-binding domain, which reduces but does not abolish PA binding. For expression levels, see Figure S7G. Scale bar, 2 μm. (C) Automated quantification of lipid droplet size in (B). n = number of analyzed cells. ∗∗∗p value <0.001 was determined by ANOVA with post hoc Tukey HSD. (D) Growth analysis of opi1Δ scs2Δ cells expressing different plasmid-based constructs of Opi1-mCherry as in (B). Growth was followed on SDC-Ura-His and SDC-Ura-His-Inositol (-Ino) plates for 2 days at 30°C. Note that several fast-growing suppressor colonies emerged in the opi1 Q2 mutant when expressed from the endogenous OPI1 promoter (lane 2, -Ino) or the stronger GPD promoter (lane 4, -Ino). These genetic suppressors rescue the growth defect by abolishing Opi1 expression; see Figures S7H and S7I. (E) Model of nLD synthesis. At times of low nLD synthesis, cLD formation may predominate. This situation is favored by low PA levels at the INM due to turnover into DAG by Pah1 and/or CDP-DAG (not depicted) by Cds1. Expression of enzymes involved in cellular lipid biosynthesis is high due to the tethering of Opi to the ER. In contrast, nLD formation is stimulated by Opi1 translocation into the nucleus and repression of target genes (lipid synthesis OFF), a state that also induces cLD production. PA levels at the INM are increased, and PA and DAG become enriched on INM-tethered nLDs. Cds1 inactivation is a putative switch to channel PA into the storage branch of lipid metabolism. Opi1 partitioning on cLDs and nLDs constitutes a negative feedback mechanism for lipid droplet production. See also Figure S7.

Comment in

  • Lipid droplets from the inside.
    Baumann K. Baumann K. Nat Rev Mol Cell Biol. 2018 Aug;19(8):486-487. doi: 10.1038/s41580-018-0037-7. Nat Rev Mol Cell Biol. 2018. PMID: 29959402 No abstract available.
  • The Inner Nuclear Membrane Takes On Lipid Metabolism.
    Merta H, Bahmanyar S. Merta H, et al. Dev Cell. 2018 Nov 19;47(4):397-399. doi: 10.1016/j.devcel.2018.11.005. Dev Cell. 2018. PMID: 30458132
  • MUW researcher of the month.
    [No authors listed] [No authors listed] Wien Klin Wochenschr. 2019 Oct;131(19-20):532-533. doi: 10.1007/s00508-019-01563-2. Wien Klin Wochenschr. 2019. PMID: 31620880 No abstract available.

Similar articles

Cited by

References

    1. Adeyo O., Horn P.J., Lee S., Binns D.D., Chandrahas A., Chapman K.D., Goodman J.M. The yeast lipin orthologue Pah1p is important for biogenesis of lipid droplets. J. Cell Biol. 2011;192:1043–1055. - PMC - PubMed
    1. Barbosa A.D., Sembongi H., Su W.M., Abreu S., Reggiori F., Carman G.M., Siniossoglou S. Lipid partitioning at the nuclear envelope controls membrane biogenesis. Mol. Biol. Cell. 2015;26:3641–3657. - PMC - PubMed
    1. Carman G.M., Han G.S. Regulation of phospholipid synthesis in the yeast Saccharomyces cerevisiae. Annu. Rev. Biochem. 2011;80:859–883. - PMC - PubMed
    1. Cartwright B.R., Binns D.D., Hilton C.L., Han S., Gao Q., Goodman J.M. Seipin performs dissectible functions in promoting lipid droplet biogenesis and regulating droplet morphology. Mol. Biol. Cell. 2015;26:726–739. - PMC - PubMed
    1. Chae M., Han G.S., Carman G.M. The Saccharomyces cerevisiae actin patch protein App1p is a phosphatidate phosphatase enzyme. J. Biol. Chem. 2012;287:40186–40196. - PMC - PubMed

Publication types