. 2018 Jul 25;99(2):362-375.e4.
doi: 10.1016/j.neuron.2018.06.012. Epub 2018 Jun 21.

Vascular Compartmentalization of Functional Hyperemia from the Synapse to the Pia

Affiliations

Vascular Compartmentalization of Functional Hyperemia from the Synapse to the Pia

Ravi L Rungta et al. Neuron. .

Erratum in

Abstract

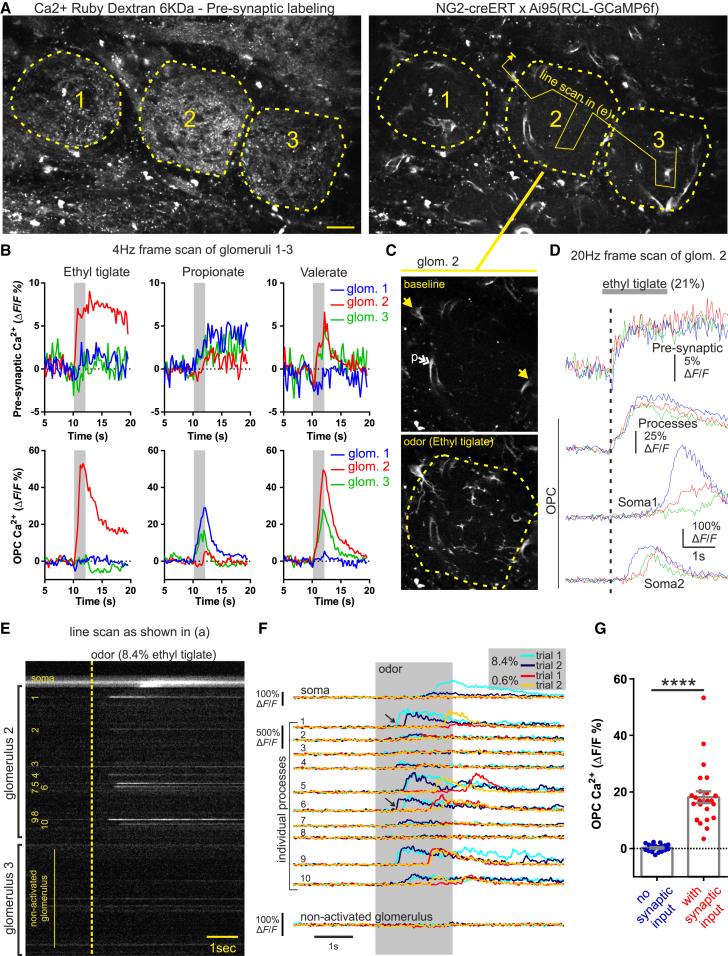
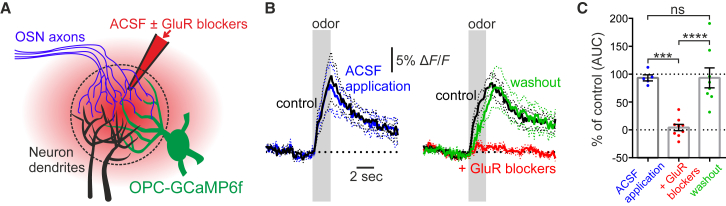
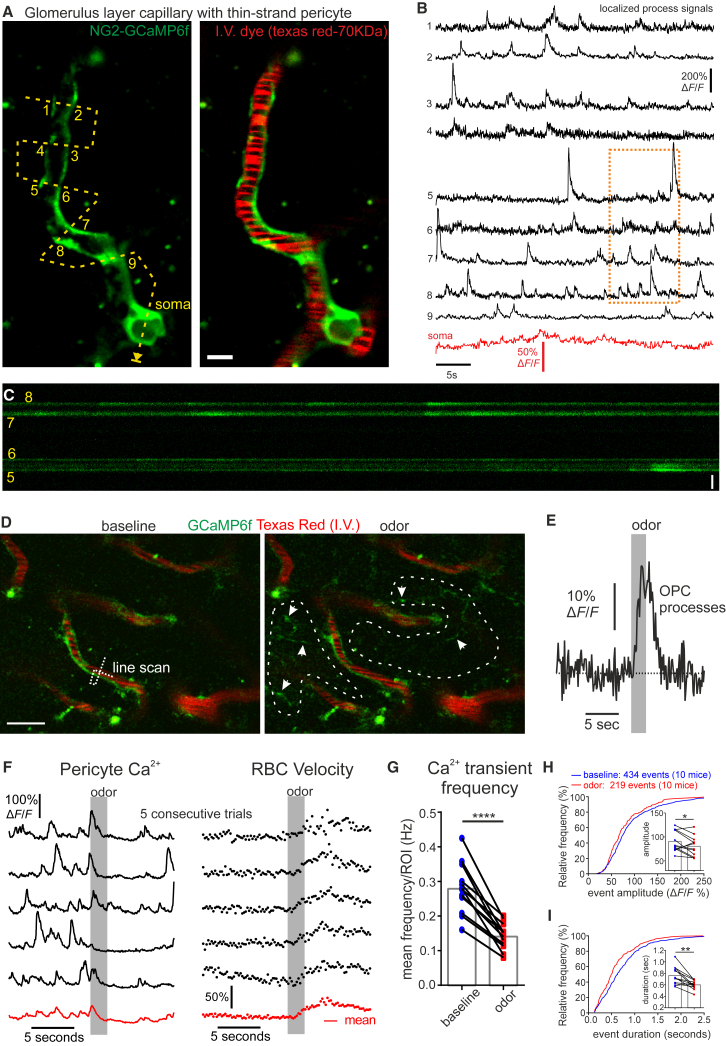
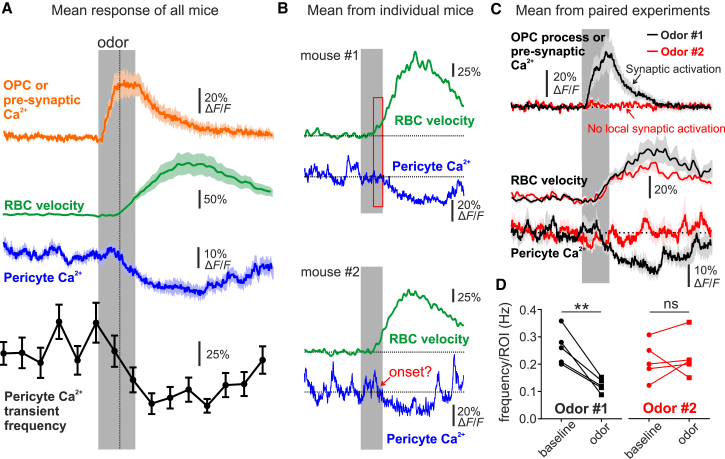
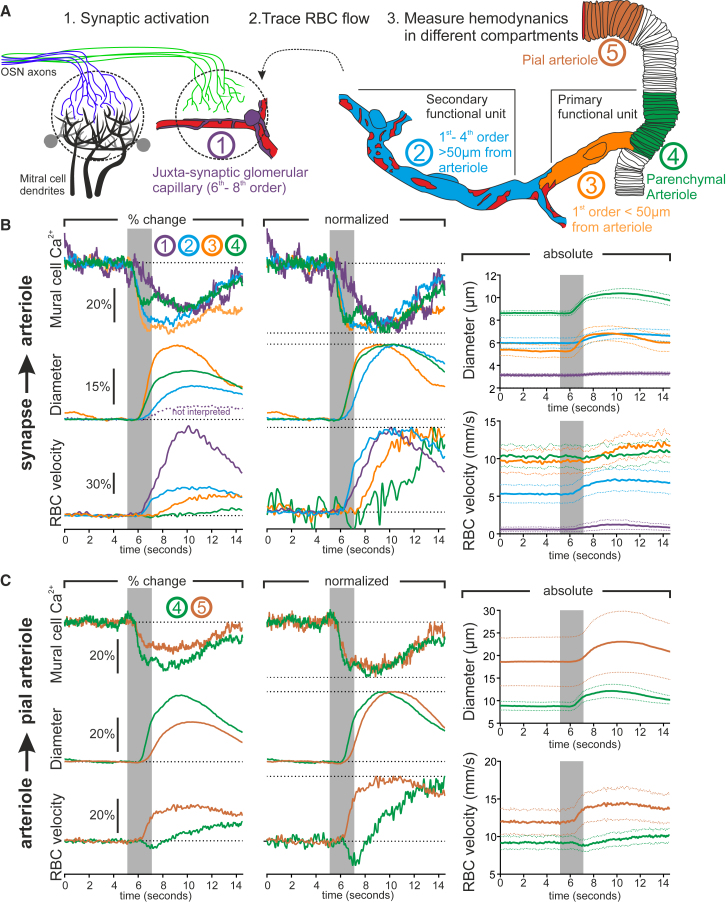
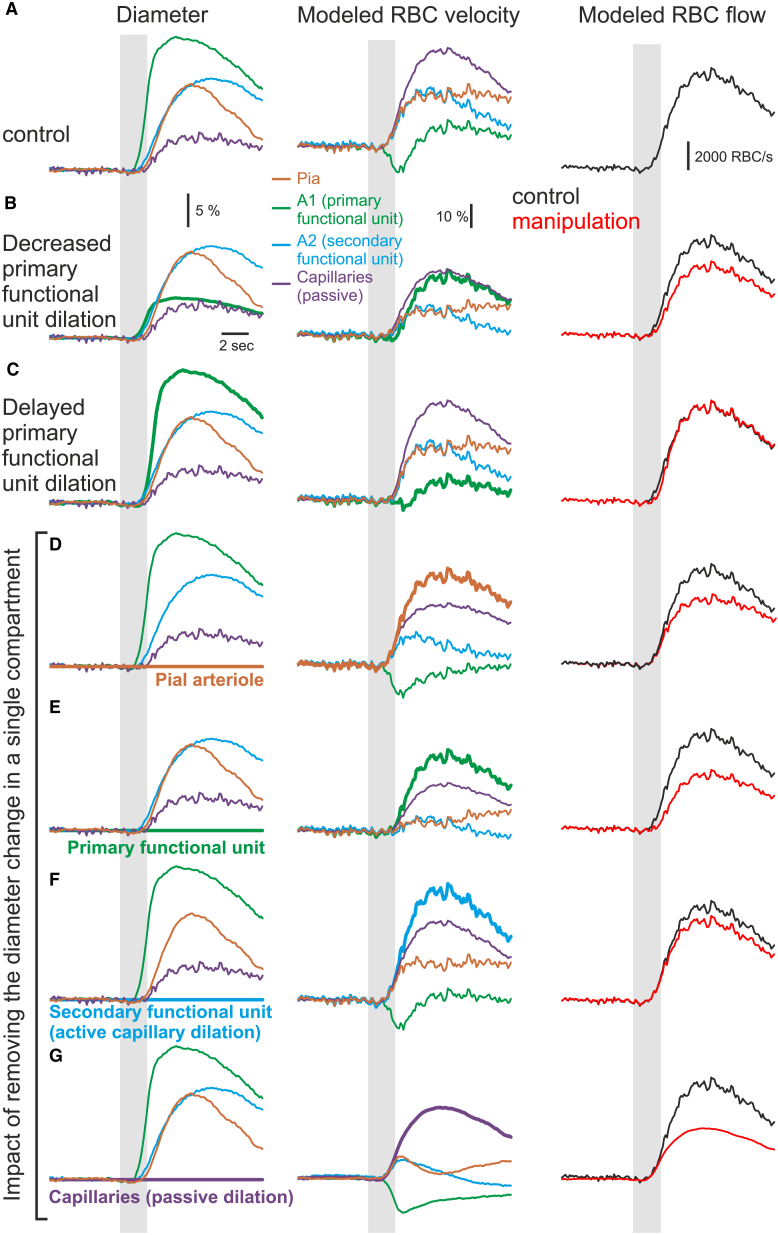
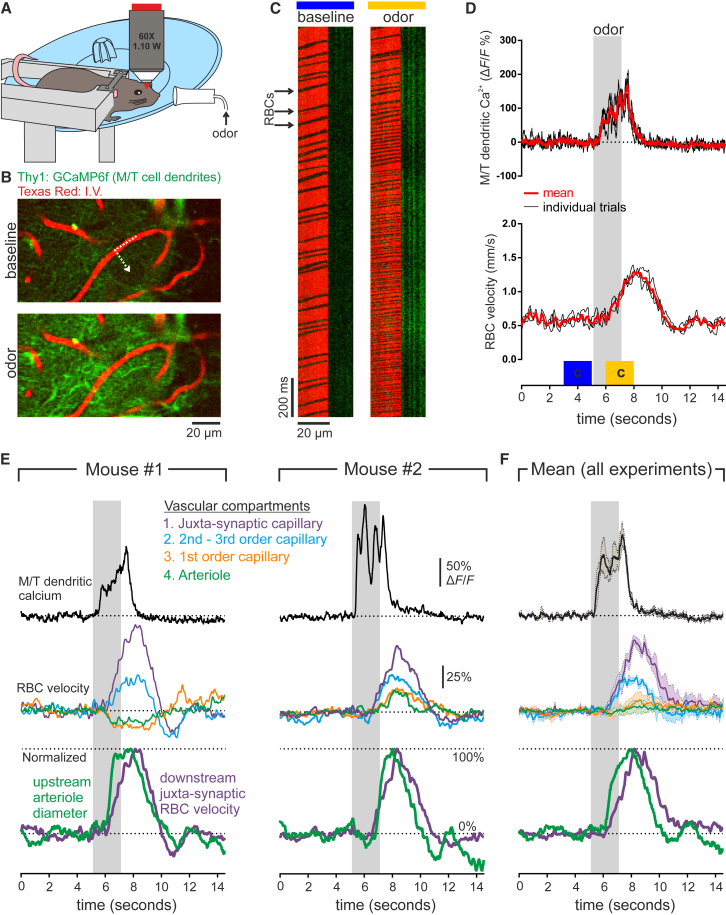
Functional hyperemia, a regional increase of blood flow triggered by local neural activation, is used to map brain activity in health and disease. However, the spatial-temporal dynamics of functional hyperemia remain unclear. Two-photon imaging of the entire vascular arbor in NG2-creERT2;GCaMP6f mice shows that local synaptic activation, measured via oligodendrocyte precursor cell (OPC) Ca2+ signaling, generates a synchronous Ca2+ drop in pericytes and smooth muscle cells (SMCs) enwrapping all upstream vessels feeding the activated synapses. Surprisingly, the onset timing, direction, and amplitude of vessel diameter and blood velocity changes vary dramatically from juxta-synaptic capillaries back to the pial arteriole. These results establish a precise spatial-temporal sequence of vascular changes triggered by neural activity and essential for the interpretation of blood-flow-based imaging techniques such as BOLD-fMRI.

Keywords: CBF; anesthetized; astrocyte; awake; blood-brain barrier; calcium; endothelium; functional imaging; gap junction; glia; glutamate; hyperpolarization; in vivo; microvascular; neuron; neurovascular coupling; neurovascular unit; odor.


Figures

Figure 1
Figure 1
OPC Process Ca2+ Elevations Are Rapid and Reliable Markers of Glomerular Synaptic Activation (A) Image of three glomeruli with OSN terminals loaded with Ca2+ Ruby Dextran-6KDa (left) and OPCs and pericytes expressing GCaMP6f under control of the NG2 promoter (right). Dashed lines outline individual glomeruli (1–3), and the solid line arrow indicates path of broken line scan in (E) and (F). Scale bar, 25 μm. (B) Pre-synaptic OSN terminal (top) and OPC process (bottom) responses in glomeruli 1–3 (imaged simultaneously as shown in A) show matching odor selectivity of pre-synaptic and OPC process Ca2+ signals within individual glomeruli. (C) Image of glomerulus #2 shows GCaMP6f signal at baseline (top) and following inhalation of ethyl tiglate (bottom). Single yellow arrows indicate location of periglomerular OPC somata, and the double white arrow indicates pericytes processes (p). (D) Acquisition at higher temporal resolution shows that the onset of the OPC process Ca2+ signal occurs rapidly in response to OSN activation; the signal represents the average response within the entire glomerulus, outlined by the dashed line in (C). Bottom two traces show that odor also triggers Ca2+ increases in the periglomerular OPC somas that are delayed by several hundred milliseconds. (E) Line scan acquisition, as drawn in (A) through glomeruli 2 and 3, shows that ethyl tiglate triggers variable Ca2+ increases in individual OPC processes and somata from glomerulus 2. Dashed yellow line indicates onset of 2 s odor delivery. (F) Analysis reveals that responses of individual OPC processes vary from trial to trial (see black arrows) for a given odor stimulation intensity and that the onset and amplitude of the GCaMP6f signals in different processes show variability and are more delayed at lower concentration. The soma signal is dependent on the stimulation intensity. (G) Summarized data show matching selectivity of pre-synaptic Ca2+ and OPC Ca2+ in 14 glomeruli from 8 mice. Data represent mean ± SEM. See Figures S1 and S2 and Video S1.
Figure 2
Figure 2
OPC Process Ca2+ Elevations Require Glutamate Release (A) Schematic: control ACSF or ACSF containing GluR blockers (D-APV, 500 μM; NBQX, 300 μM; MPEP, 250 μM; CPCCOEt, 500 μM; LY341495, 100 μM) was locally injected in a glomerulus of acutely prepared mice in combination with Texas red to visualize successful injection of solution. (B and C) Summarized data showing that injection of ACSF had no effect on the OPC Ca2+ signal (B, left), whereas injection of GluR blockers reversibly inhibited the OPC Ca2+ elevation (B, right). (B) Time course: gray bars indicate time of odor application. Left: n = 5 glomeruli from 3 mice; right, n = 9 glomeruli from 6 mice (washout, n = 8). (C) Histogram showing analysis of the area under the curve (AUC) in percentage of the control value. Data represent mean (B, solid lines; C, boxes) ± SEM (B, dashed lines; C, error bars).
Figure 3
Figure 3
Thin-Strand Glomerulus Pericytes Sense Synaptic Activity via Decreases in Microdomain Ca2+ Transients (A) Single z plane image shows GCaMP6f fluorescence (green) of a glomerulus layer thin-strand capillary pericyte (branch order 7). Dashed line indicates path of broken line scan with ROIs numbered (1–9). Scale bar, 5 μm. (B) ΔF/F measurements of spontaneous activity in different ROIs show frequent calcium transients that are mostly independent of signals in other ROIs and the soma. (C) Portion of total line scan shown in (A) (ROIs 5–8, 10 s). Scale bar, 5 μm. (D) Left: image shows longitudinal processes of glomerular pericytes expressing GCaMP6f along capillaries labeled with Texas red dextran (70 kDa). The broken line indicates the process and capillary simultaneously monitored in (F). Right: upon odor inhalation, Ca2+ rises in OPC processes, which appear in the glomerular neuropil (see arrows). (E) The single trial OPC Ca2+ response, measured within the ROIs outlined (dashed white line) in (D), is taken as a marker of neuronal activation. (F) Left: activation of the glomerulus is followed by a decrease in the frequency of pericyte process Ca2+ transients and the steady-state Ca2+ concentration (average of two ROIs crossing the pericyte process). Right: RBC velocity increases in the capillary. Black traces show individual trials, and the red trace shows mean of five trials. Note: the apparent increase in Ca2+ that occurs prior to the decrease is due to the high frequency of spontaneous events as it begins to rise before the onset of the odor stimulation and is not apparent in the average across mice shown in Figure 4. (G) Summarized plots of pericyte process Ca2+ transient frequency 5 s before and after the onset of the odor stimulation. (H and I) Cumulative frequency histograms and mean values (insets) of pericyte process Ca2+ transient amplitude (H) and duration (I) 5 s before and after the onset of the odor stimulation. Data represent mean ± SEM. See Figures 4, S3, S4, and S5 and Videos S2 and S3.
Figure 4
Figure 4
Decreases in Thin-Strand Pericyte Ca2+ Require Local Synaptic Activation (A) Summarized traces (all mice). The vertical dashed line serves as a visual cue to indicate a similar onset between the mean pericyte Ca2+ decrease and RBC velocity increase. n = 12 glomerulus pericytes from 12 mice (including data from 5 glomeruli shown in C and D). (B) Mean responses of pericyte Ca2+ and RBC velocity from two different mice. These two individual cases illustrate that RBC velocity can increase before the onset of the pericyte Ca2+ decrease or that this onset can be masked by spontaneous Ca2+ activity. Red box indicates estimated onset of the signals. (C) Responses of synaptic input (either pre-synaptic Ca2+ or OPC process Ca2+), RBC velocity, and longitudinal pericyte process Ca2+ to two different odors: one that locally activates neurons and one that does not. The odor (in red) that does not activate neurons does not affect steady-state Ca2+ or transients in pericytes; however, it increases the capillary RBC velocity, suggesting that RBC flow to the juxta-synaptic capillary is regulated at an upstream location. (D) Summary graph of the role of local neuronal activation (odors #1 and #2) on pericyte Ca2+ transients, paired experiments from five mice. Data in (A) and (C) represent mean ± SEM. See Figures 3, S4, and S5 and Videos S2 and S3.
Figure 5
Figure 5
The Timing of Functional Hyperemia from the Synapse to the Pia (A) Schematic of experimental design. First, glomerular capillaries with thin-strand-type pericytes are imaged adjacent to recorded synaptic activation. Second, the direction of blood flow is traced backward to the upstream arteriole. Third, vessel diameter and RBC velocity are measured in different vascular compartments. (B) Paired recordings displaying the average timing of the decrease in mural cell Ca2+ (top), vessel diameter (middle), and RBC velocity in different vascular compartments upstream of the juxta-synaptic capillary. Dashed purple line indicates the quantified fluorescent lumen diameter in glomerulus capillaries, which was not interpreted. Left: mean responses; middle; normalized data; right: absolute values (4 vascular networks, 3 mice). (C) Paired recordings displaying the average timing of the decrease in SMC Ca2+ (top), vessel diameter (middle), and RBC velocity in a parenchymal arteriole (100–230 μm deep) compared to its upstream feeding pial vessel. Left: mean responses; middle: normalized data; right: absolute values (5 vessel pairs, 3 mice). See Figures S6 and S7 and Video S4.
Figure 6
Figure 6
Modeling Compartmentalized RBC Velocity Dynamics in Response to Vessel Diameter (A–G) Left: diameter changes (normalized) in response to odor stimulation in pia (pial arteriole, brown), A1 (primary functional unit, green), A2 (secondary functional unit, blue), and capillaries (small passively dilating capillaries, purple). Middle: modeled velocity in response to the experimental diameter response. Right: modeled blood flow in the same conditions (red: response to diameter changes from the left panel, black: control conditions from A). (A) Median paired experimental response to odor stimulation. (B) Same as (A) except that the A1 diameter change was decreased by 70%. (C) Same as (A) except that the A1 diameter was delayed to match onset of other compartments (D–G) Same as (A) except that the diameter change is abolished in either the pial arteriole (D), the primary functional unit (E), the secondary functional unit (F), or the passively dilating capillaries (G), while the diameter change in the other three compartments was not modified. This diameter change abolition in a given compartment increases the velocity response in the same compartment as long as it actively dilates upon odor. In contrast, in the passive glomerular capillary compartment, the velocity response is smaller than control when the diameter remains constant (i.e., the compartment resistance remains constant and, therefore, the blood flow change is significantly smaller). Note that the decrease in noise is caused by the absence of fluctuations in the capillary diameter response. Gray bars indicate timing of odor application.
Figure 7
Figure 7
Compartmentalized Hemodynamics in Awake Mice (A) Schematic of the experimental setup: head-fixed mouse on running wheel was trained to stay still during odor application while imaging olfactory bulb via a chronic cranial window. (B) Glomerular activation was first mapped by recording Ca2+ elevations in the mitral and tufted cell dendritic tufts of Thy1:GCaMP6f mice. (C) Example images from the broken line scan through the capillary and into the neuropil show that odor evokes an increase in M/T cell Ca2+ (green) and an increase in RBC velocity (shadows in the red channel). (D) Quantification of experiment illustrated in (B) and (C) showing three consecutive trials evoking reproducible neuronal and RBC velocity responses. Blue and yellow blocks indicate time period shown in (C). (E and F) Hemodynamics in different vascular compartments in response to downstream synaptic activation. Top: M/T dendritic Ca2+ shows glomerular activation; middle: RBC velocity changes in different vascular compartments; bottom: normalized values of arteriole diameter and RBC velocity changes in the downstream juxta-synaptic capillary. (E) Recordings from individual mice show an example in which velocity decreases in the primary functional unit (arteriole and first-order capillary) but increases rapidly in all downstream capillaries (left) and an example in which the primary functional unit shows a delayed increase in velocity (right). (F) Mean of all experiments (4 olfactory bulbs from 3 mice). Data represent mean (solid line) ± SEM (dotted line).

Comment in

References

    1. Attwell D., Mishra A., Hall C.N., O’Farrell F.M., Dalkara T. What is a pericyte? J. Cereb. Blood Flow Metab. 2016;36:451–455. - PMC - PubMed
    1. Autio J., Kawaguchi H., Saito S., Aoki I., Obata T., Masamoto K., Kanno I. Spatial frequency-based analysis of mean red blood cell speed in single microvessels: investigation of microvascular perfusion in rat cerebral cortex. PLoS ONE. 2011;6:e24056. - PMC - PubMed
    1. Bergles D.E., Roberts J.D., Somogyi P., Jahr C.E. Glutamatergic synapses on oligodendrocyte precursor cells in the hippocampus. Nature. 2000;405:187–191. - PubMed
    1. Biesecker K.R., Srienc A.I., Shimoda A.M., Agarwal A., Bergles D.E., Kofuji P., Newman E.A. Glial cell calcium signaling mediates capillary regulation of blood flow in the retina. J. Neurosci. 2016;36:9435–9445. - PMC - PubMed
    1. Blinder P., Tsai P.S., Kaufhold J.P., Knutsen P.M., Suhl H., Kleinfeld D. The cortical angiome: an interconnected vascular network with noncolumnar patterns of blood flow. Nat. Neurosci. 2013;16:889–897. - PMC - PubMed

Publication types

LinkOut - more resources