. 2018 Jul 11;99(1):98-116.e7.
doi: 10.1016/j.neuron.2018.06.002. Epub 2018 Jun 21.

Layer I Interneurons Sharpen Sensory Maps during Neonatal Development

Affiliations

Layer I Interneurons Sharpen Sensory Maps during Neonatal Development

Alicia Che et al. Neuron. .

Abstract

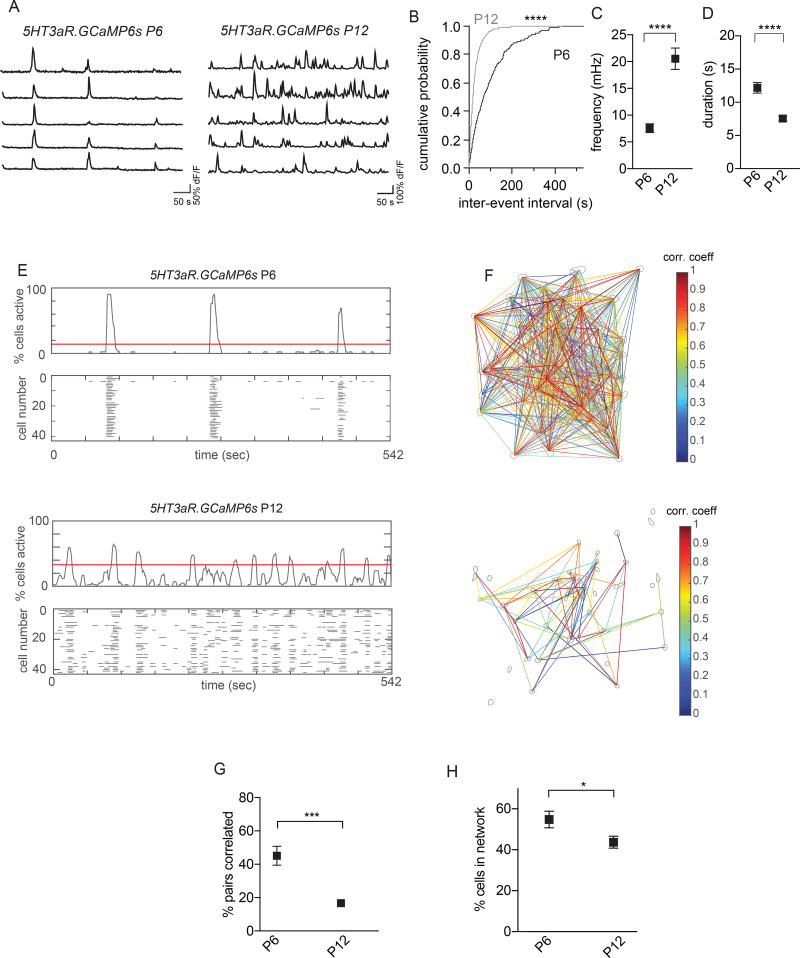
The neonatal mammal faces an array of sensory stimuli when diverse neuronal types have yet to form sensory maps. How these inputs interact with intrinsic neuronal activity to facilitate circuit assembly is not well understood. By using longitudinal calcium imaging in unanesthetized mouse pups, we show that layer I (LI) interneurons, delineated by co-expression of the 5HT3a serotonin receptor (5HT3aR) and reelin (Re), display spontaneous calcium transients with the highest degree of synchrony among cell types present in the superficial barrel cortex at postnatal day 6 (P6). 5HT3aR Re interneurons are activated by whisker stimulation during this period, and sensory deprivation induces decorrelation of their activity. Moreover, attenuation of thalamic inputs through knockdown of NMDA receptors (NMDARs) in these interneurons results in expansion of whisker responses, aberrant barrel map formation, and deficits in whisker-dependent behavior. These results indicate that recruitment of specific interneuron types during development is critical for adult somatosensory function. VIDEO ABSTRACT.

Keywords: barrel cortex; calcium imaging; development; interneuron; layer I; spontaneous activity; thalamocortical connectivity.


Conflict of interest statement

Declaration of Interests: The authors declare no competing interests.

Figures

Figure 1
Figure 1. Cell Type-specific Network Dynamics in the Developing Mouse Somatosensory Cortex in Vivo
(A) Schematic representation of the imaging setup and cranial window location. Dextran staining (red) indicates the location of the cranial window. Scale bar: 500 µm. (B) Schematic representation of the timeline for imaging sessions. (C) Representative raw ΔF/F traces for different neuronal types. (D) Representative images averaged from 500 frames in a single movie and corresponding rastergrams for detected calcium events in 5HT3aR.GCaMP6s, VIP.GCaMP6s, Lhx6.GCaMP6s and Emx1.GCaMP6s mice. Movies were taken at 50 µm, 140 µm, 130 µm and 150 µm from the pial surface, respectively (Also see Figure S2A). Each horizontal line in the rastergram represents a calcium event from onset to offset. Scale bar: 100 µm. (E) Average event frequency in 5HT3aR.GCaMP6s (n = 14 movies, 5 mice); VIP.GCaMP6s (n = 14 movies, 4 mice); Lhx6.GCaMP6s (n = 6 movies, 3 mice); Emx1.GCaMP6s (n = 10 movies, 3 mice) mice. Event frequency was measured for each cell and averaged for all cells in a movie. One-way ANOVA (p = 0.0012) followed by Tukey’s multiple comparisons test comparing between two genotypes; 5HT3aR.GCaMP6s vs. Emx1.GCaMP6s: p = 0.0057; VIP.GCaMP6s vs. Emx1.GCaMP6s: p = 0.0033. (F) Average event duration. One-way ANOVA (p = 0.001) followed by Tukey’s multiple comparisons test; 5HT3aR.GCaMP6s vs. VIP.GCaMP6s: p = 0.019; 5HT3aR.GCaMP6s vs. Lhx6.GCaMP6s: p = 0.0043; 5HT3aR.GCaMP6s vs. Emx1.GCaMP6s: p = 0.0055. (G) Percentage of neuronal pairs that exhibit significantly correlated activity as determined by Monte Carlo simulation of the number of all possible pairs. Kruskall-Wallis test (p < 0.0001) followed by Dunn’s multiple comparisons test comparing between two genotypes; 5HT3aR.GCaMP6s vs. VIP.GCaMP6s: p = 0.0001; 5HT3aR.GCaMP6s vs. Lhx6.GCaMP6s: p = 0.0016; 5HT3aR.GCaMP6s vs. Emx1.GCaMP6s: p = 0.0089. (H) Average percentage of active neurons during network events. One-way ANOVA (p = 0.0004) followed by Tukey’s multiple comparisons test; 5HT3aR.GCaMP6s vs. VIP.GCaMP6s: p = 0.0002; 5HT3aR.GCaMP6s vs. Lhx6.GCaMP6s: p = 0.066; 5HT3aR.GCaMP6s vs. Emx1.GCaMP6s: p = 0.026. (I) Average correlation coefficients of all cell pairs plotted against their binned distance in recordings from Emx1.GCaMP6s (red) and 5HT3aR.GCaMP6s (black). Preferred model compared by the extra-sum-of-squares F test, 5HT3aR.GCaMP6s: straight line (p > 0.99), Emx1.GCaMP6s: exponential decay (p < 0.001). 5HT3aR.GCaMP6s: n = 14 movies, 5 mice, Emx1.GCaMP6s: n = 10 movies, 3 mice. ns: p > 0.05, *p < 0.05, **p < 0.01, ***p < 0.005. Error bars indicate s. e. m. See also Figure S1, S2, S3 and S4; Movie S1 and S2.
Figure 2
Figure 2. Developmental Desynchronization of Spontaneous Activity in 5HT3aR Re Interneurons
(A) Raw ΔF/F traces of five 5HT3aR.GCaMP6s neurons from P6 and P12 movies. (B) Cumulative probability plot of inter-event interval from all calcium events. Kolmogorov-Smirnov test, p < 0.0001. (C) Mean event frequency in 5HT3aR.GCaMP6s neurons at P6 (n = 14 movies, 5 mice) and P12 (n = 11 movies, 3 mice). Unpaired t-test, p < 0.0001. (D) Mean event duration per neuron in 5HT3aR.GCaMP6s neurons at P6 and P12. Unpaired t-test, p < 0.0001. (E) Representative histograms of the percentage of active interneurons and corresponding event rastergrams for P6 (top) and P12 (bottom) recordings. Red lines on the histograms indicate the detection threshold for network events. (F) Visualization of networks corresponding to recordings in (E). Gray contours represent somas within which calcium signals were analyzed. Lines connect cell pairs exhibiting significantly correlated activity. Line color indicates the magnitude of the correlation coefficient. (G) Percentage of pairs exhibiting significantly correlated activity at P6 and P12. Unpaired t-test, p = 0.0002. (H) Average percentage of active cells during network events. The percentage of cells active per network event corresponds to the peak of that event above the red threshold line (E). Unpaired t-test, p = 0.044. *p < 0.05, ***p < 0.001, ****p < 0.0001. Error bars indicate s. e. m. See also Figure S3 and S5.
Figure 3
Figure 3. Temporal Regulation of Thalamic Inputs to 5HT3aR Re Interneurons
(A) Schematic representation of the experimental strategy for rabies monosynaptic tracing. (B) Representative example of a reelin-expressing (blue) starter cell labeled by eGFP (green) and mCherry (red) expression. (C) Schematic representation of the experimental timeline. (D) Representative example of presynaptic partners to 5HT3aR Re interneurons in the somatosensory barrel field (SSBF1) and the thalamus during the first (left) and second postnatal weeks (right). (E) Schematic representation of presynaptic connectivity to 5HT3aR Re interneurons. Each dot represents a traced presynaptic neuron. (F) Proportion of presynaptic inputs to 5HT3aR Re interneurons across brain regions in the first postnatal week (FPW) (n = 5 mice) and second postnatal week (SPW) (n = 7 mice). Two-way ANOVA after arcsine transformation, followed by Bonferroni’s multiple comparisons test. FPW vs. SPW: cortical, p < 0.0001; thalamic p < 0.0001. (G) Schematic representation of experimental procedures used to trace 5HT3aR Re, VIP, and pyramidal cells (PC) (Also see Table S3). (H) VPM monosynaptic connectivity originating from 5HT3aR Re interneurons (left), VIP interneurons (middle), and pyramidal neurons (right). (I) Proportion of VPM inputs over the total number of inputs to superficial neurons (5HT3aR Re: n = 5 mice, VIP: n = 5 mice, Emx1: n = 3 mice). Unpaired t-test, 5HT3aR Re vs. VIP: p = 0.48; 5HT3aR Re vs. Emx1: p = 0.043. *p < 0.05, ****p < 0.0001, ns: p > 0.05. Error bars indicate s. e. m. Scale bar = 100 µm. See also Figure S6 and Table S3.
Figure 4
Figure 4. Whisker Stimulation Activates 5HT3aR Re Interneurons at P6
(A) Sample image and corresponding onset rastergram of calcium events in 5HT3aR.GCaMP6s mice at P6. Each black square indicates event onset. Imaging depth was 50 µm from pial surface. (B) Sample image and corresponding rastergrams of calcium events in thalamic axons of SERT.GCaMP6s mice at P6 (top) and P11 (bottom). Imaging depth was 50 µm from pial surface. (C) Cumulative probability plot of inter-event intervals in 5HT3aR.GCaMP6s (black) and SERT.GCaMP6s (orange) mice at P6. (D) Average inter-event interval in 5HT3aR.GCaMP6s (n = 14 movies, 5 mice) and SERT.GCaMP6s (n = 6 movies, 3 mice) mice. Mann-Whitney test, p = 0.21. (E) Average frequency of calcium events. Mann-Whitney test, p = 0.28. (F) Schematic representation of air puff stimulation setup. 100 ms air puffs were applied to stimulate whiskers on one side of the snout. Imaging was performed on the contralateral side. (G) Representative rastergrams after whisker stimulation (w. stim, top) and quiet resting (q. rest, bottom). Red vertical lines mark the onsets of whisker stimulation (WS) and evoked events were quantified during the windows depicted by red shaded areas. Blue shaded areas indicate matching time windows for network event analysis in the quiet resting condition with no stimulation applied. Each line in rastergram represents the time course of a calcium event. (H) Number of network events that occurred in the 5 second windows immediately after each whisker stimulation (whisker stimulated: n = 6 movies, 4 mice), or in the same windows without stimulation (quiet resting control: n = 6 movies, 5 mice). Unpaired t-test, p = 0.0094. (I) Percentage of active neurons in each network event. Unpaired t-test, p = 0.041. *p < 0.05, **p < 0.01, ns: p > 0.05. Error bars indicate s. e. m. Scale bar = 100 µm.
Figure 5
Figure 5. Sensory Deprivation Causes Persistent Desynchronization of 5HT3aR Re but Not Emx1 Neurons
(A) Schematic representation of the experimental strategy for sensory deprivation. (B and C) Representative rastergrams showing the onset of calcium events for control (B, top) and sensory deprived (B, bottom) neurons recorded in 5HT3aR.GCaMP6s at P6 and Emx1.GCaMP6s mice at P6 (C). (D) Percentage of correlated pairs in 5HT3aR.GCaMP6s and Emx1.GCaMP6s mice in control and deprived conditions at P6 (5HT3aR control: n = 5 movies, 3 mice; deprived: n = 6 movies, 3 mice. Emx1 control: n = 5 movies, 3 mice; deprived n = 8 movies, 3 mice). 5HT3aR.GCaMP6s control vs. deprived: p = 0.03.; Emx1.GCaMP6s control vs. deprived: p > 0.99. (E) Percentage of neurons in network events at P6. 5HT3aR.GCaMP6s control vs. deprived: p = 0.0017, Emx1.GCaMP6s control vs. deprived: p > 0.99. (F and G) Average event frequency (F, 5HT3aR.GCaMP6s control vs. deprived: p = 0.0007, Emx1.GCaMP6s control vs. deprived: p > 0.99) and event duration at P6 (G, 5HT3aR.GCaMP6s control vs. deprived: p = 0.86, Emx1.GCaMP6s control vs. deprived: p > 0.99). (H) Quantification of event frequency in 5HT3aR.GCaMP6s mice from P6 to P12. (P6 control: n = 5 movies, 3 mice; deprived: n = 6 movies, 3 mice. P12 control: n = 7 movies, 3 mice; deprived n = 7 movies, 2 mice). P6 vs. P12: control, p = 0.0008, deprived: p = 0.46. Significance of P6 vs. P12 comparison in sensory deprived condition is indicated on the graph. (I) Percentage of neuronal pairs undergoing correlated activity in sensory deprived and control 5HT3aR.GCaMP6s neurons from P6 to P12. P6 vs. P12: control, p = 0.05; sensory deprived, p > 0.99. Significance of P6 vs. P12 comparison in sensory deprived condition is indicated on the graph. Two-way ANOVA followed by Bonferroni’s multiple comparisons test for all comparisons. *p < 0.05, **p < 0.01, ***p < 0.001, ns: p > 0.05. Error bars indicate s. e. m.
Figure 6
Figure 6. NMDAR Knockdown in 5HT3aR Re Interneurons Disrupts Network Synchrony
(A) Average evoked EPSCs mediated by NMDARs (red) and AMPARs (black) in 5HT3aR Re interneurons in control NR1fl/f (left) and 5HT3aR.Cre, NR1fl/fl neurons (right). (B) NMDA-to-AMPA ratios for 5HT3aR Re interneurons in control (n = 9 neurons) and 5HT3aR.Cre, NR1fl/fl (n = 9 neurons) mice. Black squares indicate average ratios, and open circles indicate individual values. Mann-Whitney test, p = 0.014. (C) Representative traces of voltage responses to 500 ms step current injection in current-clamp configuration of LI 5HT3aR Re interneuron from control (left) and 5HT3aR.Cre, NR1fl/fl (right) mice. The intrinsic firing properties of 5HT3aR Re interneurons in 5HT3aR.Cre, NR1fl/fl mice showed a stereotypical late spiking pattern. (D) Input-output relationship between current inputs and spike frequencies. Two-way ANOVA followed by Tukey’s multiple comparisons test, p > 0.05 for all current step comparisons between control (n = 6 cells) and 5HT3aR.Cre, NR1fl/fl (n = 6 cells). (E) Neurolucida reconstructions for control (left) and 5HT3aR.Cre, NR1fl/fl (right) LI 5HT3aR Re interneurons. Axons are shown in red, dendrites in blue. Scale bar = 100 µm. (F) Axonal length of LI 5HT3aR Re interneurons. Unpaired t-test, p = 0.86, 5HT3aR.Cre, NR1fl/fl: n = 6 neurons; control: n = 9 neurons. (G) Quantification of axonal nodes in LI 5HT3aR Re interneurons. Unpaired t-test, p = 0.44. (H) Dendritic length of 5HT3aR Re interneurons. Mann-Whitney test, p = 0.18. (I) Quantification of dendritic nodes in LI 5HT3aR Re interneurons. Mann-Whitney test, p = 0.26. (J) Representative rastergrams from control 5HT3aR.Cre, NR1fl/+ (left) and 5HT3aR.Cre, NR1fl/fl. GCaMP6s (right) mice at P6. (K) Percentages of correlated pairs in control (n = 7 movies, 4 mice) and 5HT3aR.Cre, NR1fl/fl. GCaMP6s mice (n = 10 movies, 4 mice). Unpaired t-test, p < 0.0001. (L) Active cells in network events. Unpaired t-test, p = 0.039. (M) Quantification of event frequency. Unpaired t-test, p = 0.27. (N) Quantification of event duration. Unpaired t-test, p = 0.25. ns, p > 0.05. *p < 0.05, ****p < 0.0001, Error bars indicate s. e. m. See also Figure S7 and Table S4.
Figure 7
Figure 7. Increased Activation of Pyramidal Cells After NR1 Knockdown in 5HT3aR Re Interneurons
(A) Representative Emx1-expressing starter cells (yellow) and presynaptic partners (red) in the somatosensory cortex at P8. Mice were injected with rabies at P1. Scale bar = 100 µm. (B) Percentages of LI inputs to LII pyramidal cells over all cortical inputs (excitatory neurons and interneurons, 9.0 ± 2.7%) and all cortical interneuronal inputs (13.5 ± 5.4%,. n = 2 mice). (C) Schematics for optogenetic probing of LII pyramidal neurons after stimulation of LI 5HT3aR Re interneurons. ChR2-expressing 5HT3aR neurons were stimulated with LED 488 light in LI only. PC: pyramidal cell. (D) Representative average IPSC recorded from a LII PC upon light stimulation, before (black) and after TTX and 4-AP (red) application for monosynaptic responses. (E) Schematic representation for the imaging of LII/III PCs. (F) Schematic representation of targeted GCaMP6s expression in PCs. (G) Representative event histograms and rastergrams for control NR1fl/fl (top) and 5HT3aR.Cre, NR1fl/fl (bottom) mice. Red vertical lines mark the onsets of whisker stimulation (WS) by air puff and vertical red shaded areas depict the time windows (5 sec) during which network events were quantified. Blue horizontal lines indicate the threshold for network events. Each line in the rastergram represents a calcium event from onset to offset. (H) Number of network after whisker stimulation in control (n = 5 movies, 3 mice) and 5HT3aR.Cre, NR1fl/fl (n = 7 movies, 3 mice). Mann-Whitney test, p = 0.02. (I) Percentage of activated neurons during network events. Mann-Whitney test, p = 0.01. (J) Plot of average correlation coefficients as a function of distance between all cell pairs. Data sets were fitted with exponential decay. Extra-sum-of-squares F test, p < 0.0001 (different curves for each data set). *p < 0.05, ****p < 0.0001. Error bars indicate s. e. m. See also Figure S7 and S8.
Figure 8
Figure 8. Increased Barrel Size and Impaired Texture Discrimination After NR1 Knockdown in 5HT3aR Re Interneurons
(A) Representative images of barrel fields in control NR1fl/fl and 5HT3aR.Cre, NR1fl/fl mice at P8. Thalamic afferents were visualized by VGLUT2 immunohistochemistry. Individual barrels are outlined in white. Red dotted lines indicate the boundaries within which barrels and septa were analyzed. Each of the 36 principal barrels was present in control and 5HT3aR.Cre, NR1fl/fl mice. A: anterior, P: posterior, M: medial, L: lateral. Scale bar = 200 µm. (B) Quantification of total barrel area as the sum of the areas of individual barrels (A1–4, B1–4, C1–5, D1–5, E1–5). Unpaired t-test, p = 0.0065. control: n = 6 mice, 5HT3aR.Cre, NR1fl/fl: n = 9 mice. (C) Quantification of barrel areas as the sum of individual barrel areas per row (row A to E). Multiple t-tests comparing control and 5HT3aR.Cre, NR1fl/fl; row A: p = 0.043; row B: p = 0.017; row C: p = 0.058; row D: p = 0.00035; row E: p = 0.0037. (D) Representative images of row D in a control mouse at P8. Thalamic afferents were visualized by VGLUT2 and SERT immunohistochemistry (left). White outlines indicate areas used for quantification in panels G–I (left). D1 to D5 barrels are outlined on the same sections labeled with DAPI (right). Scale bar = 100 µm. (E) Representative images of D row in a 5HT3aR.Cre, NR1fl/fl mouse at P8. Scale bar = 100 µm. (F) Average cell density in D barrels quantified as the sum of DAPI labeled cells in all D barrels divided by the total surface area. Unpaired t-test, p = 0.84. control: n = 3 mice, 5HT3aR.Cre, NR1fl/fl: n = 3 mice. (G) Fluorescence intensity traces across D1 to D5 barrel centers in control (top) and 5HT3aR.Cre, NR1fl/fl (bottom). Red dotted lines indicate barrel/septa boundary measured as the septal slope. (H) Average septal width in D row. Unpaired t-test, p = 0.046. control: n = 6 mice, 5HT3aR.Cre, NR1fl/fl: n = 9 mice. (I) Average barrel/septal boundary. Unpaired t-test, p = 0.0046. (J) Schematic diagrams for tactile discrimination test. The sheets of sandpaper used were 80- and 180-grit. (K) Quantification of total time spent exploring both sheets. Unpaired t-test, p = 0.84. NR1fl/fl control: n = 14 mice, 5HT3aR.Cre, NR1fl/fl: n = 8 mice. (L) Discrimination index (DI = time spent with 180-grit/total time spent exploring). DI was significantly different from chance level in control but not mutant mice (DI = 0.5, red dotted line). One-sample t-test, control: p = 0.02, 5HT3aR.Cre, NR1fl/fl: p = 0.74. ns: p > 0.05, *p < 0.05, **p < 0.01, ***p < 0.001. Error bars indicate s. e. m.

Similar articles

Cited by

References

    1. Ackman JB, Burbridge TJ, Crair MC. Retinal waves coordinate patterned activity throughout the developing visual system. Nature. 2012;490:219–225. - PMC - PubMed
    1. Agmon A, Connors BW. Thalamocortical responses of mouse somatosensory (barrel) cortex in vitro. Neuroscience. 1991;41:365–379. - PubMed
    1. Akhmetshina D, Nasretdinov A, Zakharov A, Valeeva G, Khazipov R. The nature of the sensory input to the neonatal rat barrel cortex. J. Neurosci. 2016;36:9922–9932. - PMC - PubMed
    1. Allen Developing Mouse Brain Atlas. 2008 Available from: developingmouse.brain-map.org.
    1. Allene C, Cattani A, Ackman JB, Bonifazi P, Aniksztejn L, Ben-Ari Y, Cossart R. Sequential generation of two distinct synapse-driven network patterns in developing neocortex. J. Neurosci. 2008;28:12851–12863. - PMC - PubMed

Publication types

MeSH terms