. 2018 Jul 9;34(1):119-135.e10.
doi: 10.1016/j.ccell.2018.05.012. Epub 2018 Jun 21.

Apoptotic Cell-Derived Extracellular Vesicles Promote Malignancy of Glioblastoma Via Intercellular Transfer of Splicing Factors

Affiliations

Apoptotic Cell-Derived Extracellular Vesicles Promote Malignancy of Glioblastoma Via Intercellular Transfer of Splicing Factors

Marat S Pavlyukov et al. Cancer Cell. .

Abstract

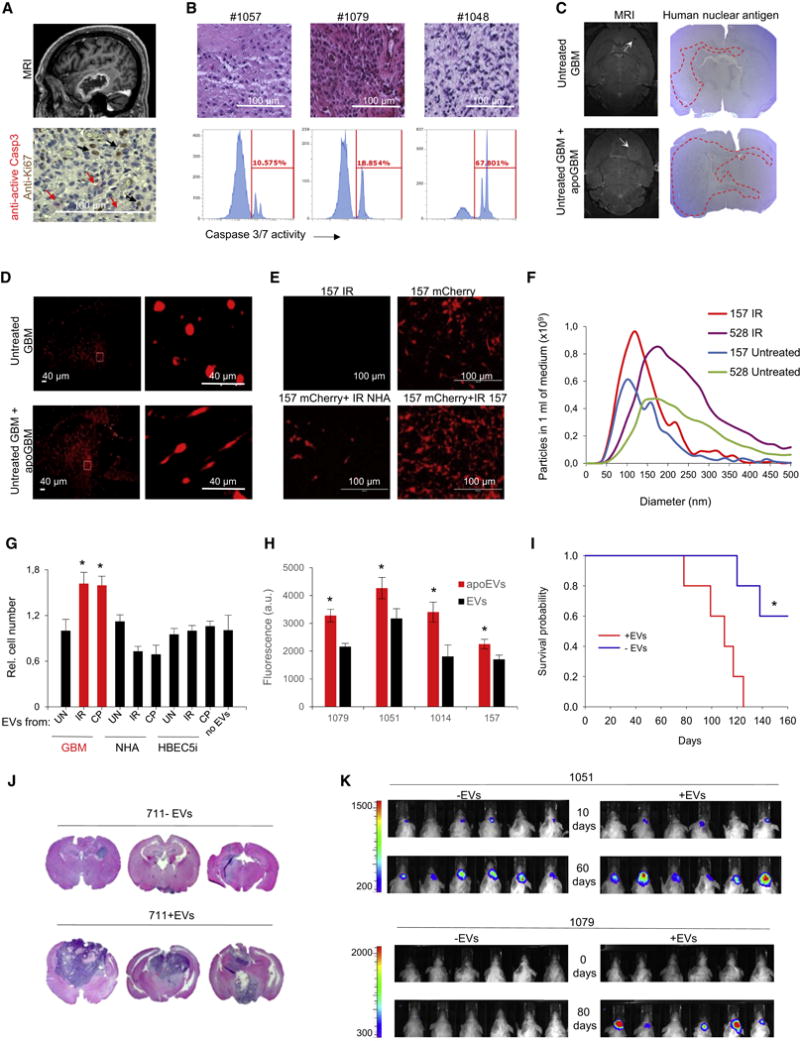
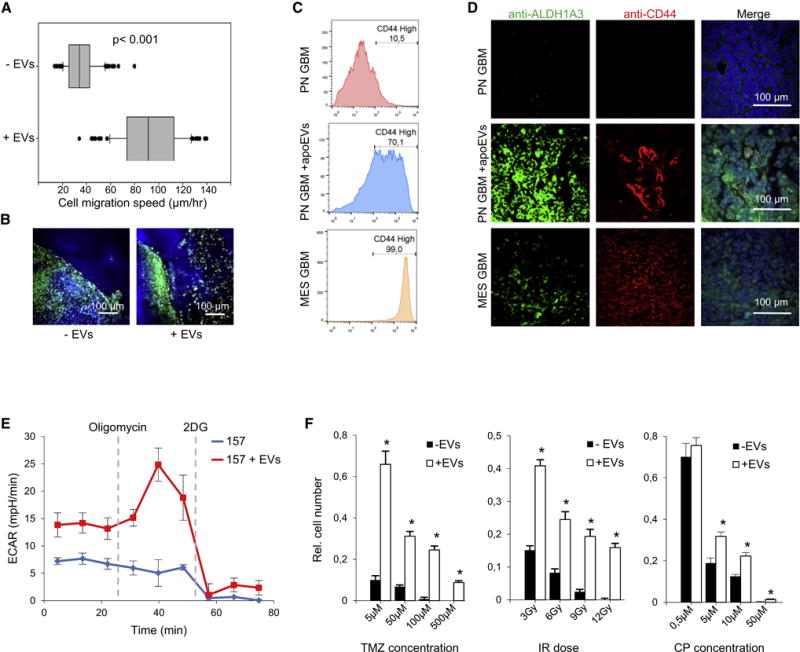
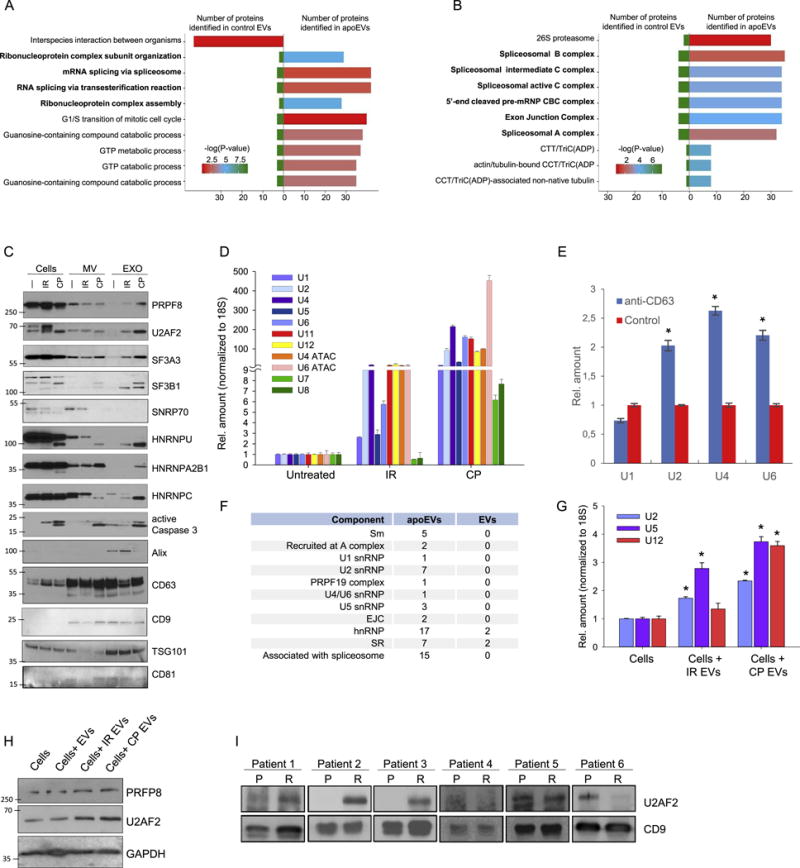
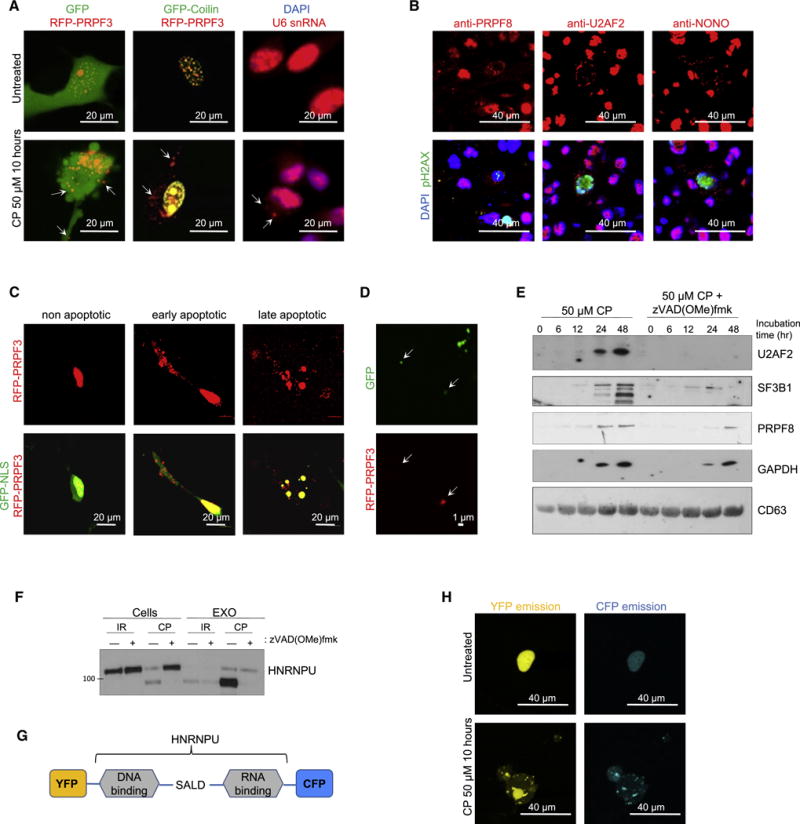
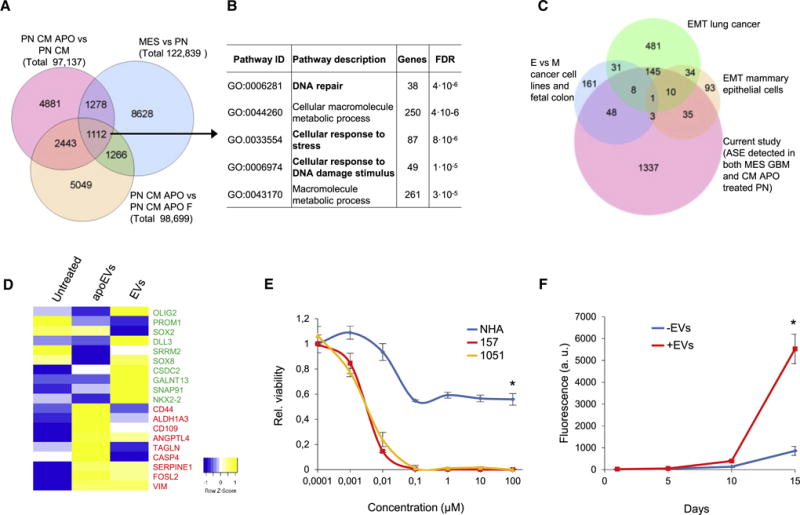
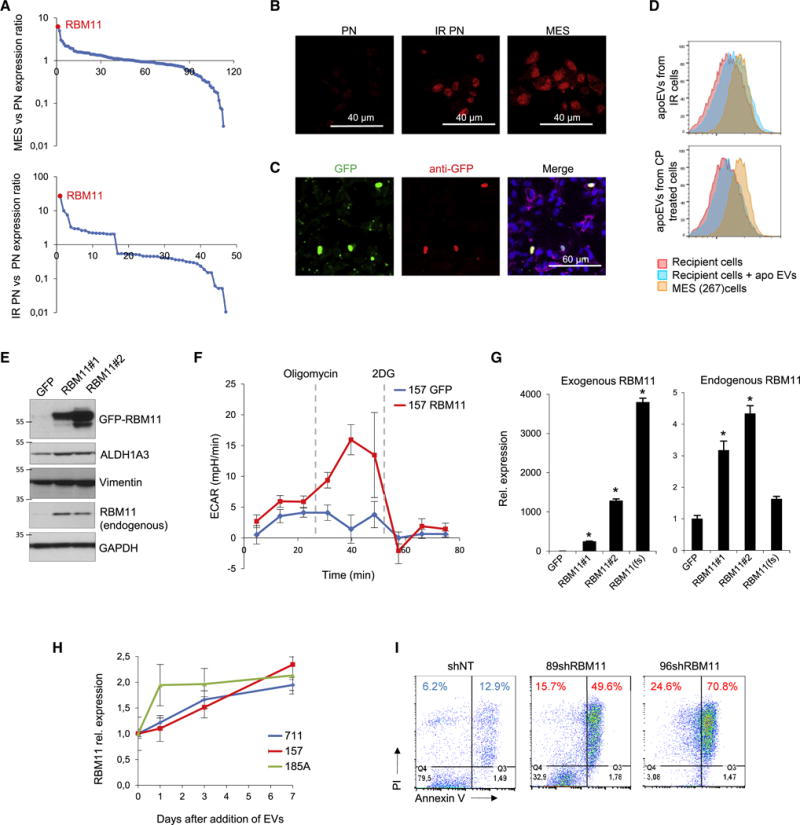
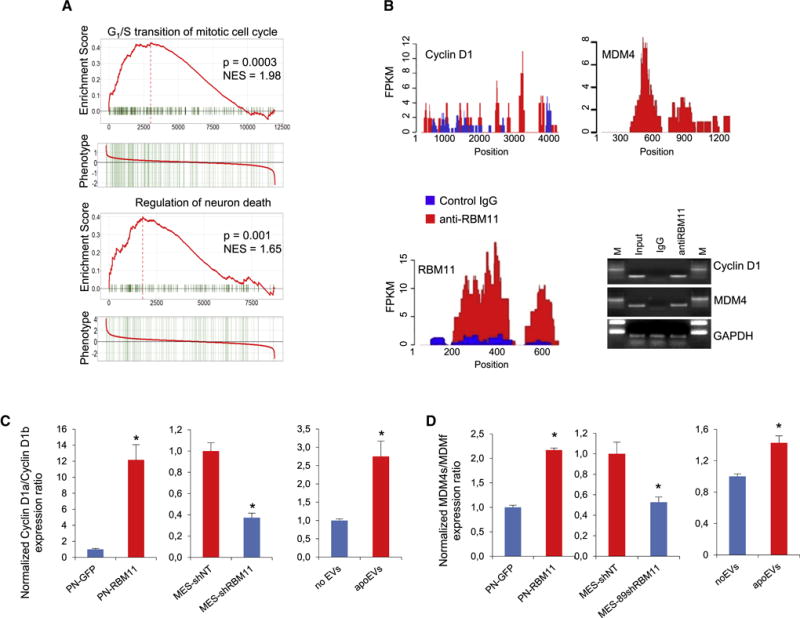
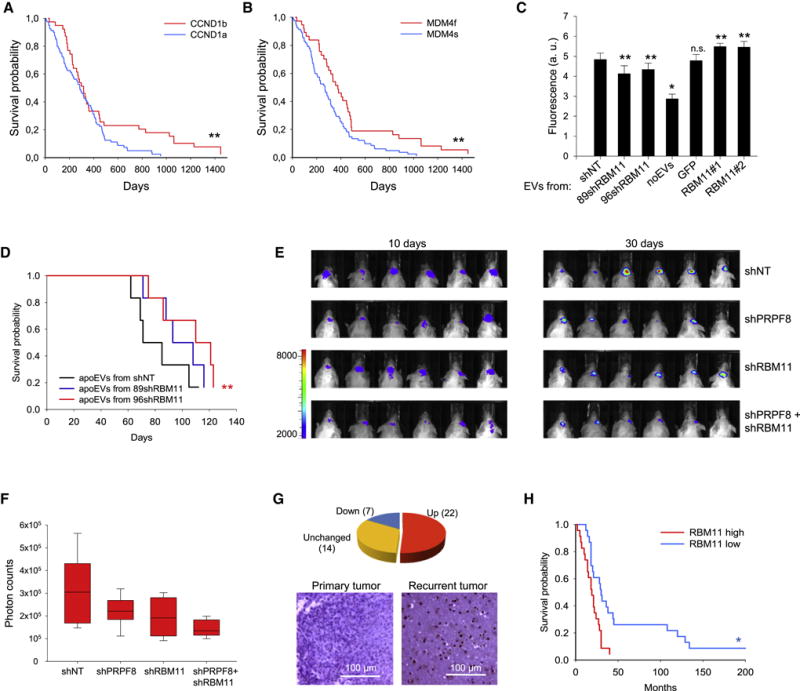
Aggressive cancers such as glioblastoma (GBM) contain intermingled apoptotic cells adjacent to proliferating tumor cells. Nonetheless, intercellular signaling between apoptotic and surviving cancer cells remain elusive. In this study, we demonstrate that apoptotic GBM cells paradoxically promote proliferation and therapy resistance of surviving tumor cells by secreting apoptotic extracellular vesicles (apoEVs) enriched with various components of spliceosomes. apoEVs alter RNA splicing in recipient cells, thereby promoting their therapy resistance and aggressive migratory phenotype. Mechanistically, we identified RBM11 as a representative splicing factor that is upregulated in tumors after therapy and shed in extracellular vesicles upon induction of apoptosis. Once internalized in recipient cells, exogenous RBM11 switches splicing of MDM4 and Cyclin D1 toward the expression of more oncogenic isoforms.

Keywords: alternative splicing; apoptosis; extracellular vesicles; glioblastoma; glioma; proneural-to-mesenchymal transition; spliceosome.


Conflict of interest statement

DECLARATION OF INTERESTS

The authors declare no competing financial interests.

Figures

Figure 1
Figure 1. apoEVs promote growth of GBM cells in vitro and in vivo
(A) MRI image of GBM tumor (top) and section of patient GBM stained for active Caspase 3 and Ki67 (bottom). (B) H&E staining of sections from three representative GBM (top) and flow cytometry analysis of caspase 3/7 activity in freshly dissociated corresponding tumors (bottom). (C) Representative MRI images and mouse brain sections stained for human nuclear antigen after intracranial transplantation of untreated glioma spheres (GBM1027 for MRI and GBM157 for brain sections) alone or together with lethally irradiated (12 Gy) spheres, ratio 1:1 (n = 5 mice per group). (D) Representative images of mouse brain sections obtained as in “C” and stained for human Nestin. (E) Co-culture of mCherry labeled GBM157 cells with unlabeled lethally irradiated normal human atrocities (NHA) or GBM157 cells (ratio 1:1). (F) Nanoparticle tracking analysis of EVs produced by untreated or lethally irradiated GBM157 and GBM528 cells. (G) In vitro cell growth assay of GBM157 spheres cultivated for 7 days with EVs from different sources: GBM157 spheres, normal human astrocytes (NHA) or immortalized brain endothelial cells (HBEC5i) that were left untreated (UN), lethally irradiated (IR) or treated with 50 μM of cisplatin (CP). (H) In vitro cell growth assay of GBM157, GBM1079, GBM1051 and GBM1014 spheres cultivated for 7 days with EVs from lethally irradiated (apoEVs) or untreated (EVs) corresponding cells. (I) Kaplan-Meier survival curves of mice injected with GBM711 spheres along or together with apoEVs (n = 5 mice per group, p<0.01, log-rank test). (J) Representative images of H&E stained mouse brain sections after intracranial transplantation of GBM711 spheres alone or together with apoEVs from 711 cells (n= 5 mice per group). (K) Representative bioluminescence images of mice intracranially injected with 2·105 luciferase labeled GBM1051 (upper panel) or GBM1079 (lower panel) neurospheres in the presence or absence of apoEVs produced by unlabeled lethally irradiated (12 Gy) cells from the same cells. All quantitative data are average ± SD; *p < 0.01; See also Figures S1 and S2.
Figure 2
Figure 2. apoEVs promote more aggressive phenotype of GBM
(A) Single cell motility assay of GBM157 cells that were either untreated or pretreated with apoEVs for 4 days. The line in the box is the median, the left and right of the box are the first and third quartiles, and the whiskers extend to 10th and 90th percentiles respectively. (B) Representative images of mouse brain sections obtained as in “Figure 1I” and stained for human nuclear antigen (green) and DNA (blue) (n = 5 mice per group). (C) FACS analysis for CD44 staining of control GBM157 spheres (PN) and spheres that were cultivated with apoEVs for 4 days. GBM267 spheres (MES) were used as a positive control. (D) Representative images of mouse brain sections obtained as in “Figure 1I” and stained for DNA (blue), ALDH1A3 (green), and CD44 (red). Xenograft tumors formed by GBM267 spheres (MES) were used as a positive control (n = 5 mice per group). (E) Extracellular acidification rate (ECAR) measured by a Seahorse Bioanalyzer in GBM157 cells that were either untreated or pretreated with apoEVs for 4 days (F) In vitro cell viability assay of GBM157 spheres cultivated with or without apoEVs for 3 days, followed by treatment with indicated concentration of temozolomide, cisplatin or doses of γ-irradiation. All quantitative data are average ± SD; *p < 0.01; See also Figures S2 and S3.
Figure 3
Figure 3. apoEVs are enriched with spliceosomal proteins and U snRNAs
(A and B) Analysis of proteins identified by LC-MS/MS in apoEVs and control EVs with Gene Ontology Biological process database (A) or National Cancer Institute database (B). (C) Western blotting analysis of exosome-like vesicles (EXO) and microvesicles (MV) purified from GBM157 spheres that were either untreated (—), lethally irradiated (IR), or treated with cisplatin (CP); PRPF8, U2AF2, SF3A3, SF3B1, SNRNP70, HNRNPU, HNRNPA2B1, HNRNPC – splicing factors; active Caspase 3 – apoptosis marker, Alix, CD63, CD9, TSG101, CD81 – exosome markers. (D) qRT-PCR analysis of U snRNAs in vesicles purified as in “C”. (E) qRT-PCR analysis of U snRNAs in vesicles purified by immunoprecipitation with anti-CD63 or control antibodies. (F) Number of proteins related to different spliceosomal components that were identified in apoEVs and control EVs. (G) qRT-PCR analysis of U snRNAs in GBM157 cells incubated for 10 hr with apoEVs from lethally irradiated or cisplatin treated cells, untreated cells were used as a control. (H) Western blotting analysis of GBM157 neurospheres incubated with EVs from untreated cells and apoEVs purified from lethally irradiated or CP treated cells for 16 hr, untreated cells were used as a control. (I) Western blotting analysis of exosomes isolated from blood serum samples obtained from GBM patients before (P) and after (R) post-surgical chemo- and radio-therapies. CD9 was used as a loading control. All quantitative data are average ± SD; *p < 0.01; See also Figure S4 and Table S1.
Figure 4
Figure 4. Spliceosomal proteins and U snRNAs are exported from apoptotic cells in a caspase-dependent manner
(A) Fluorescence images of GBM157 cells coexpressing RFP-PRPF3 and GFP (left) or GFP-Coilin (middle) after treatment with 50 μМ of cisplatin (CP) for 10 hr. Right: cisplatin-treated 157 cells were stained with DAPI and fluorescently-labeled probe for U6 snRNA. (B) Immunofluorescent staining of human GBM tumor sections with DAPI (blue), antibodies against phosphorylated histone H2AX (green) and antibodies against splicing factors (red). (C) Fluorescence images of GBM157 cells coexpressing RFP-PRPF3 and GFP-NLS after treatment with cisplatin. (D) Fluorescence images of vesicles secreted into cultural medium by GBM157 cells coexpressing RFP-PRPF3 and GFP after treatment with cisplatin. (E) Western blotting analysis of EVs purified from GBM157 cells treated for different periods of time with cisplatin in a presence or absence of pan-caspase inhibitor zVAD(OMe)fmk. (F) Western blotting analysis of EVs and corresponding donor GBM157 cells treated with cisplatin (CP) or γ-irradiation in a presence or absence of zVAD(OMe)fmk. (G) Schematic representation of fusion protein encoded by pEYFP-HNRNPU-CFP plasmid. SALD - Caspase3 cleavage site. (H) Fluorescence images of CFP and YFP emission in GBM157 cells transfected with pEYFP-HNRNPU-CFP plasmid and treated with cisplatin. See also Figures S4 and S5.
Figure 5
Figure 5. apoEVs promote mesenchymal-like splicing changes and rescue cells from the inhibition of endogenous splicing factors
(A) Venn diagram representing alternative splicing events (ASE) detected in 3 different comparisons: MES cells versus PN cells; GBM157 (PN) cells cultivated for 4 days with conditional medium from lethally irradiated PN cells (CM APO) versus PN cells cultivated with conditional medium from untreated PN cells (CM); PN cells cultivated with CM APO versus PN cells cultivated with CM APO that were filtered (CM APO F) to remove vesicles. (B) Gene ontology enrichment analysis of genes affected by ASE that were detected in all three comparisons. (C) A Venn diagram representing genes affected by MES specific ASE induced by CM APO in GBM157 cells and genes affected by ASE during Epithelial-Mesenchymal Transition (EMT) described in three previous studies. (D) Heatmap generated from RNAseq data showing expression of PN (green) and MES (red) markers in GBM157 neurospheres that were left untreated or treated for 4 days with apoEVs or control EVs produced by the cells from the same patient. (E) In vitro viability assay of GBM spheres from two different patients and normal human astrocytes (NHA) treated with Pladienolide B. (F) In vitro cell growth assay of GBM157 cells pretreated for two days with 20 nM of Pladienolide B and then cultivated in a fresh drug-free media in a presence or absence of apoEVs. All quantitative data are average ± SD; See also Figure S5 and Table S2.
Figure 6
Figure 6. Splicing factor RBM11 is upregulated during apoptosis and subsequently transported by apoEVs to the recipient cells
(A) Relative expression of genes involved in alternative splicing regulation in GBM157 (PN) versus MES glioma spheres (top) and in untreated versus lethally irradiated PN spheres (bottom), determined by microarray analysis. (B) Immunofluorescent staining of untreated or lethally-irradiated GBM157 (PN) sphere with antibodies against RBM11. GBM267 spheres (MES) were used as a positive control. (C) Immunofluorescent staining of GBM157 cells incubated for 24 hr with apoEVs from lethally-irradiated GBM157 cells overexpressing GFP-RBM11 protein with antibodies against GFP. (D) FACS analysis for RBM11 staining of control GBM157 spheres or GBM157 spheres incubated for 10 hr with apoEVs from either lethally-irradiated or cisplatin treated GBM157 cells. GBM267 spheres (MES) were used as a positive control. (E) Western blotting analysis of GBM157 cells stably expressing either GFP or GFP-RBM11 protein (two RBM11 isoforms were described so far: NM_144770 (#1) and NM_001320602 (#2), both were used in this study). (F) Extracellular acidification rate (ECAR) measured by a Seahorse Bioanalyzer in GBM157 cells overexpressing GFP or GFP-RBM11. (G) qRT-PCR analysis of expression of exogenous and endogeneous RBM11 (primers for 3′UTR) in GBM157 cells stably expressing GFP, GFP-RBM11 (#1 and #2 isoforms) or GFP-RBM11 frame-shift mutant RBM11(fs). (H) qRT-PCR analysis of RBM11 expression in GBM157, GBM711 and GBM185 glioma spheres at different time points of cultivation with apoEVs from corresponding cell line. (I) FACS analysis for Annexin V/PI staining of irradiated MES cells expressing non-target shRNA, or shRNA against RBM11. All quantitative data are average ± SD; *p < 0.01; See also Figures S6 and S7 and Table S3.
Figure 7
Figure 7. RBM11 regulates splicing of genes responsible for cell cycle progression and cell death
(A) GSEA of gene expression data of GBM157 cells (PN) expressing GFP versus GBM157 cells expressing GFP-RBM11 and of GBM267 cells (MES) expressing shRNA against RBM11 versus GBM267 cells expressing non target shRNA. (B) RNA-IP enrichment profiles for antibodies against RBM11 (red) and a control IgG (blue); RT-PCR of corresponding samples with primers for Cyclin D1, MDM4 and GAPDH. (C, D) qRT-PCR analysis of Cyclin D1 (C) or MDM4 (D) isoform expression ratios in GBM157 cells (PN) expressing GFP or GFP-RBM11, in GBM267 spheres (MES) expressing shRNA against RBM11 or non-target shRNA as a control, and in GBM157 cells cultivated for 7 days in a presence or absence of apoEVs. All quantitative data are average ± SD; *p < 0.01; See also Figure S8 and Table S4.
Figure 8
Figure 8. Exogenous RBM11 promotes malignancy of recipient tumor cells
(A, B) Kaplan-Meier curve showing the overall survival of glioma patients subdivided based on the splicing of Cyclin D1 (A, p=0.0392, log-rank test) and MDM4 (B, p=0.0112, log-rank test), RNAseq data were obtained from TCGA database. (C) In vitro cell growth assay of 157 spheres cultivated for 7 days with apoEVs from different sources: 157 cells stably expressing GFP, GFP-RBM11, two different shRNA against RBM11 or non-target shRNA (NT). (D) Kaplan-Meier survival curves of mice injected with GBM711 spheres together with apoEVs from GBM711 cells stably expressing shRNA against RBM11 or NT shRNA as a control (n = 6 mice per group, p=0.13 and p=0.04, log-rank test). (E) Representative bioluminescence images of mice intracranially coinjected with 2·105 luciferase labeled GBM1051 neurospheres and 2·105 lethally-irradiated (12 Gy) unlabeled GBM1051 neurospheres that were previously infected with lentiviruses encoding control shRNA (shNT) or shRNA against RBM11 (shRBM11) and/or shRNA against PRPF8 (shPRPF8). (F) Quantification of luciferase signal in mice from (E). The horizontal line in the box is the median, the bottom and top of the box are the first and third quartiles, and the whiskers extend to 10th and 90th percentiles respectively. (G) Analysis of RBM11 immunoreactivity in 43 paired GBM specimens of primary and recurrent tumors from the matched patients (upper) and representative images of immunohistochemical staining for RBM11 (lower). (H) Kaplan-Meier curve showing the overall survival of glioma patients (n=45) subdivided in two groups based on RBM11 immunoreactivity (p=0.0018, log-rank test), data obtained from the tissue microarray. All quantitative data are average ± SD; *p < 0.01, **p < 0.05; See also Figure S8.

Similar articles

Cited by

References

    1. Arscott WT, Tandle AT, Zhao S, Shabason JE, Gordon IK, Schlaff CD, Zhang G, Tofilon PJ, Camphausen KA. Ionizing radiation and glioblastoma exosomes: implications in tumor biology and cell migration. Transl Oncol. 2013;6:638–648. - PMC - PubMed
    1. Bhat KP, Balasubramaniyan V, Vaillant B, Ezhilarasan R, Hummelink K, Hollingsworth F, Wani K, Heathcock L, James JD, Goodman LD, et al. Mesenchymal differentiation mediated by NF-κB promotes radiation resistance in glioblastoma. Cancer Cell. 2013;24:331–346. - PMC - PubMed
    1. Bonnal S, Vigevani L, Valcárcel J. The spliceosome as a target of novel antitumour drugs. Nat Rev Drug Discov. 2012;11:847–859. - PubMed
    1. Brat DJ, Castellano-Sanchez AA, Hunter SB, Pecot M, Cohen C, Hammond EH, Devi SN, Kaur B, Van Meir EG. Pseudopalisades in glioblastoma are hypoxic, express extracellular matrix proteases, and are formed by an actively migrating cell population. Cancer Res. 2004;64:920–927. - PubMed
    1. Busà R, Geremia R, Sette C. Genotoxic stress causes the accumulation of the splicing regulator Sam68 in nuclear foci of transcriptionally active chromatin. Nucleic Acids Res. 2010;38:3005–3018. - PMC - PubMed

Publication types

MeSH terms