. 2018 Aug 7;28(2):300-309.e4.
doi: 10.1016/j.cmet.2018.05.025. Epub 2018 Jun 21.

Deconstructing Adipogenesis Induced by β3-Adrenergic Receptor Activation with Single-Cell Expression Profiling

Affiliations

Deconstructing Adipogenesis Induced by β3-Adrenergic Receptor Activation with Single-Cell Expression Profiling

Rayanne B Burl et al. Cell Metab. .

Abstract

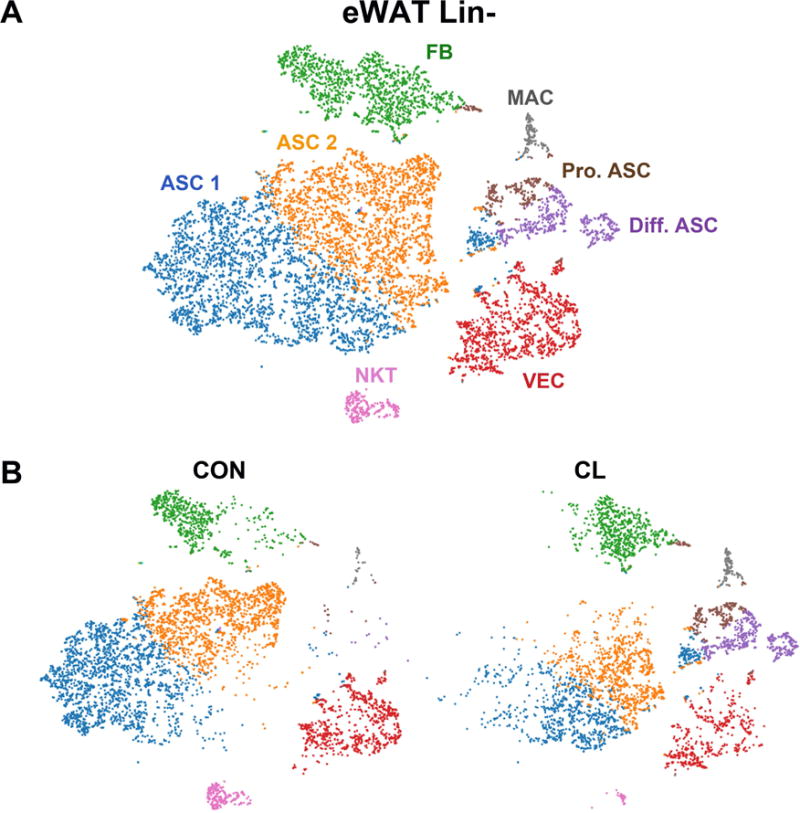
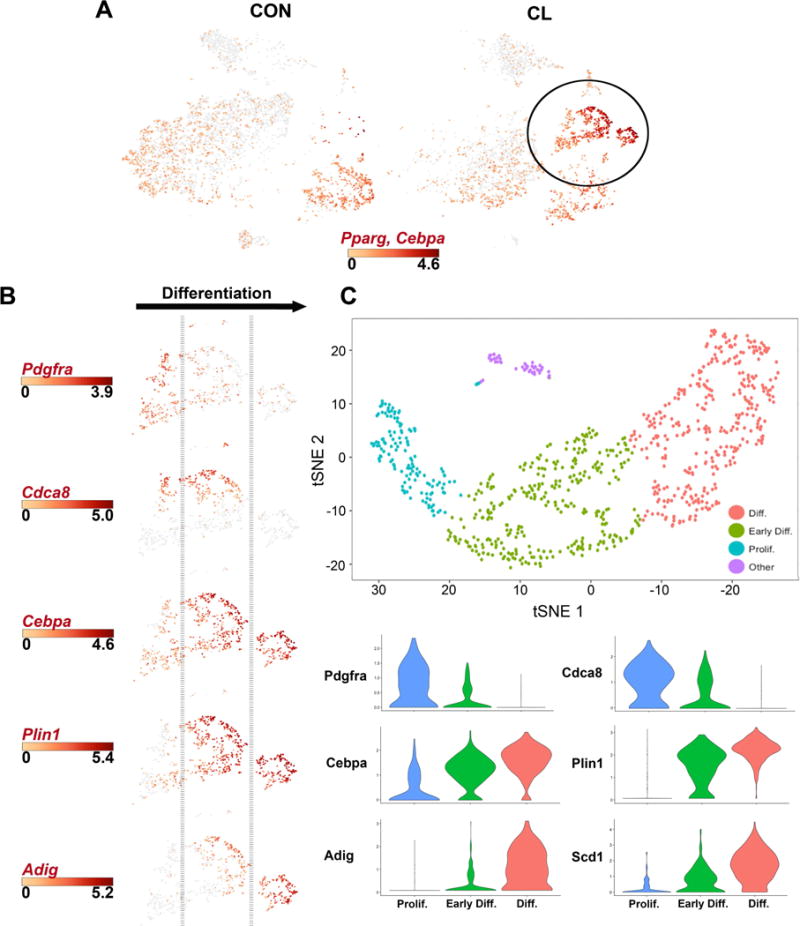
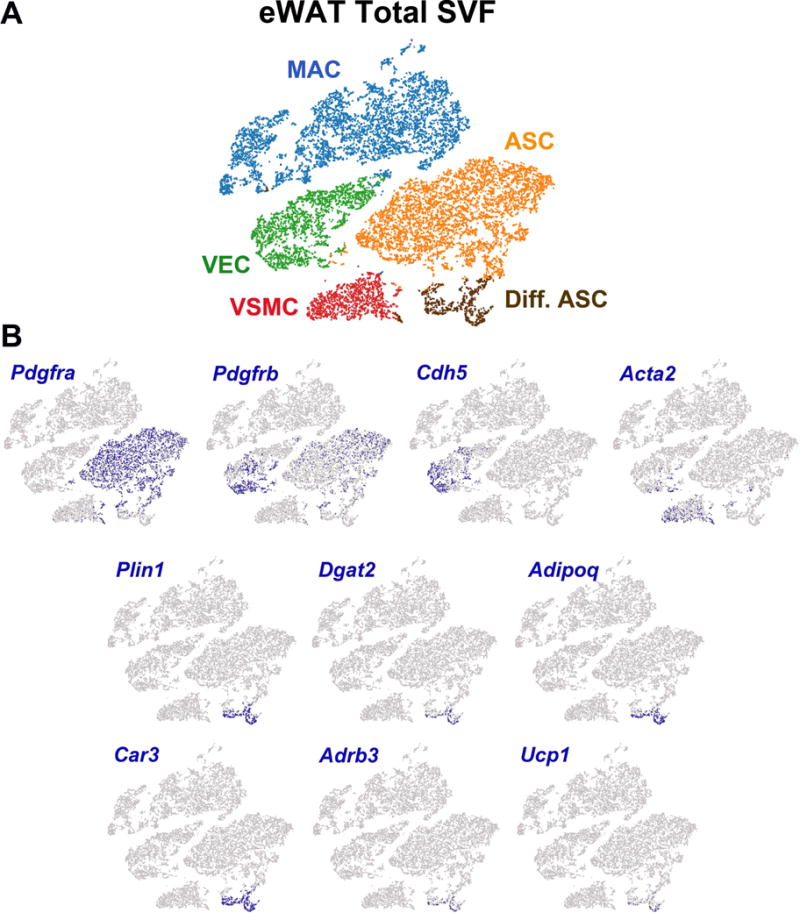
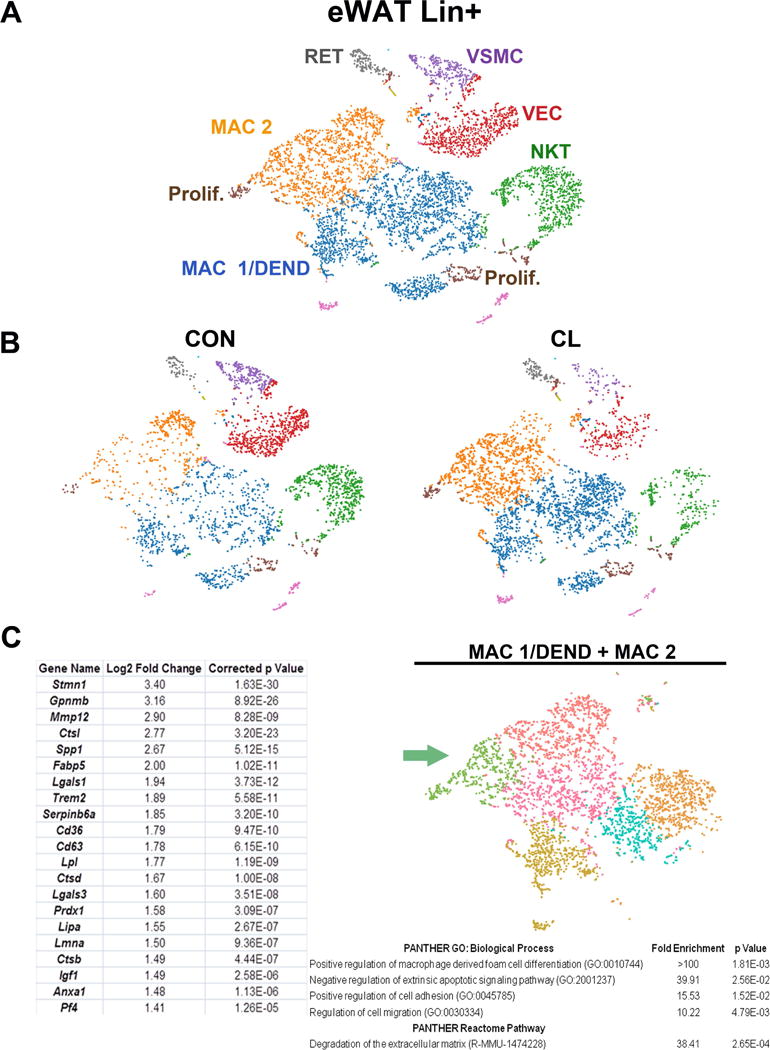
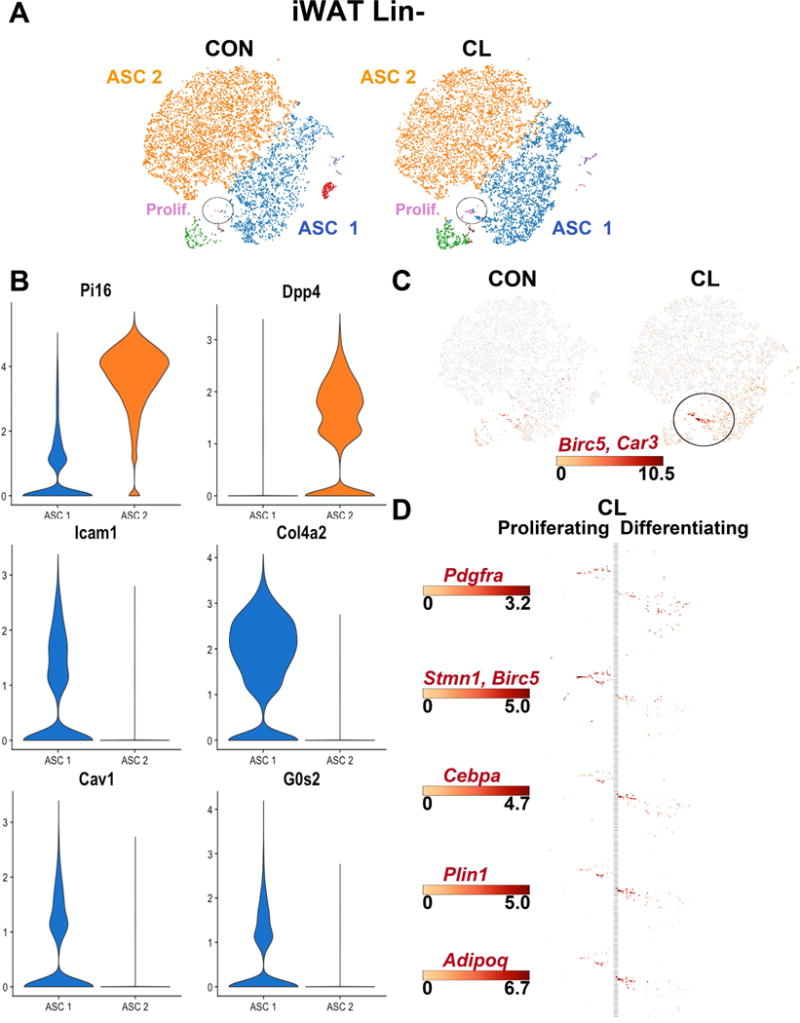
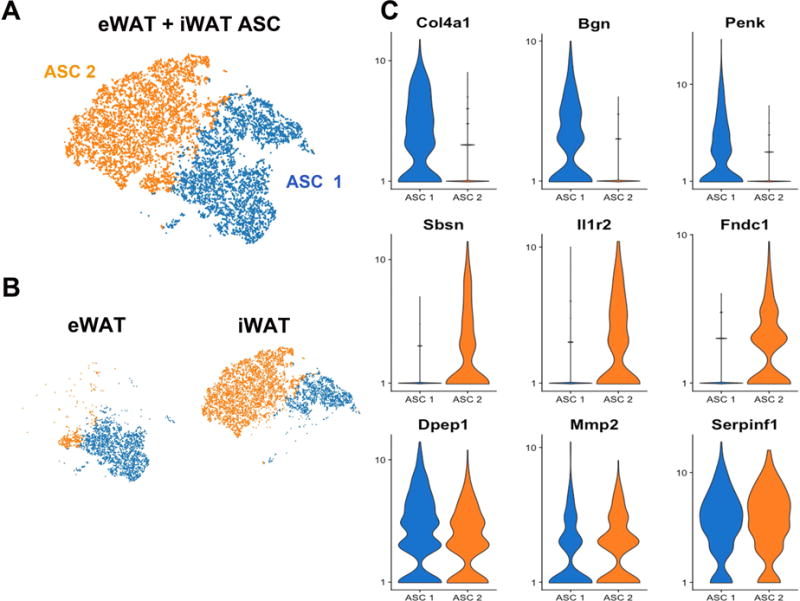
Recruitment of brown/beige adipocytes (BAs) in white adipose tissue (WAT) involves proliferation and differentiation of adipocyte stem cells (ASCs) in concert with close interactions with resident immune cells. To deconvolve stromal cell heterogeneity in a comprehensive and unbiased fashion, we performed single-cell RNA sequencing (scRNA-seq) of >33,000 stromal/vascular cells from epididymal WAT (eWAT) and inguinal WAT (iWAT) under control conditions and during β3-adrenergic receptor (ADRB3) activation. scRNA-seq identified distinct ASC subpopulations in eWAT and iWAT that appeared to be differentially poised to enter the adipogenic pathway. ADRB3 activation triggered the dramatic appearance of proliferating ASCs in eWAT, whose differentiation into BAs could be inferred from a single time point. scRNA-seq identified various immune cell types in eWAT, including a proliferating macrophage subpopulation that occupies adipogenic niches. These results demonstrate the power of scRNA-seq to deconstruct adipogenic niches and suggest novel functional interactions among resident stromal cell subpopulations.

Keywords: RNA-seq; adipocyte stem cell; adipogenesis; brown adipocyte; browning; differentiation trajectory; macrophage; recuitment; stromal cells.


Figures

Figure 1
Figure 1. Single-cell RNA-sequencing reveals adipocyte stem cell heterogeneity in mouse eWAT
(A) t-SNE plot of 9,915 lineage negative (Lin−) stromal vascular cells from eWAT of control mice and mice treated with CL for 3 days. K-means clustering applied to the t-SNE plot identified eight major cell types/states (the table of significant DEGs used to define these clusters is presented in Table S2A). Clusters are highlighted in different colors. ASC, adipocyte stem cells; MAC, macrophages; VEC, vascular endothelial cells; NKT, natural killer T cells; FB, fibroblasts; Pro. ASC, proliferating adipocyte stem cells; Diff. ASC, differentiating adipocyte stem cells. Cell counts by cluster: ASC 1 = 3,185 (32%), ASC 2 = 2,654 (27%), FB 3 = 1,443 (15%), VEC 4 = 1,320 (13%), Diff. ASC 5 = 530 (5%), Pro. ASC 6 = 324 (3%), NKT 7 = 274 (3%), MAC 8 = 183 (2%). (B) t-SNE plot of K-means clusters from (A) split into the cells from control (CON) and CL-treated mice (CL).
Figure 2
Figure 2. scRNA-seq of mouse eWAT maps an adipogenic differentiation trajectory during CL treatment
(A) Gene expression profiles of master regulators of adipogenesis, Pparg and Cebpa, in eWAT Lin− cells from CON and CL-treated mice. Scale bar represents the Log2 values of combined max gene expression. (B) Expression profiles of genes known to be involved in adipogenesis reveals a differentiation trajectory. Expression scale bars show Log2 values of max gene expression. (C) t-SNE plot and shared nearest neighbor clustering of Diff. ASC and Pro. ASC clusters from Figure 1A using the single-cell R toolkit Seurat. Independent clustering of these cells in Seurat ordered cells along a differentiation trajectory that could be defined by expression of genes in Figure 2B. Violin plots showing the mean and variance expression density in Prolif., Early Diff., and Diff. clusters for the following genes: Pdgfra, Cdca8, Cebpa, Plin1, Adig, and Scd1. Gene expression profiles corroborate the differentiating trajectory defined in Figure 2B. The complete list of DEGs that define these clusters is presented in Table S2C.
Figure 3
Figure 3. scRNA-seq analysis of aggregated eWAT Lin+ and Lin− cells from control and CL-treated mice
t-SNE plots represent the total population of stromal vascular cells from eWAT. (A) 17,640 cells from Lin+ and Lin− libraries of CON and CL-treated mice were clustered by K-means (five clusters) and projected onto a t-SNE plot to define general cell types. MAC, macrophages; VEC, vascular endothelial cells; VSMC, vascular smooth muscle cells; ASC, adipocyte stem cells; Diff. ASC, differentiating adipocyte stem cells. Cell types were identified by the DEGs in each cluster (Table S2E). Cell counts by cluster: MAC = 6,600 (37%), VEC = 2,675 (15%), VSMC = 1,489 (8%), ASC = 6,011 (34%), Dif. ASC = 865 (5%). (B) The data set was queried for cells expressing selected ASC marker genes, as well as cells expressing early and late markers of adipocytes. Highlighted cells express the given gene above the following thresholds: Pdgfra > 1; Pdgfrb > 1; Cdh5 > 3; Acta2 > 2; Plin1 > 3; Dgat2 > 3; Adipoq > 4; Car3 >7; Adrb3 > 2; Ucp1 > 1. Expression values are Log2 values of max gene expression.
Figure 4
Figure 4. scRNA-seq analysis of lineage+ eWAT stromal cells of control and CL-treated mice
(A) t-SNE plot of 7,725 lineage positive (Lin+) cells isolated from eWAT of control and CL-treated mice. K-means clustering applied to the t-SNE identified eight major cell types/states: RET, reticulocytes; VSMC, vascular smooth muscle cells; VEC, vascular endothelial cells; NKT, natural killer T cells; MAC, macrophages; DEND, dendritic cells; Prolif., cells undergoing active proliferation. Cell types/states were determined by DEGs within each cluster, the complete list of which is presented in Table S2F. Cell counts by cluster: MAC 1/DEND = 2,725 (35%), MAC 2 = 1,781 (23%), NKT = 1,018 (13%), VEC = 976 (13%), VSMC = 384 (5%), Prolif. = 376 (5%), RET = 200 (3%). (B) t-SNE plot of K-means clusters segregated by treatment (CON or CL). CL treatment increased the relative abundance of macrophages. (C) An alternative method of clustering, Graph-based clustering, was applied to the t-SNE plot of Lin+ cells and identified 6 macrophage clusters. Gene expression comparisons were made among the clusters. Shown are DEGs and corresponding gene ontologies (GO) of the subcluster of macrophages in green that were associated with proliferation.
Figure 5
Figure 5. scRNA-seq of ASC from iWAT of control and CL treated mice
(A) t-SNE plots of a combined 16,023 cells isolated from inguinal white adipose tissue (iWAT) of control and mice treated with CL for 3 days. K-means clustering defined seven main clusters, which are segregated by treatment condition (CON or CL). Clusters ASC 1 and ASC 2 comprise the majority of the cell types and are distinguished from each other by differential expression of genes associated with ECM production and turnover (the list of cluster-defining DEGs is given in Table S3). ASC, adipocyte stem cells. Cell counts by cluster: ASC 1 = 5,198 (32%), ASC 2 = 9,700 (61%), Prolif. = 66 (0.4%). (B) Violin plots showing the mean and variance expression density of specified genes in iWAT ASC 1 and ASC 2 for the following genes: Pi16, Dpp4, Icam1, Col4a2. Expression profiles of Pi16 and Dpp4, and Icam1 and Col4a2 show a striking demarcation of clusters ASC 1 and ASC 2. Differential expression of Cav1 and G0s2 suggests that cluster ASC 1 is more poised for adipogenesis. (C) Expression profiles of Birc5 (proliferation) and Car3 (adipogenesis) identified very few cells within an adipogenic trajectory. (D) Expression profiles of genes involved in adipocyte proliferation and differentiation. Scale bars denote maximum Log2 expression values for each gene.
Figure 6
Figure 6. Comparison of ASCs from eWAT and iWAT
(A) t-SNE plot of combined Lin− cells from eWAT and iWAT of control mice, showing only the adipocyte stem cells. K-means clustering identified 2 main clusters labeled ASC 1 and ASC 2. ASC, adipocyte stem cells. Cell counts by cluster: ASC 1 = 5,058 (45%), ASC 2 = 6,071 (55%). (B) Segregating libraries by depot indicates distinct expression profiles of ASC from iWAT and eWAT. (C) Violin plots showing the mean and variance of gene expression in ASC 1 and ASC 2 for Col4a1, Bgn, Penk, Sbsn, Il1r2, Fndc1, Dpep1, Mmp2, and Serpinf1. Gene expression profiles illustrate differences and similarities between depots and among ASC subpopulations. Expression of Col4a1, Bgn, and Penk have higher expression in ASCs from eWAT, while Sbsn, Il1r2, and Fndc1 are expressed in ASCs from iWAT. However, some genes, like Dpep1, Mmp2, and Serpinf1, are expressed in all ASC. The complete list of DEGs that define ASC 1 and ASC 2 is presented in Table S4.

References

    1. Amano SU, Cohen JL, Vangala P, Tencerova M, Nicoloro SM, Yawe JC, Shen Y, Czech MP, Aouadi M. Local proliferation of macrophages contributes to obesity-associated adipose tissue inflammation. Cell Metab. 2014;19:162–171. - PMC - PubMed
    1. Aouadi M, Vangala P, Yawe JC, Tencerova M, Nicoloro SM, Cohen JL, Shen Y, Czech MP. Lipid storage by adipose tissue macrophages regulates systemic glucose tolerance. Am J Physiol Endocrinol Metab. 2014;307:E374–383. - PMC - PubMed
    1. Babicki S, Arndt D, Marcu A, Liang Y, Grant JR, Maciejewski A, Wishart DS. Heatmapper: web-enabled heat mapping for all. Nucleic Acids Res. 2016;44:W147–153. - PMC - PubMed
    1. Barbatelli G, Murano I, Madsen L, Hao Q, Jimenez M, Kristiansen K, Giacobino JP, De Matteis R, Cinti S. The emergence of cold-induced brown adipocytes in mouse white fat depots is determined predominantly by white to brown adipocyte transdifferentiation. Am J Physiol Endocrinol Metab. 2010;298:E1244–1253. - PubMed
    1. Berry DC, Jiang Y, Graff JM. Mouse strains to study cold-inducible beige progenitors and beige adipocyte formation and function. Nat Commun. 2016;7:10184. - PMC - PubMed

Publication types

Substances