. 2018 Jul 2;46(1):40-58.e8.
doi: 10.1016/j.devcel.2018.05.032. Epub 2018 Jun 21.

CLASP Suppresses Microtubule Catastrophes through a Single TOG Domain

Affiliations

CLASP Suppresses Microtubule Catastrophes through a Single TOG Domain

Amol Aher et al. Dev Cell. .

Abstract

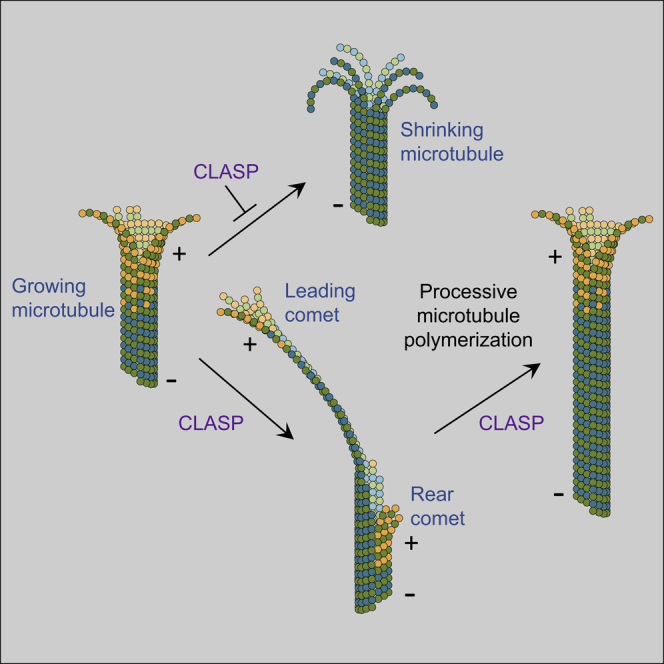
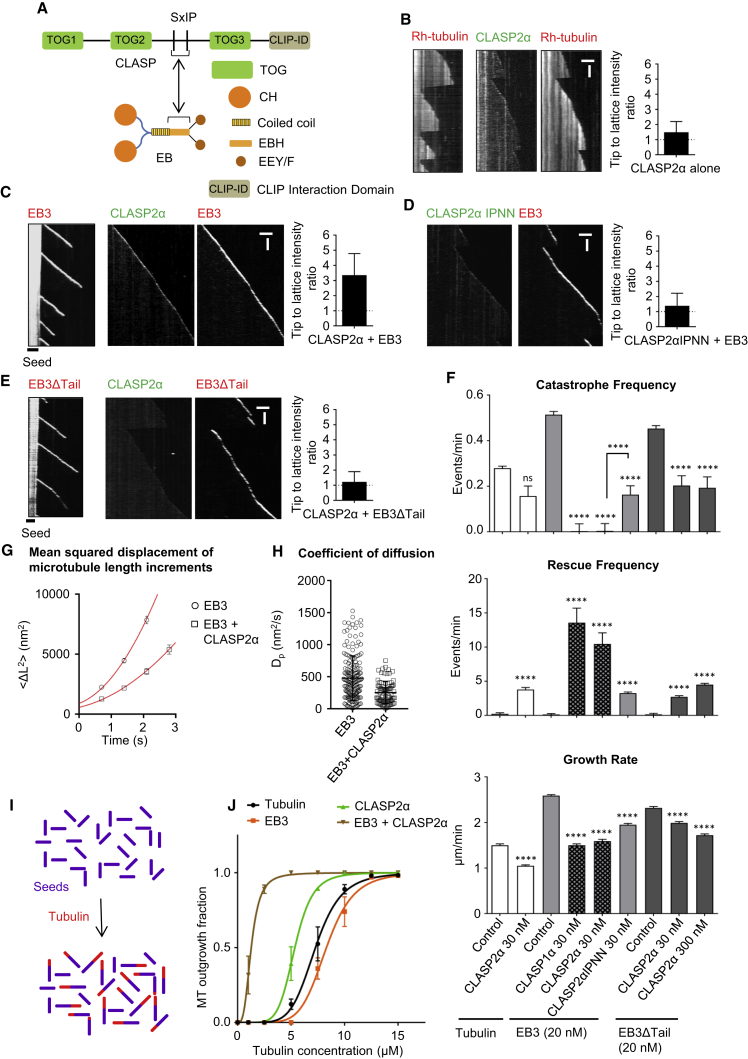
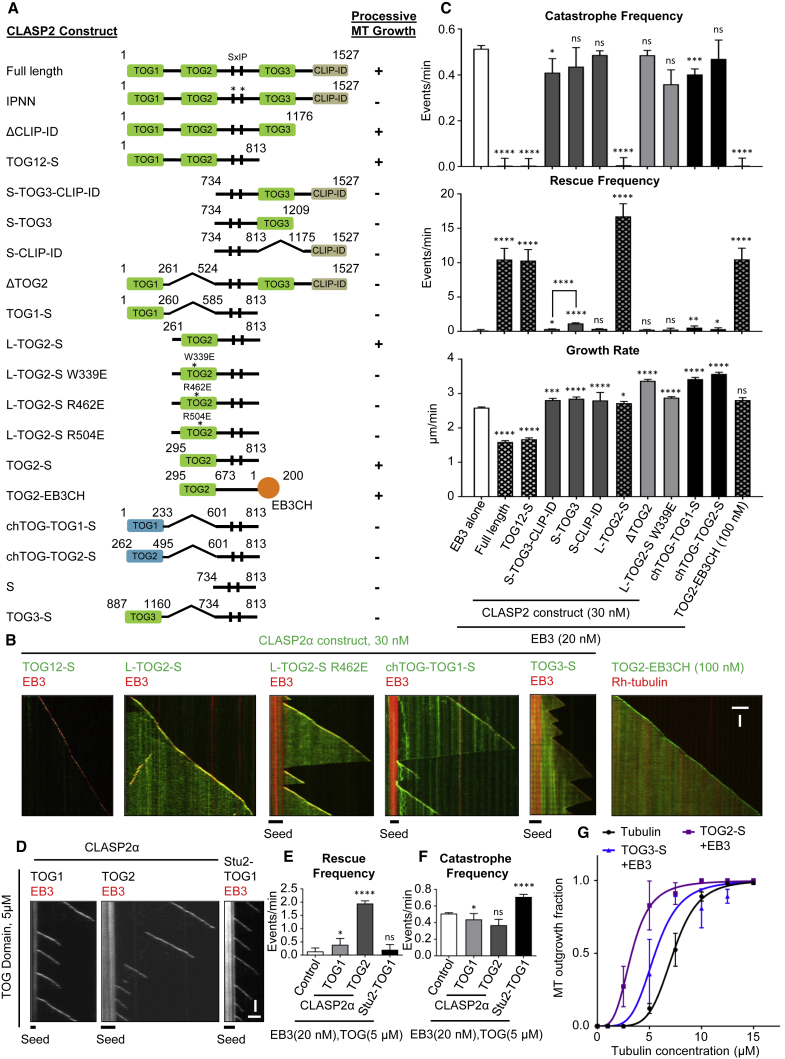
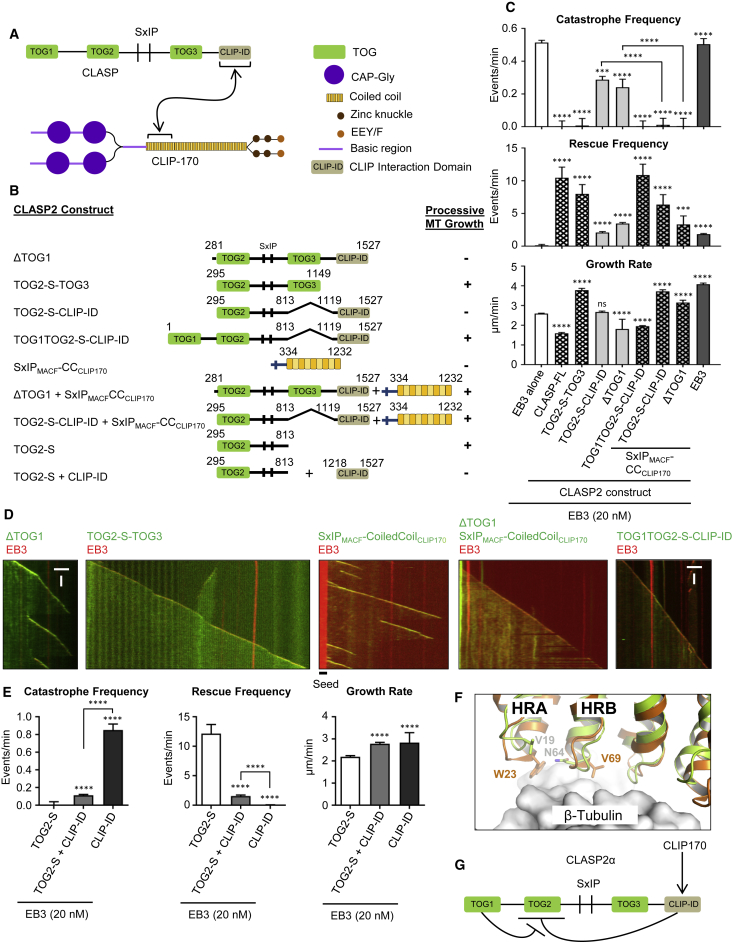
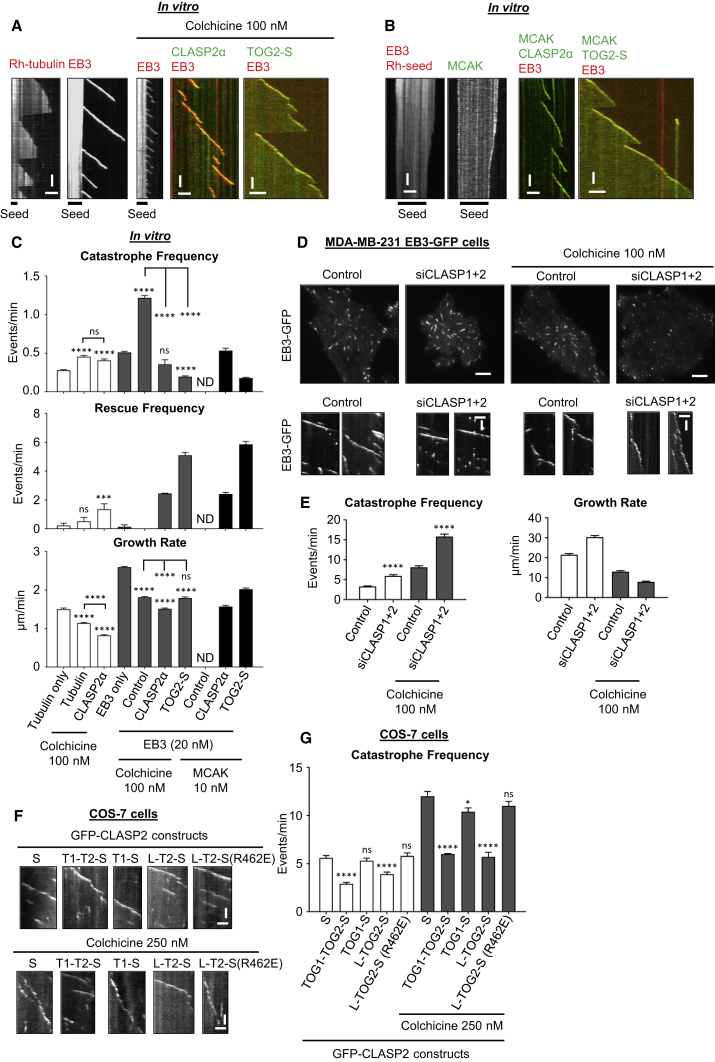
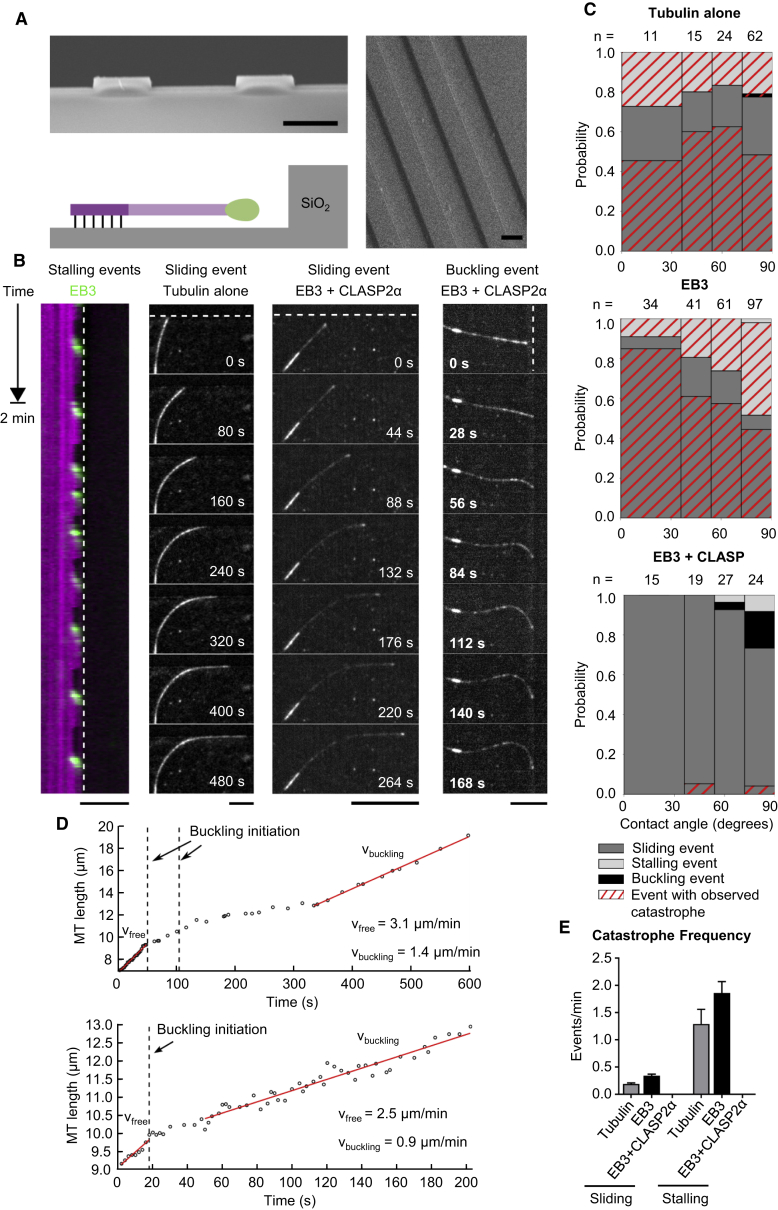
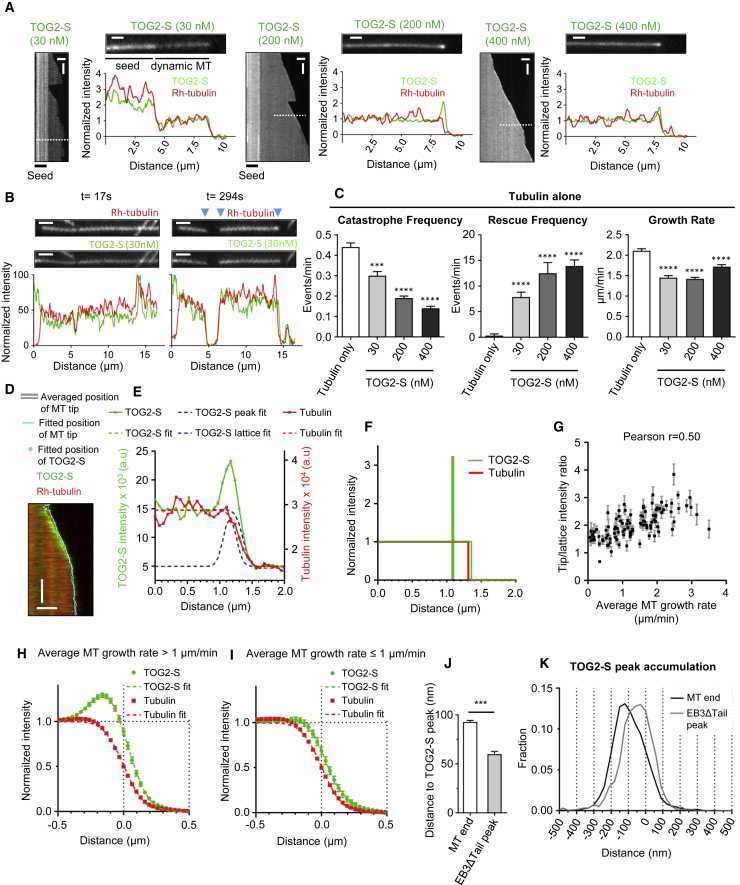
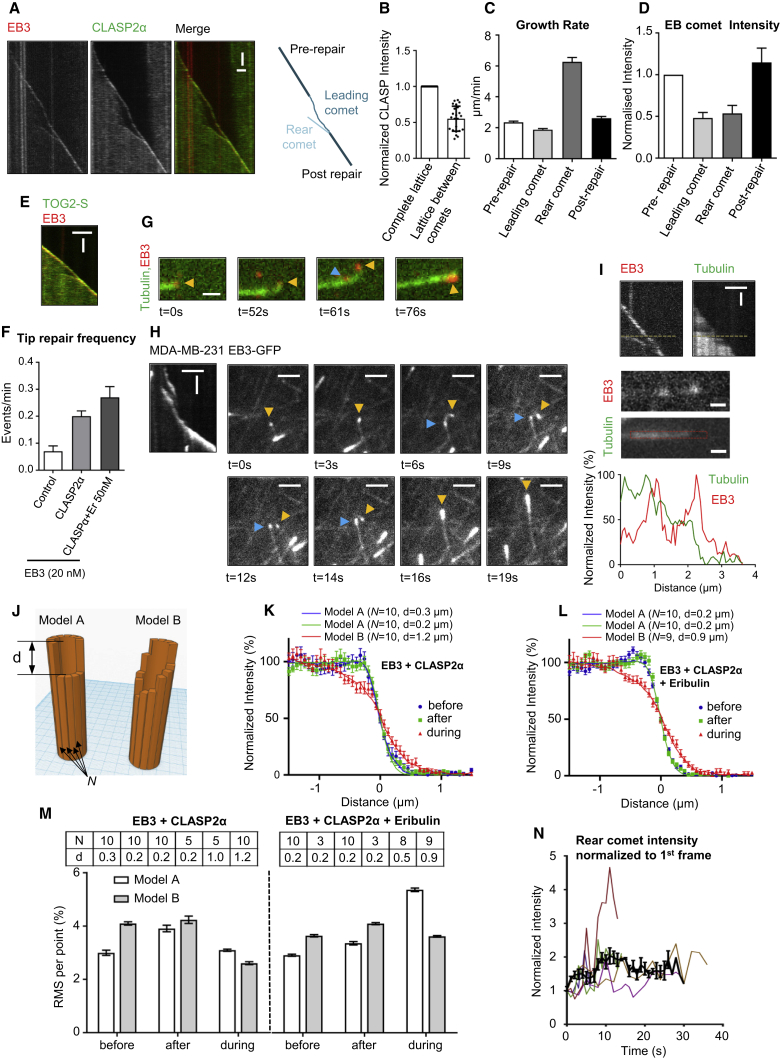
The dynamic instability of microtubules plays a key role in controlling their organization and function, but the cellular mechanisms regulating this process are poorly understood. Here, we show that cytoplasmic linker-associated proteins (CLASPs) suppress transitions from microtubule growth to shortening, termed catastrophes, including those induced by microtubule-destabilizing agents and physical barriers. Mammalian CLASPs encompass three TOG-like domains, TOG1, TOG2, and TOG3, none of which bind to free tubulin. TOG2 is essential for catastrophe suppression, whereas TOG3 mildly enhances rescues but cannot suppress catastrophes. These functions are inhibited by the C-terminal domain of CLASP2, while the TOG1 domain can release this auto-inhibition. TOG2 fused to a positively charged microtubule-binding peptide autonomously accumulates at growing but not shrinking ends, suppresses catastrophes, and stimulates rescues. CLASPs suppress catastrophes by stabilizing growing microtubule ends, including incomplete ones, preventing their depolymerization and promoting their recovery into complete tubes. TOG2 domain is the key determinant of these activities.

Keywords: CLASP; CLIP-170; EB1; EB3; TOG domain; X-ray crystallography; microfabricated barriers; microtubule dynamics; single-molecule biophysics; tubulin.


Figures

None
Graphical abstract
Figure 1
Figure 1
CLASP2α Promotes Processive MT Polymerization and MT Outgrowth from a Template (A) A scheme of CLASP and EB domain organization and CLASP-EB interaction. (B–E) Kymographs of MT plus end growth with rhodamine-tubulin alone or together with 30 nM GFP-CLASP2α (B), 20 nM mCherry-EB3 alone or together with 30 nM GFP-CLASP2α (C), 20 nM mCherry-EB3 and 30 nM GFP-CLASP2αIPNN (D), and 20 nM mCherry-EB3ΔTail alone or together with 30 nM GFP-CLASP2α (E). Plots of fluorescence intensity ratio of CLASP2α at the growing MT plus end and MT lattice are shown on the right, n = 27 (B), 26 (C), 25 (D), and 30 (E). Scale bars, 2 μm (horizontal) and 60 s (vertical). (F) Parameters of MT plus end dynamics in the presence of rhodamine-tubulin alone or together with 20 nM mCherry-EB3 or together with 20 nM mCherry-EB3ΔTail in combination with the indicated CLASP constructs at 30 or 300 nM as indicated. Number of growth events analyzed: for tubulin alone, n = 135, tubulin with GFP-CLASP2α, n = 134, mCherry-EB3 alone, n = 207, mCherry-EB3 with GFP-CLASP1α, n = 110, mCherry-EB3 with GFP-CLASP2α, n = 110, mCherry-EB3 with GFP-CLASP2αIPNN, n = 182, mCherry-EB3ΔTail, n = 182, mCherry-EB3ΔTail and GFP-CLASP2α, n = 174, mCherry-EB3ΔTail and 300 nM GFP-CLASP2α, n = 128. Error bars represent SEM. (G and H) Average of the mean-squared displacement (MSD) of MT length increments, plotted over time (G) and the values of the diffusion constant Dp, obtained from fits of the MSD curves (H). Data are shown for MTs grown either in the presence of EB3 alone or together with 30 nM of CLASP2α. The average diffusion constant of 506 ± 41 nm2/s for control and 316 ± 25 nm2/s in presence of CLASP2α were estimated from fits to the data (red line). Each dot in (H) represents the diffusion constant estimated for an individual MT growth event; control (n = 183), CLASP2α (n = 88). (I and J) Schematic of the MT outgrowth assay and plot of the fraction of the total GMPCPP seeds that show MT outgrowth in 15 min at increasing tubulin concentrations with tubulin alone (black) or together with GFP-EB3 (200 nM) (orange), or together with GFP-CLASP2α (100 nM) (green), or together with GFP-EB3 (200 nM) and GFP-CLASP2α (100 nM) (brown). For increasing tubulin concentrations in the case of tubulin alone, n = 92, 96, 105, 82, 97, 87, 161, and 127 GMPCPP seeds, respectively, for 200 nM GFP-EB3, n = 69, 73, 68, 77, 80, 83, 106, and 96 GMPCPP seeds, respectively, for 100 nM GFP-CLASP2α, n = 119, 122, 118, 119, 145, 110, 119, and 115 GMPCPP seeds, respectively, and for 200 nM GFP-EB3 together with 100 nM GFP-CLASP2α, n = 107, 54, 85, 88, 70, 87, 85, and 70 GMPCPP seeds, respectively. Data are from two experiments. Error bars represent SD. Solid lines indicate the sigmoidal equation fit to the data. Tubulin concentration for half-maximal MT outgrowth for tubulin alone = 7.28 ± 0.08, for 200 nM GFP-EB3 = 8.30 ± 0.11, for 100 nM GFP-CLASP2α = 5.35 ± 0.04, for 100 nM GFP-CLASP2α and 200 nM GFP-EB3 = 1.28 ± 0.01. Hill slopes for the fits with tubulin alone = 5.99 ± 0.34, for EB3 = 6.53 ± 0.49, for CLASP2α = 6.46 ± 0.31, and for CLASP2α and EB3 = 3.16 ± 0.07. For all plots, ∗∗∗∗p < 0.0001, ns, no significant difference with control, Mann-Whitney U test. See also Figure S1.
Figure 2
Figure 2
The Second TOG-like Domain of CLASP2α Is Necessary and Sufficient for Catastrophe Suppression (A) A scheme of different CLASP2 constructs used. Processive MT growth is the condition in which no catastrophes were observed within 10 min in the assay with 20 nM mCherry-EB3. (B) Representative kymographs showing MT plus end growth in the presence of 20 nM mCherry-EB3 and GFP fusions of the indicated fusion proteins. EB3-CH domain fusion was used at 100 nM, all the other proteins at 30 nM. Scale bars, 2 μm (horizontal) and 60 s (vertical). (C) Parameters of MT plus end dynamics in the presence of 20 nM mCherry-EB3 alone or together with the indicated GFP-fusion proteins. Protein concentrations were as in (B). Number of growth events analyzed: for mCherry-EB3 alone, n = 207, together with GFP-CLASP2α, n = 110, with TOG12-S, n = 110, with S-TOG3-CLIP-ID, n = 117, with S-TOG3, n = 70, with S-CLIP-ID, n = 136, with L-TOG2-S, n = 110, with ΔTOG2, n = 154, with L-TOG2-S W339E, n = 118, with chTOG-TOG1-S, n = 47, with chTOG-TOG2-S, n = 78, and for TOG2-EB3CH alone, n = 110. Error bars represent SEM. For catastrophe frequency plots, p < 0.05, ∗∗∗p < 0.005, ∗∗∗∗p < 0.0001, for rescue frequency plots, p < 0.05, ∗∗p < 0.005, ∗∗∗∗p < 0.0001, and for growth rate plots, p < 0.05, ∗∗∗p < 0.005, ∗∗∗∗p < 0.0001, and ns, no significant difference with control, Mann-Whitney U test. (D) Representative kymographs showing MT plus end dynamics in the presence of 20 nM mCherry-EB3 and 5 μM concentration of the indicated TOG domains from CLASP2α or Stu2. Scale bars, 2 μm (horizontal) and 60 s (vertical). (E and F) MT plus end rescue and catastrophe frequencies in the presence of 20 nM mCherry-EB3 alone (n = 207) or together with 5 μM of CLASP2α TOG1 (n = 61) or TOG2 (n = 100), or with Stu2-TOG1 (n = 146). Error bars represent SEM. For all plots, p < 0.05, ∗∗∗∗p < 0.0001 and ns, no significant difference with control, Mann-Whitney U test. (G) Plot of the fraction of the total GMPCPP seeds that show MT outgrowth at increasing tubulin concentrations with tubulin alone (black curve) or GFP-EB3 (200 nM) together with either GFP-TOG3-S (100 nM) (blue) or GFP-TOG2-S (100 nM) (purple). For increasing tubulin concentrations in case of tubulin alone, n = 92, 96, 105, 82, 97, 87, 161, and 127 GMPCPP seeds, respectively, for GFP-TOG3-S, n = 61, 52, 53, 56, 71, 59, 61, and 88 GMPCPP seeds, respectively, and for GFP-TOG2-S, n = 70, 64, 50, 50, 55, 66, 63, and 63 GMPCPP seeds, respectively. Data are from two experiments. Error bars represent SD. Solid lines indicate the sigmoidal equation fit to the data. Tubulin concentration for half-maximal MT outgrowth for tubulin alone = 7.28 ± 0.08, for GFP-TOG2-S with GFP-EB3 = 3.29 ± 0.07, and for GFP-TOG3-S with GFP-EB3 = 5.54 ± 0.32. Hill slope for the fits with tubulin alone = 5.99 ± 0.34, for GFP-TOG2-S with GFP-EB3 = 3.56 ± 0.21, and for GFP-TOG3-S with GFP-EB3 = 4.59 ± 1.11. See also Figure S2.
Figure 3
Figure 3
The C-Terminal CLIP-Interacting Domain of CLASP2α Shows Auto-inhibitory Activity that Is Relieved by the First TOG-like Domain or by CLIP-170 (A) A scheme of the CLASP-CLIP-170 interaction. (B) A scheme of the different CLASP and CLIP-170 constructs used. Conditions showing processive MT growth in the presence of 20 nM mCherry-EB3 are indicated based on (C). (C) Parameters of MT plus end dynamics in the presence of 20 nM mCherry-EB3 and the indicated constructs. Number of growth events: for mCherry-EB3 together with GFP-CLASP2α, n = 110, with TOG2-S-TOG3, n = 62, with TOG2-S-CLIP-ID, n = 101, with ΔTOG1, n = 141, with TOG1TOG2-S-CLIP-ID, n = 116, for mCherry-EB3 and SxIPMACF-CCCLIP170 alone n = 117, and together with TOG2-S-CLIP-ID, n = 72, with ΔTOG1, n = 50. Error bars represent SEM. (D) Representative kymographs showing MT plus end dynamics in the presence of 20 nM mCherry-EB3 together with the indicated fusion proteins. Scale bars, 2 μm (horizontal) and 60 s (vertical). (E) Parameters of MT plus end dynamics in the presence of 20 nM mCherry-EB3 with 30 nM TOG2-S alone (n = 62), or together with 500 nM CLIP-ID (n = 96), or with CLIP-ID alone (n = 115). n = number of growth events. Error bars represent SEM. (F) Superposition of the structure of hsCLASP2-TOG1 (in green, PDB: 5NR4) and scStu2-TOG1 in complex with tubulin (in orange, PDB: 4FFB) at the β-tubulin binding interface. The scStu2-TOG1 residues located in the two first HEAT repeats (HRA and HRB) and which are involved in tubulin binding, and the equivalent hsCLASP2-TOG1 residues are indicated. (G) Model for regulation of CLASP activity. CLIP-interacting domain inhibits the catastrophe-suppressing activity of TOG2. In the context of the full-length CLASP2α, this auto-inhibition is relieved by the presence of TOG1, whereas in CLASP2 isoforms such as CLASP2γ, which lack TOG1, the auto-inhibition is relieved by engaging CLIP-ID with the CLIP-170 coiled-coil domain. For all plots, ∗∗∗p < 0.005, ∗∗∗∗p < 0.0001, and ns, no significant difference with control, Mann-Whitney U test. See also Figure S3.
Figure 4
Figure 4
CLASP2α Suppresses Catastrophes Induced by MT-Destabilizing Agents In Vitro and in Cells (A) Kymographs showing MT plus end dynamics in the presence of rhodamine-tubulin alone or with 20 nM mCherry-EB3 or in the presence of 100 nM colchicine with 20 nM mCherry-EB3 alone or together with 30 nM GFP-CLASP2α. Scale bars, 2 μm (horizontal) and 60 s (vertical). (B) Kymographs showing MT plus end depolymerization in the presence of 20 nM mCherry-EB3 and 10 nM GFP-MCAK, or plus end growth dynamics when 30 nM GFP-CLASP2α or GFP-TOG2-S are added. Scale bars, 2 μm (horizontal) and 60 s (vertical). (C) Parameters of MT plus end dynamics in the presence of the indicated of proteins, with or without 100 nM colchicine. Number of growth events analyzed: for rhodamine-tubulin alone, n = 135, with colchicine, n = 110, with colchicine and GFP-CLASP2α, n = 68, for mCherry-EB3 alone, n = 207, for mCherry-EB3 with colchicine, n = 228, for mCherry-EB3 with colchicine and GFP-CLASP2α, n = 136, and for mCherry-EB3 with colchicine and GFP-TOG2-S, n = 241. For mCherry-EB3 with GFP-MCAK and GFP-CLASP2, n = 144 and for mCherry-EB3 together with GFP-MCAK and GFP-TOG2-S, n = 227. Error bars represent SEM. (D) Still images of MDA-MB-231 cells stably expressing EB3-GFP and kymographs showing MT plus end growth in control or CLASP1- and CLASP2-depleted cells alone or in the presence of 100 nM colchicine. Scale bars, 5 μm (cell images), 2 μm (horizontal), and 60 s (vertical) (for kymographs). (E) MT plus end catastrophe frequency and growth rates in MDA-MB-231 cells stably expressing EB3-GFP after transfection either with control or CLASP1 and CLASP2 siRNAs, untreated or treated with 100 nM colchicine. Number of growth events from left to right, n = 56, 53, 106, and 123. Error bars represent SEM. (F) Kymographs showing MT plus end dynamics in COS-7 cells expressing the indicated GFP-fusions; cells were untreated or treated with 250 nM colchicine. Scale bars, 2 μm (horizontal) and 15 s (vertical). (G) MT plus end catastrophe frequency in COS-7 cells shown in (F). Numbers of growth events from left to right n = 61, 61, 65, 64, and 57 (without colchicine) and with 250 nM colchicine, n = 61, 65, 92, 47, and 70 (with 250 nM colchicine). Error bars represent SEM. For all plots, p < 0.05, ∗∗∗p < 0.005, ∗∗∗∗p < 0.0001, and ns, no significant difference with control, Mann-Whitney U test. See also Figure S4.
Figure 5
Figure 5
CLASP2α Inhibits Force-Induced Catastrophes in the Presence of EB3 (A) Scanning electron microscope images with cross-sectional and top-down view of the SiO2 barriers. The cartoon illustrates the MT-barrier interaction of a seed-nucleated MT in the presence of MT tip-binding proteins. Scale bars, 10 μm. (B) Representative kymograph and three-frame averaged montages of the three types of events during MT-barrier contact: stalling, sliding, and buckling. The location of the barrier is denoted by dashed white lines. All experiments were performed at 30°C, with the following concentrations when present: tubulin (15 μM), EB3 (20 nM), and CLASP (30 nM). Scale bars, 10 μm. See also Videos S1, S2, and S3. (C) Probability of the event type during MT-barrier contact as a function of the contact angle, with 90° being perpendicular to the barrier. The red hatched events ended with a catastrophe. Number of growth events analyzed are indicated above each bin. (D) MT growth during two buckling events. Vertical dotted lines indicate the start of a buckling event. The first graph contains two buckling initiation events, as the MT tip slipped during the first event. MT growth velocities are significantly lower during buckling compared with free growth. (E) MT plus end catastrophe frequency during barrier contact for MTs sliding or stalling in the presence of tubulin alone or together with 20 nM mCherry-EB3 alone or with 20 nM mCherry-EB3 and 30 nM GFP-CLASP2α. For sliding events, n = 88, 156, and 77, and for stalling events, n = 23, 77, and 3 for MTs grown in the presence of tubulin alone, together with mCherry-EB3, and with both mCherry-EB3 and GFP-CLASP2α. Error bars represent SEM.
Figure 6
Figure 6
TOG2 Domain Shows Preference for a Region behind the Outmost MT End (A) Kymographs, stills, and fluorescence intensity profiles for GFP-TOG2-S at the indicated concentrations (30, 200, and 400 nM) in the presence of rhodamine-tubulin. Scale bars, 1 μm (for stills). Scale bars, 3 μm (horizontal) and 60 s (vertical) (for kymos). (B) Stills and fluorescence intensity profiles for GFP-TOG2-S (30 nM) and rhodamine-tubulin for MTs assembled in the presence of tubulin alone after tubulin washout, with the time after tubulin washout indicated. Blue arrowheads indicate the depolymerizing MT ends. Scale bars, 2 μm. (C) Parameters of MT plus end dynamics in the presence of either rhodamine-tubulin alone (n = 122) or in combination with GFP-TOG2-S at 30 nM (n = 91), 200 nM (n = 109), and 400 nM (n = 80). Error bars denote SEM. For all plots, ∗∗∗p < 0.005, ∗∗∗∗p < 0.0001, and ns, no significant difference with control, Mann-Whitney U test. (D) Example kymograph of GFP-TOG2-S (400 nM) (green channel) and rhodamine-tubulin (red channel) with overlayed profiles fitting results. Cyan line marks fitted position and white line marks averaged position of MT tip, derived from piecewise linear approximation. Green dots mark fitted position of TOG2-S accumulation. The opacity of dots is proportional to the amplitude of the accumulation. Scale bars, 1 μm and 10 s. (E) Example of an individual fitting of GFP-TOG2-S (400 nM) and rhodamine-tubulin fluorescence intensity profiles. Blue dashed line corresponds to the lattice and black dashed line to the peak accumulation components of overall TOG2-S fit function (shown with green dashed line). (F) Density distribution of TOG2-S (400 nM) (peak and lattice component shown separately, green lines) and MT lattice (red line) extracted from fitting shown in (E). (G) Plot of the ratio of peak-to-lattice fluorescence intensity of GFP-TOG2S (400 nM) derived from fitting versus average speed of growth. Ratios are averaged for segments of constant average speed growth (128 segments, 5997 time points, 13 kymographs). Error bars represent SEM. (H and I) Normalized, aligned, resampled, and averaged fluorescent intensity profiles of GFP-TOG2-S (400 nM) and rhodamine-tubulin split based on average MT growth rate threshold value of 1 μm/min. Profiles were first averaged per kymograph. Error bars represent SEM of second averaging among multiple kymographs (13 kymographs, 3,536 left + 2,461 right = 5,997 total time points). (J and K) Mean values with SEM (J) and histograms (K) of distances between TOG2-S intensity peak accumulation and the fitted position of MT tip (white bar, mean = 92.9 nm, n = 4586 fits) or the fitted peak of EB3ΔTail (gray bar, mean = 59.9 nm, n = 1778 fits). Only the fits where TOG2-S tip to lattice intensity ratio was above 1 were included. ∗∗∗p < 0.0001, two-tailed Mann-Whitney test. In the histograms, 0 corresponds to the fitted position of the MT end or EB3ΔTail peak. See also Figure S5.
Figure 7
Figure 7
CLASP2α Stabilizes Incomplete MT Tip Structures (A) Kymographs showing an MT tip repair event with 20 nM mCherrry-EB3 and 30 nM GFP-CLASP2α; a schematic of the same event is shown on the right. Scale bars, 2 μm (horizontal) and 60 s (vertical). (B) Averaged fluorescence intensity of GFP-CLASP2α in the MT lattice region between the leading and lagging comet, normalized to the intensity of the complete MT lattice (n = 23). Mean ± SD. (C and D) Growth rates (C) (n = 65 events) and the EB-comet intensities (D) (n = 17 events) before, during, and after comet splitting. EB-comet intensities are normalized to the comet intensity before splitting. (E) Kymograph showing a tip repair event in the presence of 20 nM mCherry-EB3 and 30 nM GFP-TOG2-S. Scale bars, 2 μm (horizontal) and 45 s (vertical). (F) Frequency of tip repair for MTs grown in the presence of 20 nM mCherry-EB3 alone (n = 49) or together with 30 nM TagBFP-CLASP2α (n = 103), or in the presence of 20 nM mCherry-EB3, 30 nM TagBFP-CLASP2α, and 50 nM Eribulin-A488 (n = 56). The frequency was calculated by dividing the number of observed tip repair events by the total growth time, n is the number of MTs analyzed in each condition. Error bars represent SEM. (G) Still images of an MT grown in the presence of Alexa 488-tubulin, 20 nM mCherry-EB3, and 30 nM TagBFP-CLASP2α, showing curling in the region between the leading and the lagging comet. Arrowheads point to the EB comets, yellow points to the leading comets, and blue points to the rear comets. Scale bar, 1 μm. (H) Kymograph and corresponding still images showing an MT tip repair event in MDA-MB-231 cells stably expressing EB3-GFP. The yellow arrowhead points to the leading comet and the blue ones to the rear comets. Scale bars, 2 μm (horizontal) and 5 s (vertical) (kymograph) and 2 μm (cell image). (I) Kymograph showing an MT tip repair event in the presence of HiLyte-488 tubulin, 20 nM mCherry-EB3, and 30 nM TagBFP-CLASP2α, still images and line-scans along the red (EB3) and green (tubulin) channel during tip repair. Scale bars, 2 μm (horizontal) and 30 s (vertical) (kymograph) and 0.5 μm (still images). (J) Illustration of two different MT end tapering models representing sharp (model A, left) and gradual (model B, right) loss of protofilaments. (K and L) Averaged tip intensity profiles of tubulin channel (green) for MTs grown in the presence of 20 nM mCherry-EB3 and 30 nM TagBFP-CLASP2α (K), n = 16, 17, and 17 for before, after, and during tip repair, respectively, and for MTs grown in the presence of 20 nM mCherry-EB3, 30 nM TagBFP-CLASP2α, and 50 nM Eribulin, n = 40, 44, and 27 for before, after, and during tip repair, respectively. Error bars represent SEM. Lines correspond to the best fits of simulations with the optimal model type and parameter values indicated at the top of each plot. (M) The distribution of minimal residuals between simulated and experimental profiles depending on the model. Top table shows optimal parameter values for each case (d is in μm). For each case n = 3. Error bars represent SD. (N) Changes of the mCherry-EB3 comet intensity over time for the lagging comet before the tip repair. Individual traces represent a single tip repair event. The black line is the average of several time traces (n = 22). Intensity values were normalized to the value at the first time point. See also Figures S6 and S7 and Videos S4 and S5.

Comment in

Similar articles

Cited by

References

    1. Adams P.D., Afonine P.V., Bunkoczi G., Chen V.B., Davis I.W., Echols N., Headd J.J., Hung L.W., Kapral G.J., Grosse-Kunstleve R.W. PHENIX: a comprehensive Python-based system for macromolecular structure solution. Acta Crystallogr. D Biol. Crystallogr. 2010;66:213–221. - PMC - PubMed
    1. Akhmanova A., Hoogenraad C.C., Drabek K., Stepanova T., Dortland B., Verkerk T., Vermeulen W., Burgering B.M., De Zeeuw C.I., Grosveld F., Galjart N. Clasps are CLIP-115 and -170 associating proteins involved in the regional regulation of microtubule dynamics in motile fibroblasts. Cell. 2001;104:923–935. - PubMed
    1. Akhmanova A., Steinmetz M.O. Control of microtubule organization and dynamics: two ends in the limelight. Nat. Rev. Mol. Cell Biol. 2015;16:711–726. - PubMed
    1. Al-Bassam J., Chang F. Regulation of microtubule dynamics by TOG-domain proteins XMAP215/Dis1 and CLASP. Trends Cell Biol. 2011;21:604–614. - PMC - PubMed
    1. Al-Bassam J., Kim H., Brouhard G., van Oijen A., Harrison S.C., Chang F. CLASP promotes microtubule rescue by recruiting tubulin dimers to the microtubule. Dev. Cell. 2010;19:245–258. - PMC - PubMed

Publication types

LinkOut - more resources