

Mass probation: Toward a more robust theory of state variation in punishment
- PMID: 29937694
- PMCID: PMC6010031
- DOI: 10.1177/1462474516649174
Mass probation: Toward a more robust theory of state variation in punishment
Abstract
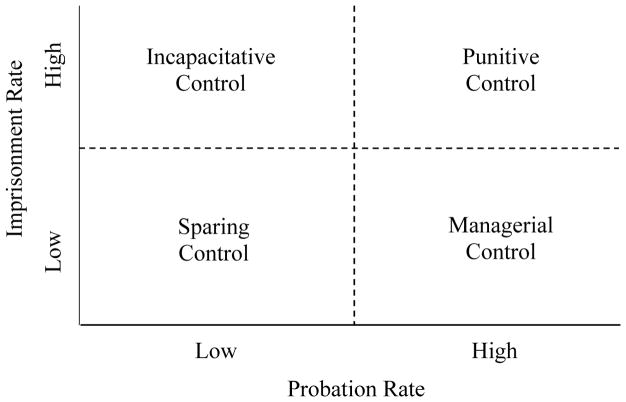
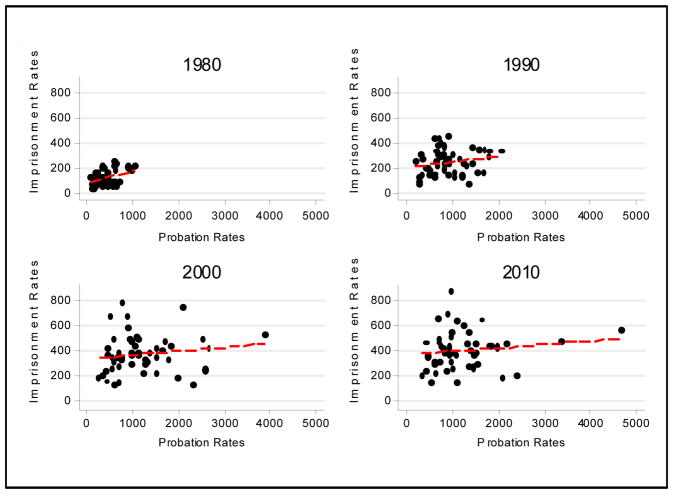
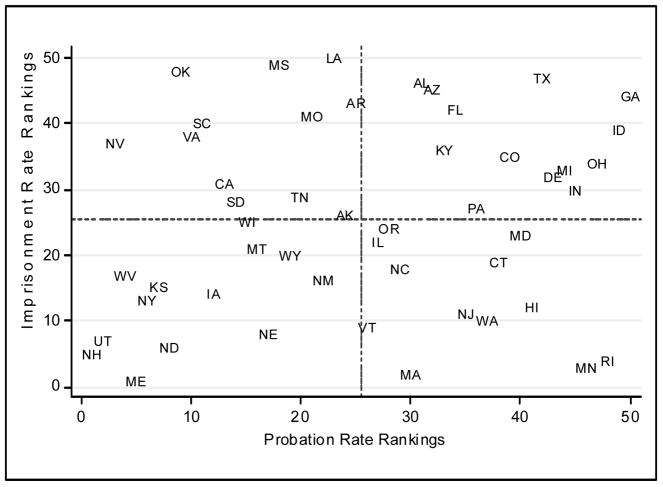
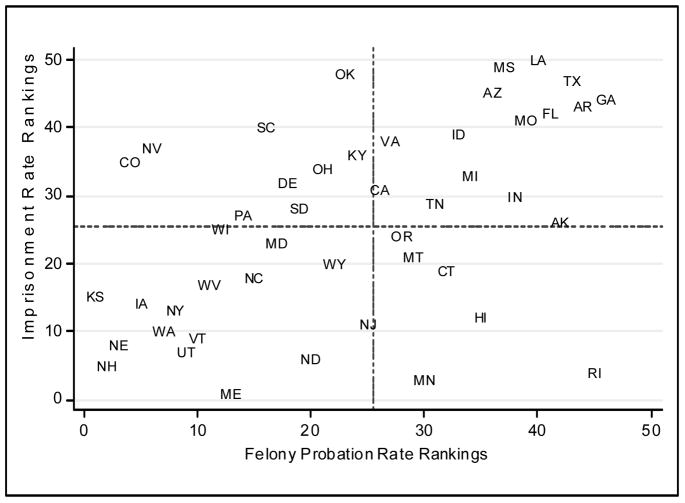
Scholarship on the expansion of the U.S. carceral state has primarily focused on imprisonment rates. Yet the majority of adults under formal criminal justice control are on probation, an "alternative" form of supervision. This article develops the concept of mass probation and builds a typology of state control regimes that theorizes both the scale and type of punishment states employ. Drawing on Bureau of Justice Statistics data from 1980 and 2010, I analyze whether mass probation developed in the same places, affecting the same demographic groups and driven by the same criminal justice trends, as mass imprisonment. The results show that mass probation was a unique state development, expanding in unusual places like Minnesota and Washington. The conclusions argue for a reimagining of the causes and consequences of the carceral state to incorporate the expansion of probation.
Figures
References
-
- Aebi Marcelo F, Delgrande Natalia, Marguet Yann. Have Community Sanctions and Measures Widened the Net of the European Criminal Justice Systems? Punishment & Society. 2015;17(5):575–97.
-
- Alexander Michelle. The New Jim Crow: Mass Imprisonment in the Age of Colorblindness. New York, NY: The New Press; 2010.
-
- Alper Mariel, Croda Alessandro, Reitz Kevin R. American Exceptionalism in Probation Supervision. Minneapolis, MN: Robina Institute of Criminal Law and Criminal Justice; 2016.
-
- Anderson Economic Group LLC. Report commissioned by the Justice Fellowship. Lansing, Michigan: Anderson Economic Group; 2013. Incentives in State Probation Systems: Relation to Structure and Practices.
-
- Ball W David. Tough on Crime (on the State’s Dime): How Violent Crime Does Not Drive California Counties’ Imprisonment Rates - And Why It Should. Georgia State University Law Review. 2011;28:987–1084.
Grants and funding
LinkOut - more resources
Full Text Sources
Other Literature Sources