. 2018 Jun 8:9:1247.
doi: 10.3389/fimmu.2018.01247. eCollection 2018.

Monocyte Subsets Have Distinct Patterns of Tetraspanin Expression and Different Capacities to Form Multinucleate Giant Cells

Affiliations

Monocyte Subsets Have Distinct Patterns of Tetraspanin Expression and Different Capacities to Form Multinucleate Giant Cells

Thomas C Champion et al. Front Immunol. .

Abstract

Monocytes are able to undergo homotypic fusion to produce different types of multinucleated giant cells, such as Langhans giant cells in response to M. tuberculosis infection or foreign body giant cells in response to implanted biomaterials. Monocyte fusion is highly coordinated and complex, with various soluble, intracellular, and cell-surface components mediating different stages of the process. Tetraspanins, such as CD9, CD63, and CD81, are known to be involved in cell:cell fusion and have been suggested to play a role in regulating homotypic monocyte fusion. However, peripheral human monocytes are not homogenous: they exist as a heterogeneous population consisting of three subsets, classical (CD14++CD16-), intermediate (CD14++CD16+), and non-classical (CD14+CD16+), at steady state. During infection with mycobacteria, the circulating populations of intermediate and non-classical monocytes increase, suggesting they may play a role in the disease outcome. Human monocytes were separated into subsets and then induced to fuse using concanavalin A. The intermediate monocytes were able to fuse faster and form significantly larger giant cells than the other subsets. When antibodies targeting tetraspanins were added, the intermediate monocytes responded to anti-CD63 by forming smaller giant cells, suggesting an involvement of tetraspanins in fusion for at least this subset. However, the expression of fusion-associated tetraspanins on monocyte subsets did not correlate with the extent of fusion or with the inhibition by tetraspanin antibody. We also identified a CD9High and a CD9Low monocyte population within the classical subset. The CD9High classical monocytes expressed higher levels of tetraspanin CD151 compared to CD9Low classical monocytes but the CD9High classical subset did not exhibit greater potential to fuse and the role of these cells in immunity remains unknown. With the exception of dendrocyte-expressed seven transmembrane protein, which was expressed at higher levels on the intermediate monocyte subset, the expression of fusion-related proteins between the subsets did not clearly correlate with their ability to fuse. We also did not observe any clear correlation between giant cell formation and the expression of pro-inflammatory or fusogenic cytokines. Although tetraspanin expression appears to be important for the fusion of intermediate monocytes, the control of multinucleate giant cell formation remains obscure.

Keywords: cd9; fusion; monocyte; monocyte subsets; tetraspanin.


Figures

Figure 1
Figure 1
Cell fate during ConA-induced fusion varies between monocyte subsets. The fate of sorted monocyte subsets was determined by counting nuclei at 24, 48, and 72 h and expressed as a percentage of the cell numbers originally plated. Bars represent means ± SEM, n = 8. Significance was tested with a Kruskal–Wallis test with a Dunn’s multiple comparisons test comparing the means of the same fate and time point against the other subsets. Black bars/red error bars: detached cells, gray bars/green error bars: single cells and white bars/blue error bars: fused cells with >3 nuclei.
Figure 2
Figure 2
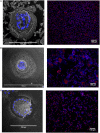
Fusion in different monocyte subsets imaged by tandem fluorescent scanning electron microscopy (SEM) and wide field fluorescence microscopy. (A–C) left panels. monocyte-derived giant cell (MGC) were generated by 72-h concanavalin A (ConA) treatment of FACS-sorted monocyte subsets, stained with Hoechst and then raster-scanned so that the MGC imaged in SEM could be located and the nuclear channel overlaid onto the image. Nuclei shown in blue. (A–C) right panels. Three representative montages containing images taken of each of the monocyte subsets from one donor after 72 h ConA treatment. Blue = F-actin, Red = nuclei. (A) classical, (B) intermediate, (C) non-classical subset-derived MGC.
Figure 3
Figure 3
Fusion parameters vary between monocyte purification method and between subsets. (A–C) Unfractionated monocytes, purified by magnet-activated cell sorting (MACS) or adherence were incubated for 72 h with concanavalin A (ConA) to induce fusion. After fluorescence imaging, three parameters of monocyte-derived giant cell (MGC) were recorded: median number of nuclei/MGC, fusion index (FI), and median area occupied by each MGC. Significance was tested using an unpaired t-test. (D–F) Monocytes sorted into subsets by FACS were incubated for 72 h with ConA to induce fusion. After fluorescence imaging, three parameters of MGC were recorded: median number of nuclei/MGC, FI and median area occupied by each MGC. Significance was tested with a Kruskal–Wallis test with a Dunn’s multiple comparisons test. (G–I) After 24, 48, and 72 h incubation with ConA, the proportions of each type of MGC were recorded and presented as a percentage of the total fused nuclei counted. Bars represent means ± SEM, n = 8. Significance was tested with a Kruskal–Wallis test with a Dunn’ multiple comparisons test comparing the means of the same MGC type within the same time point against the other subset means. Black bars/red error bars: Langhans giant cell, gray bars/green error bars: FBGC and white bars/blue error bars: syncitial giant cell (SGC).
Figure 4
Figure 4
Tetraspanin expression varies between monocyte subsets. Monocytes were either freshly sorted into subsets by FACS, or were purified then allowed to adhere, incubated for 4 h with concanavalin A (ConA) to induce fusion and then harvested, before being tested for the expression of a panel of common myeloid cell tetraspanins using flow cytometry. (A) Freshly purified monocyte subsets, expression level per cell (MFI). (B) Freshly purified monocyte subsets, percentage of the cell population with expression above isotype control binding levels. (C) Adherent, ConA treated monocytes, expression level per cell (MFI). (D) Adherent, ConA treated monocytes, percentage of the cell population with expression above isotype control binding levels. The data are the means ± SEM of monocytes from four donors. For (A,B), significance was tested by two-way ANOVA and a Tukey multiple comparison test. For (C,D), significance was tested with multiple t tests with Benjami, Krieger, and Yekutieli false discovery rate approach and Holme–Sidak multiple comparisons.
Figure 5
Figure 5
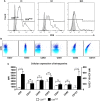
A tetraspanin CD9High subset of classical monocytes. (A) Histograms showing the expression of CD9 on freshly isolated classical (Cl), intermediate (Int), and non-classical (NCl) monocyte subsets from a representative donor, with isotype control fluorescence shown as shaded areas. The gating strategy to separate the CD9High and CD9Low populations is indicated by the markers. CD9 was the only tetraspanin in the histograms to show a bimodal peak of expression. (B) Dot-plots showing the surface co-expression of tetraspanins on classical subset monocytes with CD9 from a representative donor. Increasing expression of CD9 is indicated by the blue shading. (C) Quantification of tetraspanin expression on Cl subset monocytes gated for CD9 high and low expression as shown in panel A. Bars represent the means ± SEM, from 10 different donors. Significance was tested using one-way ANOVA with Sidak’s multiple comparisons test for each pair of columns.
Figure 6
Figure 6
Anti-tetraspanin antibodies do not affect cell fate during concanavalin A (ConA)-induced fusion. The fate of sorted monocyte subsets was determined by counting nuclei at 72 h and expressed as a percentage of the cell numbers originally plated. Bars represent means ± SEM, n = 3–8. Significance was tested with a Kruskal–Wallis test with Dunn’s multiple comparisons test comparing the means of the same state within the same time point against the other subsets. Black bars/red error bars: detached cells, gray bars/green error bars: single cells and white bars/blue error bars: fused cells with >3 nuclei.
Figure 7
Figure 7
Anti-CD63 antibodies can modulate giant cell morphology only in the intermediate monocyte subset. Purified monocyte subsets were cultured in media containing concanavalin A (ConA) and either an anti-tetraspanin antibody or IgG1 control at 10 µg ml−1 for 72 h. Nuclei counted inside each monocyte-derived giant cell (MGC) were ascribed to one of the giant cell types and presented as a percentage of the fused nuclei counted. Bars represent means ± SEM, n = 3–8, tested with a Kruskal–Wallis test with Dunn’s multiple comparisons tests comparing the same MGC types between the anti-tetraspanin conditions and the IgG1 control. Black bars/red error bars: Langhans giant cell, gray bars/green error bars: foreign body giant cell and white bars/blue error bars: SGC.
Figure 8
Figure 8
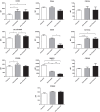
Anti-tetraspanin antibodies inhibit fusion rate and size of giant cells produced by intermediate monocyte subset. Purified monocyte subsets were cultured in media containing (ConA) and either an anti-tetraspanin antibody or IgG1 control at 10 µg ml−1 for 72 h. Bars represent means ± SEM, of 3–8 separate experiments. Significance was tested with a Kruskal–Wallis test and a Dunn’s multiple comparisons test comparing the anti-tetraspanin antibody means against the IgG1 control within each subset.
Figure 9
Figure 9
The expression of fusion-related molecules is higher on intermediate monocyte subset. Freshly isolated monocytes were analyzed for fusion protein expression on subsets using flow cytometry. Bars indicate means ± SD from three separate experiments. Significance of difference between subsets was tested with a one-way ANOVA and a Tukey multiple comparisons test.
Figure 10
Figure 10
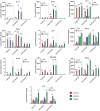
Cytokine production profiles during fusion do not correlate with fusion rate or giant cell morphology. Supernatants from the fusing monocytes were collected and analyzed by ELISA for 15 cytokines relevant to fusion. Clear bars: control (NA), striped bars: concanavalin A (ConA) treated; with each time point [24 (red), 48 (purple), 72 h (green)] presented in adjacent pairs. Bars represent means ± SEM, from eight separate experiments, all tested for significance with a two-way ANOVA with a Sidak’s multiple comparison test comparing the means of control (NA) vs ConA treated monocytes at the same time point within each subset.

Similar articles

Cited by

References

    1. Auffray C, Sieweke MH, Geissmann F. Blood monocytes: development, heterogeneity, and relationship with dendritic cells. Annu Rev Immunol (2009) 27:669–92.10.1146/annurev.immunol.021908.132557 - DOI - PubMed
    1. Serbina NV, Jia T, Hohl TM, Pamere EG. Monocyte-mediated defense against microbial pathogens. Annu Rev Immunol (2008) 26:421–52.10.1146/annurev.immunol.26.021607.090326 - DOI - PMC - PubMed
    1. Wong KL, Yeap WH, Tai JJY, Ong SM, Dang TM, Wong SC. The three human monocyte subsets: implications for health and disease. Immunol Res (2012) 53:41–57.10.1007/s12026-012-8297-3 - DOI - PubMed
    1. Ziegler-Heitbrock L, Ancuta P, Crowe S, Dalod M, Grau V, Hart DN, et al. Nomenclature of monocytes and dendritic cells in blood. Blood (2010) 116:E74–80.10.1182/blood-2010-02-258558 - DOI - PubMed
    1. Patel AA, Zhang Y, Fullerton JN, Boelen L, Rongvaux A, Maini AA, et al. The fate and lifespan of human monocyte subsets in steady state and systemic inflammation. J Exp Med (2017) 214:1913–23.10.1084/jem.20170355 - DOI - PMC - PubMed

Publication types