

Cytogenetic damage analysis in mice chronically exposed to low-dose internal tritium beta-particle radiation
- PMID: 29937993
- PMCID: PMC6007944
- DOI: 10.18632/oncotarget.25282
Cytogenetic damage analysis in mice chronically exposed to low-dose internal tritium beta-particle radiation
Abstract
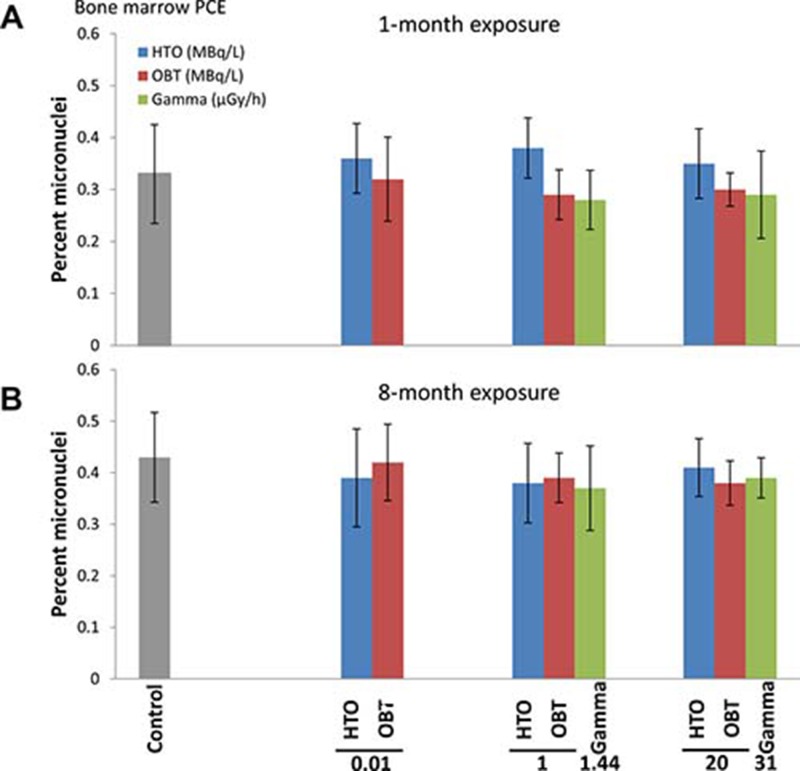
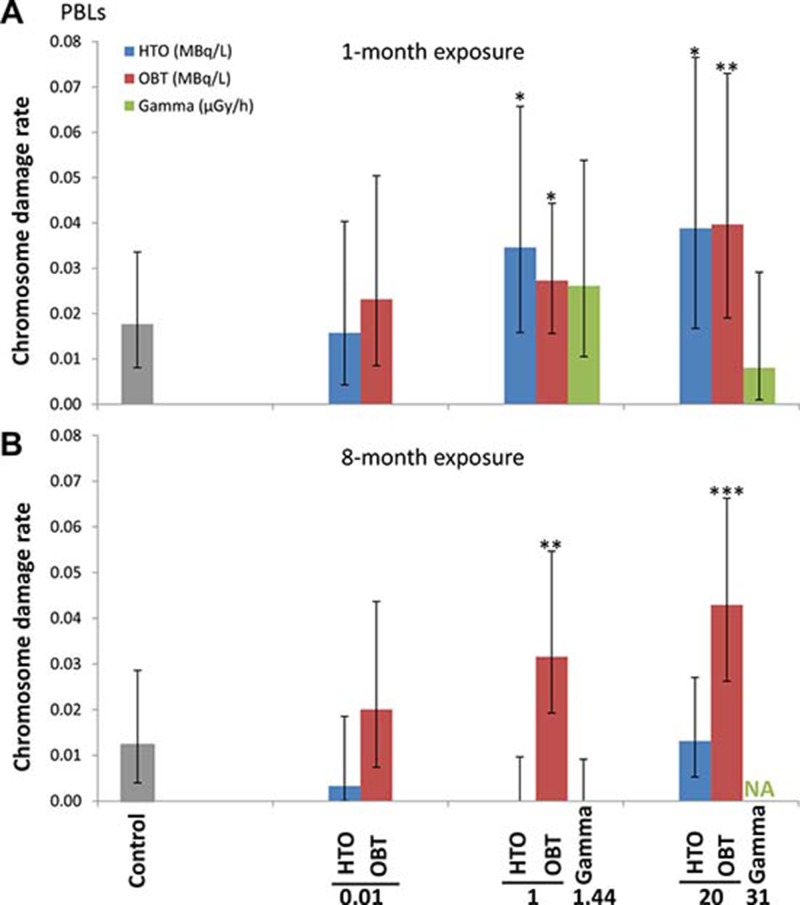
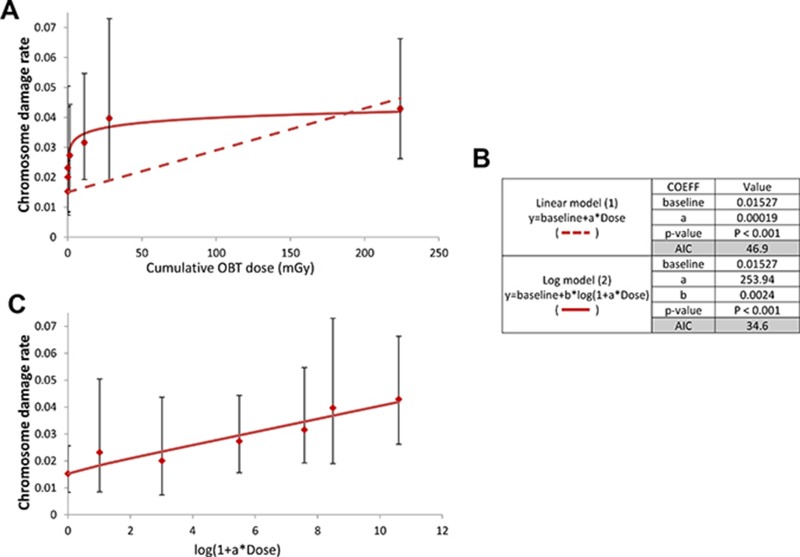
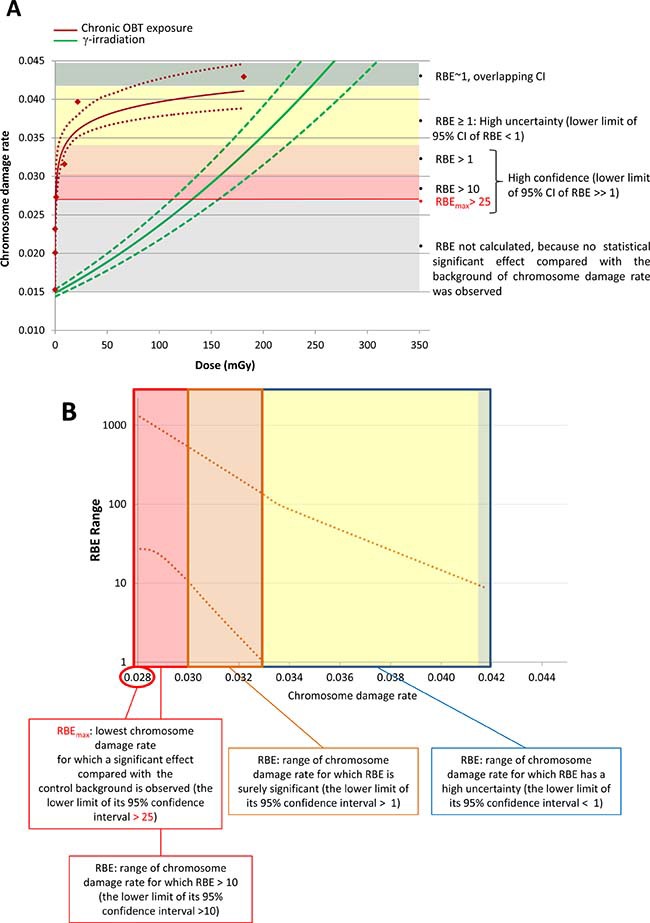
The aim of this study was to carry out a comprehensive examination of potential genotoxic effects of low doses of tritium delivered chronically to mice and to compare these effects to the ones resulting from equivalent doses of gamma-irradiation. Mice were chronically exposed for one or eight months to either tritiated water (HTO) or organically bound tritium (OBT) in drinking water at concentrations of 10 kBq/L, 1 MBq/L or 20 MBq/L. Dose rates of internal β-particle resulting from such tritium treatments were calculated and matching external gamma-exposures were carried out. We measured cytogenetic damage in bone marrow and in peripheral blood lymphocytes (PBLs) and the cumulative tritium doses (0.009 - 181 mGy) were used to evaluate the dose-response of OBT in PBLs, as well as its relative biological effectiveness (RBE). Neither tritium, nor gamma exposures produced genotoxic effects in bone marrow. However, significant increases in chromosome damage rates in PBLs were found as a result of chronic OBT exposures at 1 and 20 M Bq/L, but not at 10 kBq/L. When compared to an external acute gamma-exposure ex vivo, the RBE of OBT for chromosome aberrations induction was evaluated to be significantly higher than 1 at cumulative tritium doses below 10 mGy. Although found non-existent at 10 kBq/L (the WHO limit), the genotoxic potential of low doses of tritium (>10 kBq/L), mainly OBT, may be higher than currently assumed.
Keywords: chronicle; genotoxicity; low-dose; tritium exposure.
Conflict of interest statement
CONFLICTS OF INTEREST None declared.
Figures
Similar articles
-
Environmentally Relevant Chronic Low-Dose Tritium and Gamma Exposures do not Increase Somatic Intrachromosomal Recombination in pKZ1 Mouse Spleen.Radiat Res. 2016 Dec;186(6):539-548. doi: 10.1667/RR14564.1. Epub 2016 Dec 6. Radiat Res. 2016. PMID: 27922333
-
Uncertainties in dose coefficients for intakes of tritiated water and organically bound forms of tritium by members of the public.Radiat Prot Dosimetry. 2002;98(3):299-311. doi: 10.1093/oxfordjournals.rpd.a006722. Radiat Prot Dosimetry. 2002. PMID: 12018747 Review.
-
Relative biological effectiveness and dose rate effect of tritiated water on chromosomes in human lymphocytes and bone marrow cells.Mutat Res. 1994 Jan-Feb;323(1-2):53-61. doi: 10.1016/0165-7992(94)90045-0. Mutat Res. 1994. PMID: 7508567
-
Genotoxic and reprotoxic effects of tritium and external gamma irradiation on aquatic animals.Rev Environ Contam Toxicol. 2012;220:67-103. doi: 10.1007/978-1-4614-3414-6_3. Rev Environ Contam Toxicol. 2012. PMID: 22610297 Review.
-
Organically bound tritium (OBT) formation in rainbow trout (Oncorhynchus mykiss): HTO and OBT-spiked food exposure experiments.Appl Radiat Isot. 2013 Feb;72:114-22. doi: 10.1016/j.apradiso.2012.10.001. Epub 2012 Oct 17. Appl Radiat Isot. 2013. PMID: 23208241
Cited by
-
Radiation-resistant bacteria in desiccated soil and their potentiality in applied sciences.Front Microbiol. 2024 Jun 4;15:1348758. doi: 10.3389/fmicb.2024.1348758. eCollection 2024. Front Microbiol. 2024. PMID: 38894973 Free PMC article. Review.
-
Cyto-Genotoxicity of Tritiated Stainless Steel and Cement Particles in Human Lung Cell Models.Int J Mol Sci. 2022 Sep 8;23(18):10398. doi: 10.3390/ijms231810398. Int J Mol Sci. 2022. PMID: 36142309 Free PMC article.
-
Hto, Tritiated Amino Acid Exposure and External Exposure Induce Differential Effects on Hematopoiesis and Iron Metabolism.Sci Rep. 2019 Dec 27;9(1):19919. doi: 10.1038/s41598-019-56453-4. Sci Rep. 2019. PMID: 31882739 Free PMC article.
-
Effects of Chronic Low-Dose Internal Radiation on Immune-Stimulatory Responses in Mice.Int J Mol Sci. 2021 Jul 7;22(14):7303. doi: 10.3390/ijms22147303. Int J Mol Sci. 2021. PMID: 34298925 Free PMC article.
-
Hydrogen-rich water attenuates the radiotoxicity induced by tritium exposure in vitro and in vivo.J Radiat Res. 2021 Jan 1;62(1):34-45. doi: 10.1093/jrr/rraa104. J Radiat Res. 2021. PMID: 33231266 Free PMC article.
References
-
- Kotzer T, Trivedi A. Dosimetric implications of atmospheric dispersal of tritium near a heavy-water research reactor facility. Radiat Prot Dosimetry. 2001;93:61–6. - PubMed
-
- Dingwall S, Mills CE, Phan N, Taylor K, Boreham DR. Human Health and the Biological Effects of Tritium in Drinking Water: Prudent Policy Through Science - Addressing the ODWAC New Recommendation. Dose Response. 2011;9:6–31. https://doi.org/10.2203/dose-response.10-048.Boreham - DOI - PMC - PubMed
-
- Okada S, Momoshima N. Overview of tritium: characteristics, sources, and problems. Health Phys. 1993;65:595–609. - PubMed
-
- Hamby DM. Uncertainty of the tritium dose conversion factor. Health Phys. 1999;77:291–7. - PubMed
LinkOut - more resources
Full Text Sources
Other Literature Sources
