Synuclein gamma expression enhances radiation resistance of breast cancer cells
- PMID: 29937996
- PMCID: PMC6007952
- DOI: 10.18632/oncotarget.25415
Synuclein gamma expression enhances radiation resistance of breast cancer cells
Abstract
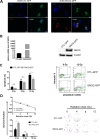
Resistance to therapy is a major obstacle for the effective treatment of cancer. Expression of synuclein-gamma (SNCG) has been associated with poor prognosis and resistance to therapy. While reports on SNCG overexpression contributing to chemoresistance exist, limited information is available on the relationship between SNCG and radioresistance of cancer cells. Here we investigated the role of SNCG in radiation resistance in breast cancer cells. siRNA mediated knockdown of SNCG (siSNCG) markedly reduced SNCG protein level compared to scrambled siRNA (siScr) treatment. Furthermore, siSNCG treatment sensitized Estrogen Receptor-positive breast cancer cells (MCF7 and T47D) to ionizing radiation at 4 to 12 Gy as evidenced by the significant increase of apoptotic or senescent cells and reduction in clonogenic cell survival in siSNCG treated cells compared to siScr treated cells. On the other hand, we established an in vitro model of SNCG ectopic expression by using a triple-negative breast cancer cell line (SUM159PT) to further investigate the radioprotective effect of SNCG. We showed that ectopic expression of SNCG significantly decreased apoptosis of SUM159PT cells and enhanced clonogenic cell survival after radiation treatment. At the molecular level, after irradiation, the p53 pathway was less activated when SNCG was present. Conversely, p21Waf1/Cip1 expression was upregulated in SNCG-expressing cells. When p21 was down-regulated by siRNA, radiosensitivity of SNCG-expressing SUM159PT cells was dramatically increased. This suggested a possible connection between p21 and SNCG in radioresistance in these cells. In conclusion, our data provide for the first time experimental evidence for the role of SNCG in the radioresistance of breast cancer cells.
Keywords: biomarker; breast cancer; radiation; resistance; synuclein gamma.
Conflict of interest statement
CONFLICTS OF INTEREST The authors declare no competing or financial interests that could be perceived as prejudicing the impartiality of the research reported.
Figures


Similar articles
-
HuR silencing elicits oxidative stress and DNA damage and sensitizes human triple-negative breast cancer cells to radiotherapy.Oncotarget. 2016 Oct 4;7(40):64820-64835. doi: 10.18632/oncotarget.11706. Oncotarget. 2016. PMID: 27588488 Free PMC article.
-
[The correlation of synuclein-γ and matrix metalloproteinase 9 in breast cancer].Zhonghua Wai Ke Za Zhi. 2013 Jul;51(7):641-4. Zhonghua Wai Ke Za Zhi. 2013. PMID: 24256593 Chinese.
-
Overexpression of synuclein-γ predicts lack of benefit from radiotherapy for breast cancer patients.BMC Cancer. 2016 Sep 5;16(1):717. doi: 10.1186/s12885-016-2750-y. BMC Cancer. 2016. PMID: 27595752 Free PMC article.
-
Synuclein-gamma targeting peptide inhibitor that enhances sensitivity of breast cancer cells to antimicrotubule drugs.Cancer Res. 2007 Jan 15;67(2):626-33. doi: 10.1158/0008-5472.CAN-06-1820. Cancer Res. 2007. PMID: 17234772
-
Targeting synuclein-gamma to counteract drug resistance in cancer.Expert Opin Ther Targets. 2008 Jan;12(1):59-68. doi: 10.1517/14728222.12.1.59. Expert Opin Ther Targets. 2008. PMID: 18076370 Review.
Cited by
-
Cancer Cells Enter an Adaptive Persistence to Survive Radiotherapy and Repopulate Tumor.Adv Sci (Weinh). 2023 Mar;10(8):e2204177. doi: 10.1002/advs.202204177. Epub 2023 Jan 19. Adv Sci (Weinh). 2023. PMID: 36658726 Free PMC article.
-
Upregulation of Synuclein-γ and Snai1 Contributes to Poor Clinical Prognosis in Oral Squamous Cell Carcinoma Patients.Biomed Res Int. 2022 Apr 7;2022:6534626. doi: 10.1155/2022/6534626. eCollection 2022. Biomed Res Int. 2022. PMID: 35434126 Free PMC article.
-
Adiponectin paradox as a therapeutic target of the cancer evolvability in aging.Neoplasia. 2021 Jan;23(1):112-117. doi: 10.1016/j.neo.2020.11.008. Epub 2020 Dec 9. Neoplasia. 2021. PMID: 33310207 Free PMC article. Review.
-
Transformer-based modeling of Clonal Selection and Expression Dynamics reveals resistance mechanisms in breast cancer.NPJ Syst Biol Appl. 2025 Jan 10;11(1):5. doi: 10.1038/s41540-024-00485-8. NPJ Syst Biol Appl. 2025. PMID: 39794360 Free PMC article.
-
The Herbal Combination Shu Gan Jie Yu Regulates the SNCG/ER-a/AKT-ERK Pathway in DMBA-Induced Breast Cancer and Breast Cancer Cell Lines Based on RNA-Seq and IPA Analysis.Integr Cancer Ther. 2024 Jan-Dec;23:15347354241233258. doi: 10.1177/15347354241233258. Integr Cancer Ther. 2024. PMID: 38369762 Free PMC article.
References
-
- Torre LA, Bray F, Siegel RL, Ferlay J, Lortet-Tieulent J, Jemal A. Global cancer statistics, 2012. CA Cancer J Clin. 2015;65:87–108. https://doi.org/10.3322/caac.21262 - DOI - PubMed
-
- Early Breast Cancer Trialists’ Collaborative Group. Favourable and unfavourable effects on long-term survival of radiotherapy for early breast cancer: an overview of the randomised trials. Lancet. 2000;355:1757–70. https://doi.org/10.1016/S0140-6736(00)02263-7 - DOI - PubMed
-
- Clayton DF, George JM. The synucleins: a family of proteins involved in synaptic function, plasticity, neurodegeneration and disease. Trends Neurosci. 1998;21:249–54. https://doi.org/10.1016/S0166-2236(97)01213-7 - DOI - PubMed
-
- Liu J, Spence MJ, Zhang YL, Jiang Y, Liu YE, Shi YE. Transcriptional suppression of synuclein γ (SNCG) expression in human breast cancer cells by the growth inhibitory cytokine oncostatin M. Breast Cancer Res Treat. 2000;62:99–107. https://doi.org/10.1023/A:1006418219012 - DOI - PubMed
LinkOut - more resources
Full Text Sources
Other Literature Sources
Molecular Biology Databases
Research Materials
Miscellaneous

